Are Traders Positioned for a Rate Cut?
It's the most anticipated cut in years. Will traders profit from the news?
You've reached your free article limit
You've read 0 of 1 free Pro articles.
The Market
We are short-term overbought, or will be by the end of the day Wednesday.
Obviously, the QQQs did not make it to ten in a row, and that means the DSI did not rise any further.
But the Utes got slammed, although I imagine I will like them into a pullback again. Retail sales beat expectations, but the retailers ended down on the day. And the VIX has been steadily rising all week, and the put/call ratio finally fell under .80.
That tells me folks are positioned for a Fed cut tomorrow, and they believe the market will reward them. It might. We did not rally into the meeting, so it is a coin toss, but I’m leaning toward a pullback before the week is out.
After all, everyone has stopped talking about seasonality, and no one is talking about the old adage about selling Rosh Hashanah, the Jewish New Year, and buying Yom Kippur, the day of atonement. A little whack will do the market good.
None of the indicators have budged once again, so not much has changed. Let’s see if the FOMC brings us any fireworks.
New Ideas
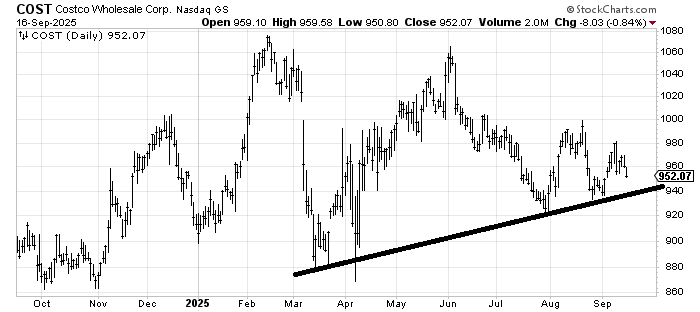
I want to follow up on Costco COST because it rallied last week, but it made a lower high and looks as if it wants to test that uptrend line again. A break of that 920-940 area would be bearish.
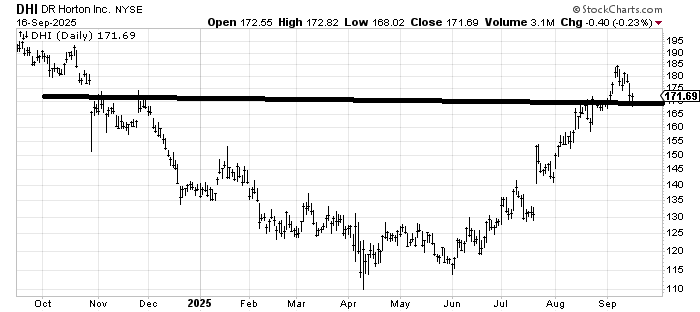
Last week, I said DR Horton DHI was still okay, but I’d like to see it come down to 170 to see what’s down there. It has come down and is trying to hold. If it breaks it, I’d fret over that. It’s the first correction after a huge run. If the stock is any good, it should get bought fast, so if it doesn’t, there’s probably a bigger correction in store.
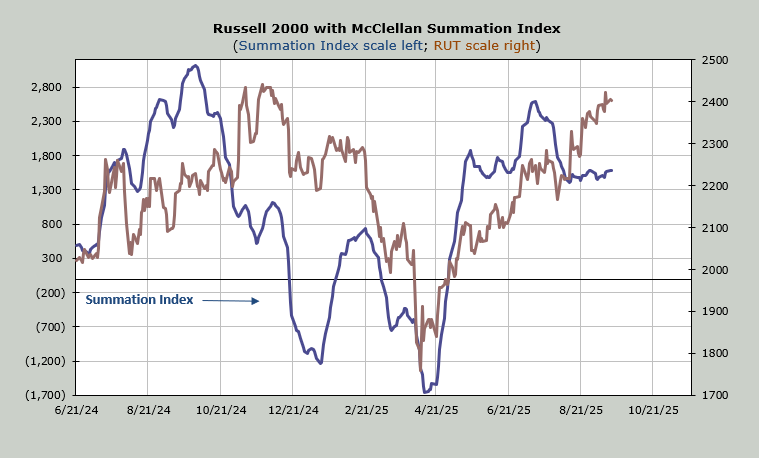
Today’s Indicator
The McClellan Summation Index is so flat, I’m not sure I have ever seen it like this.
Q&A/Reader’s Feedback
Helene welcomes your questions about Top Stocks and her charting strategy and techniques. Please send an email directly to Helene with your questions. However, please remember that TheStreet.com Top Stocks is not intended to provide personalized investment advice. Email Helene here.
Note: You will see many high flyers listed here, and many are over-extended and/or have hit their targets. If you don’t want to live through a pullback in them, then consider booking some profits.
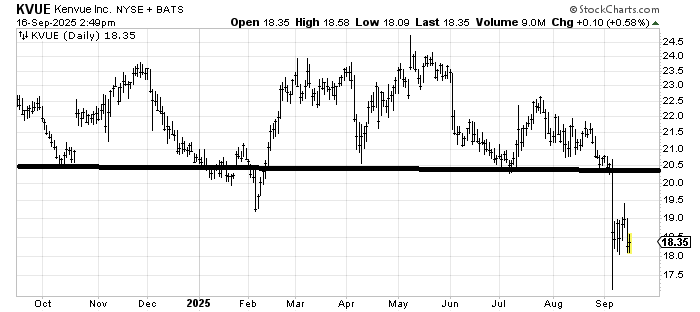
Kenvue (KVUE) is not a pretty chart, having just broken down from a decent-sized top. The pattern measures to 16-ish, but my view that spike lows tend to hold on the first trip down means that I would expect if the stock has a visit into that area in the next few weeks, I’d look for a bounce. But also keep in mind the time of the year. I would expect tax loss selling to show up into year-end. For now, I would treat it as a trade.
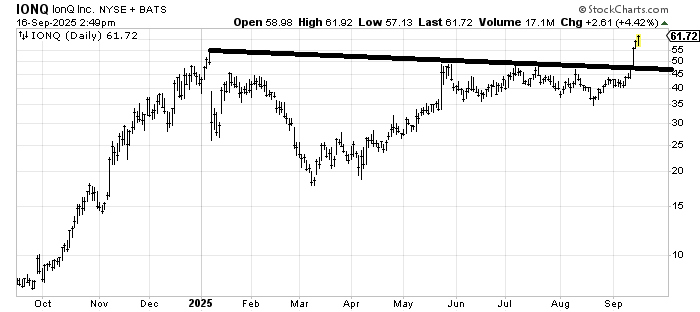
IonQ IONQ is stretched, but it just broke out. There is a longer-term measured target around 75, but it is vulnerable to a pullback given how stretched it is up here.
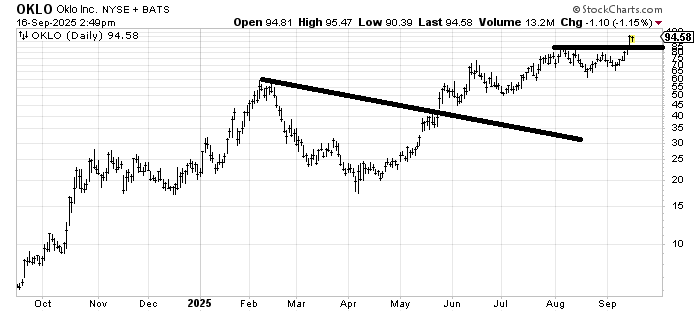
Oklo (OKLO) has a next measured target around 100. The recent sideways pattern measures to that area, and there is the 90/100 rule, which says 90% of the stocks that make it to 90 will make it to 100.
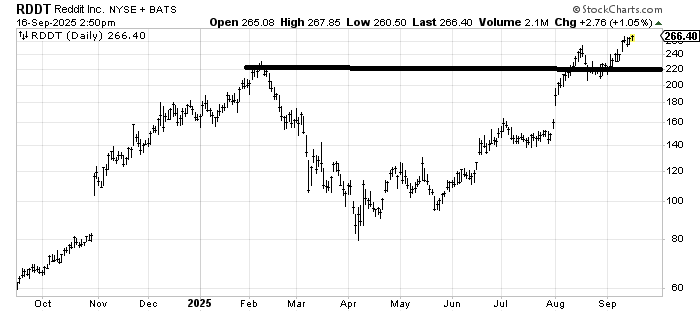
Reddit RDDT hasn’t done anything wrong yet. In fact, it broke out and tested the breakout. I can’t chase a stock up like this, but it’s a hold. If it breaks back under 220 (far away) I’d be concerned. A pullback to 240-250 is more likely.
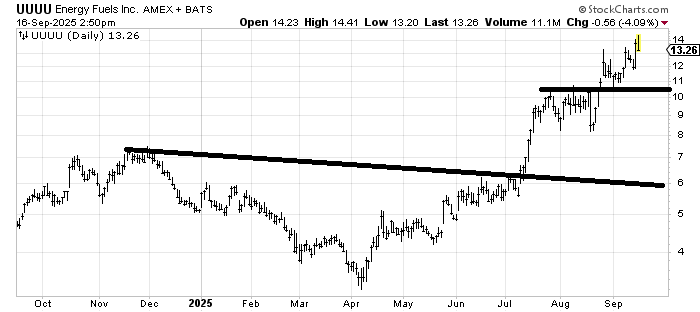
Energy Fuels (UUUU) looks a bit tired up here, but that’s the worst I can say right now. It has no pattern left, though, so it could use some sideways action.
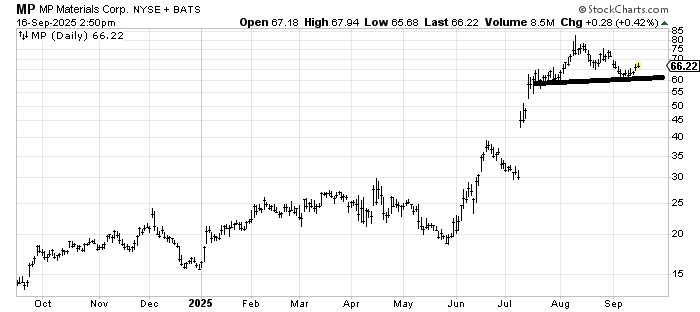
Quite frankly, I would love MP Materials MP to come down to 50 and fill that gap, but barring that, I would just use 60 as a stop area.
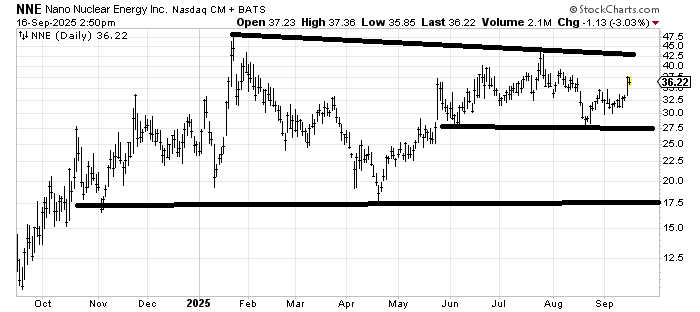
Nano Nuclear Energy (NNE) is in the middle of nowhere. It can’t seem to get to the July high, but can’t break 27 either. I’d get concerned if it can’t get over 40 in the next week.
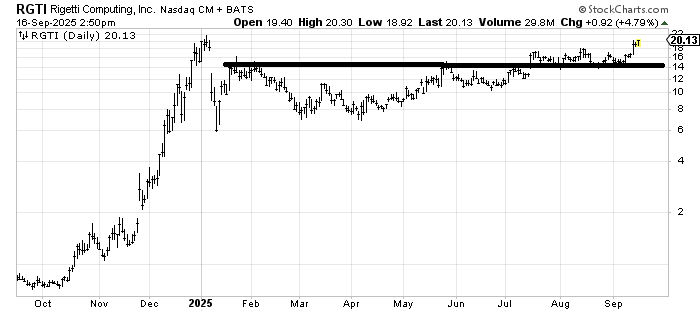
Rigetti Computing RGTI, a stock I recommended months ago, is finally reaching the old high, which was my original target area (21-22). But it hasn’t done anything wrong yet. If you wanted to take some profits here, I wouldn’t argue, though.
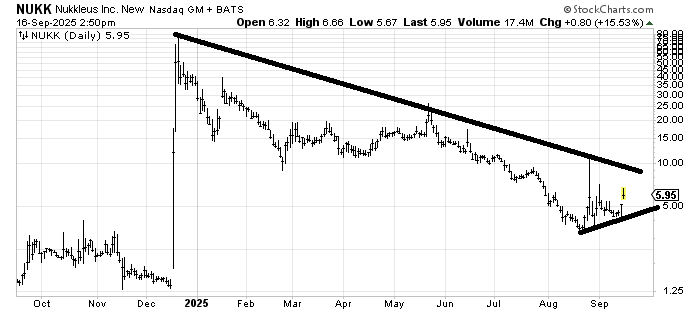
The chart of Nukkleus (NUKK) is exactly the type of chart I tend to get sucked into; makes a low, rallies, and comes back down to make an equal or higher low (a W), so I guess as long as it doesn’t break under that lower line, we give it a chance. But it trades very spiky, and 10 is serious resistance.