New Apple Price Target Amid Magnificent 7 Tug of War
As Apple and Alphabet lift the markets, Microsoft, Meta Platforms and Netflix are pulling it down.
You've reached your free article limit
You've read 0 of 1 free Pro articles.
In a continuation of Friday’s broad market rally, the S&P 500 jumped 1.5% on Monday, while the Nasdaq Composite soared 2.8%. It was the Nasdaq's best day in over six months.
The S&P 500 rallied after finding strong support just below the 6550 level (black horizontal line). That area is now the origin of two solid bounces (arrows).
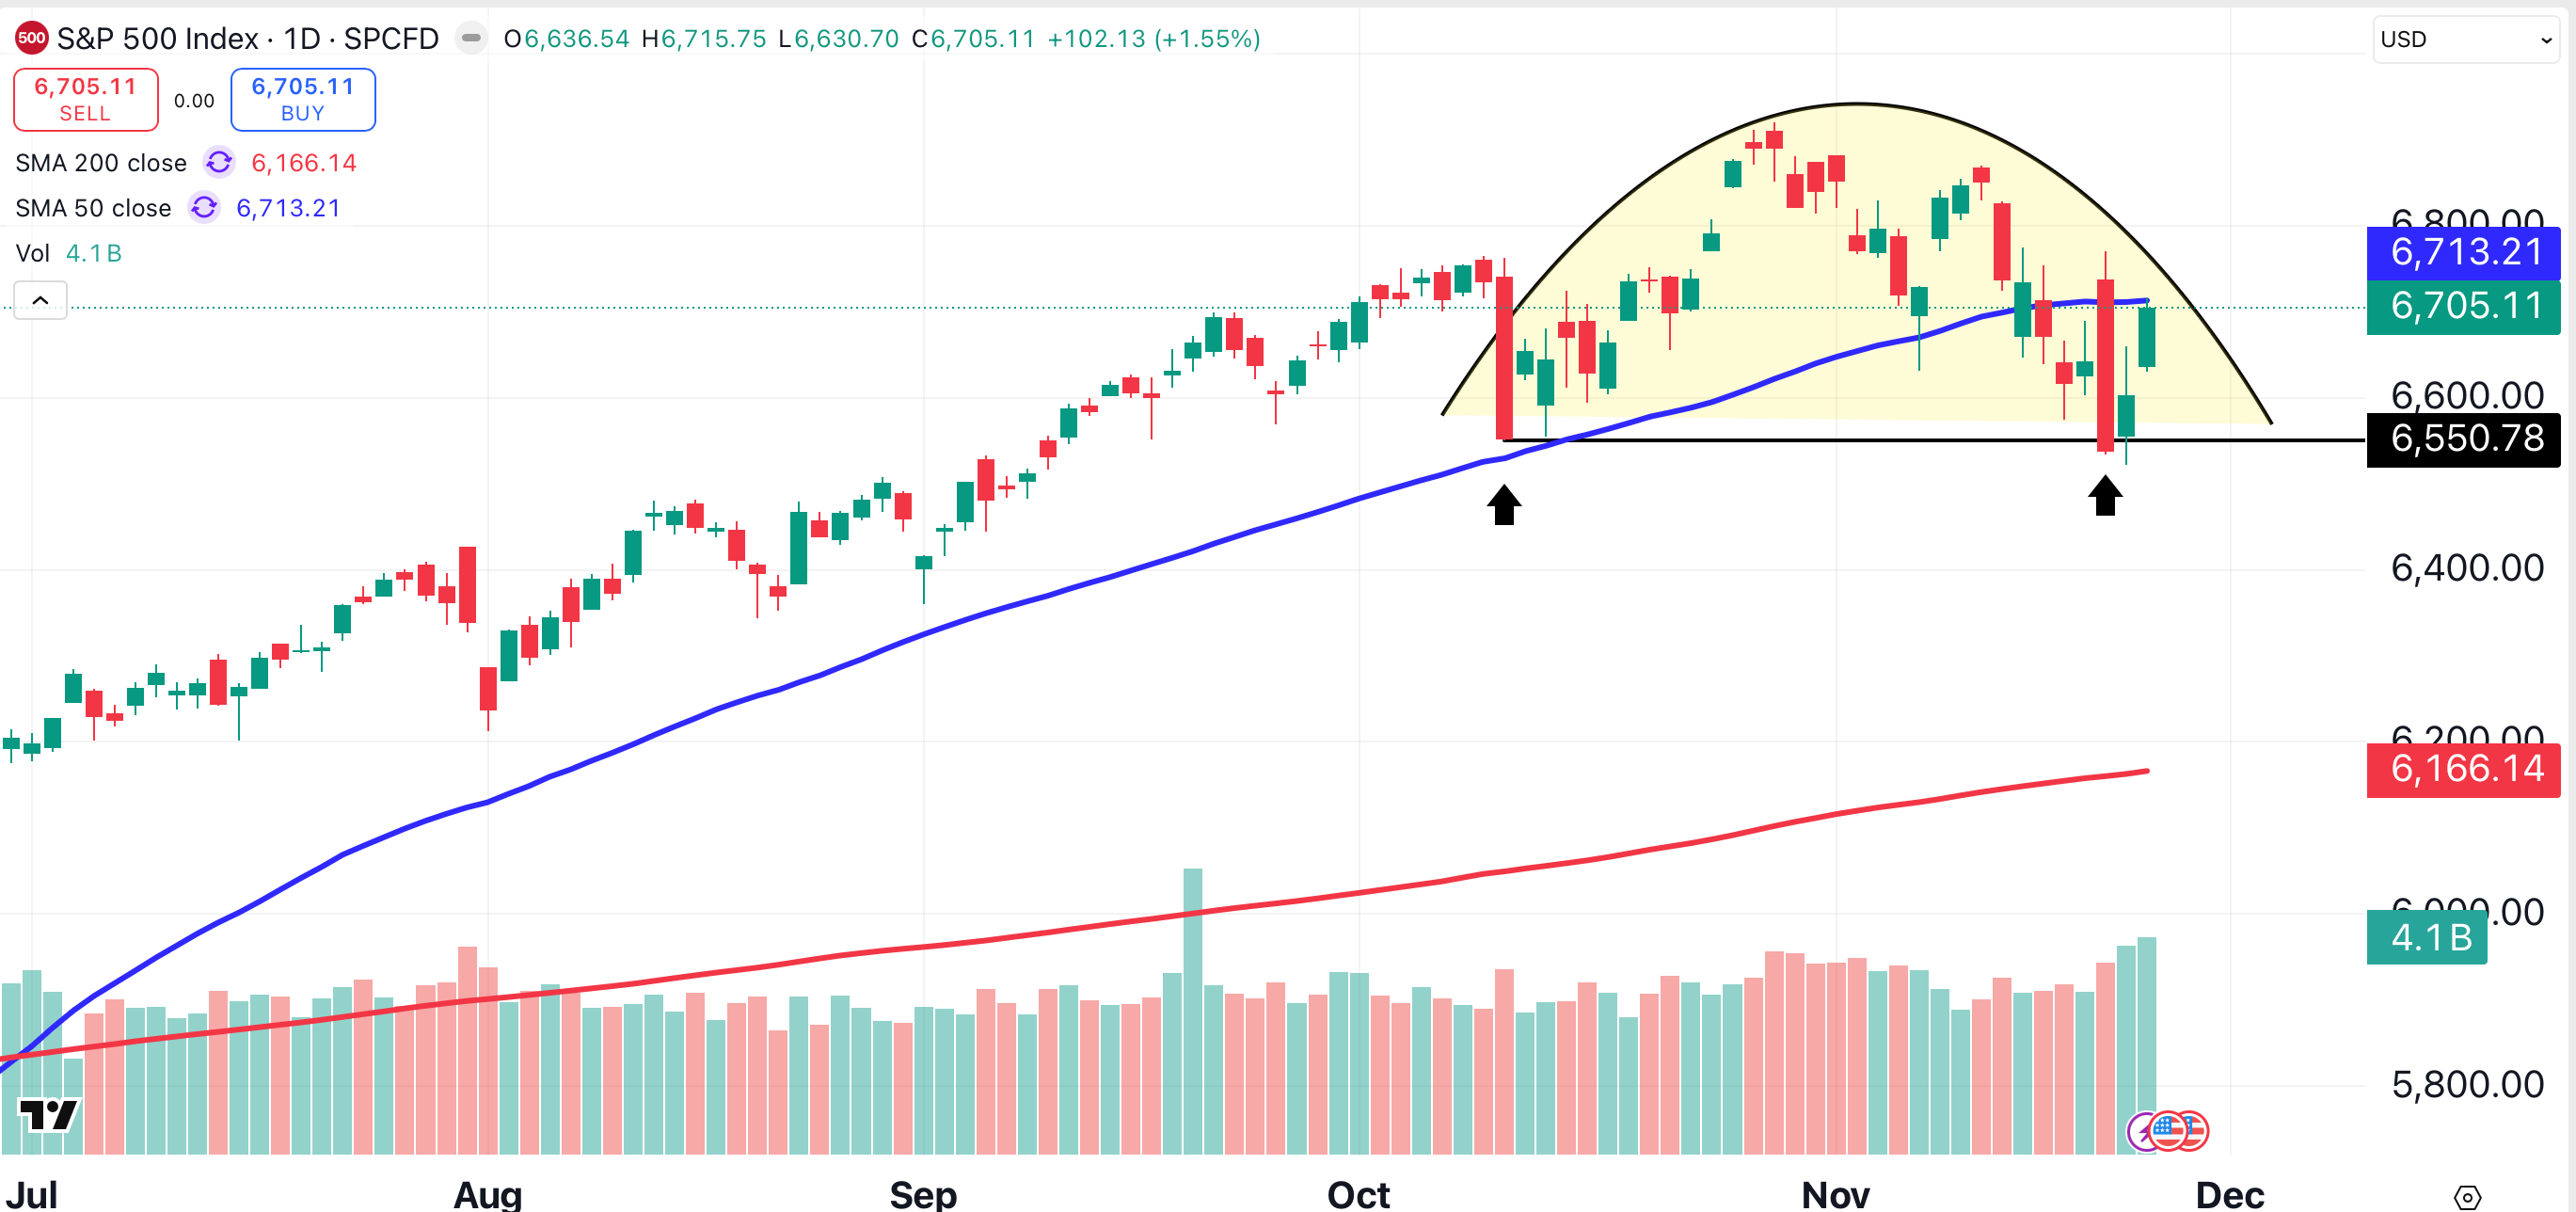
Despite the two-day rally, the S&P 500 remains just below its 50-day moving average (blue). The large-cap index has closed below that indicator for six consecutive sessions.
The Nasdaq Composite also closed just below its 50-day MA (blue), after holding support again just below 22,200 (black horizontal line).
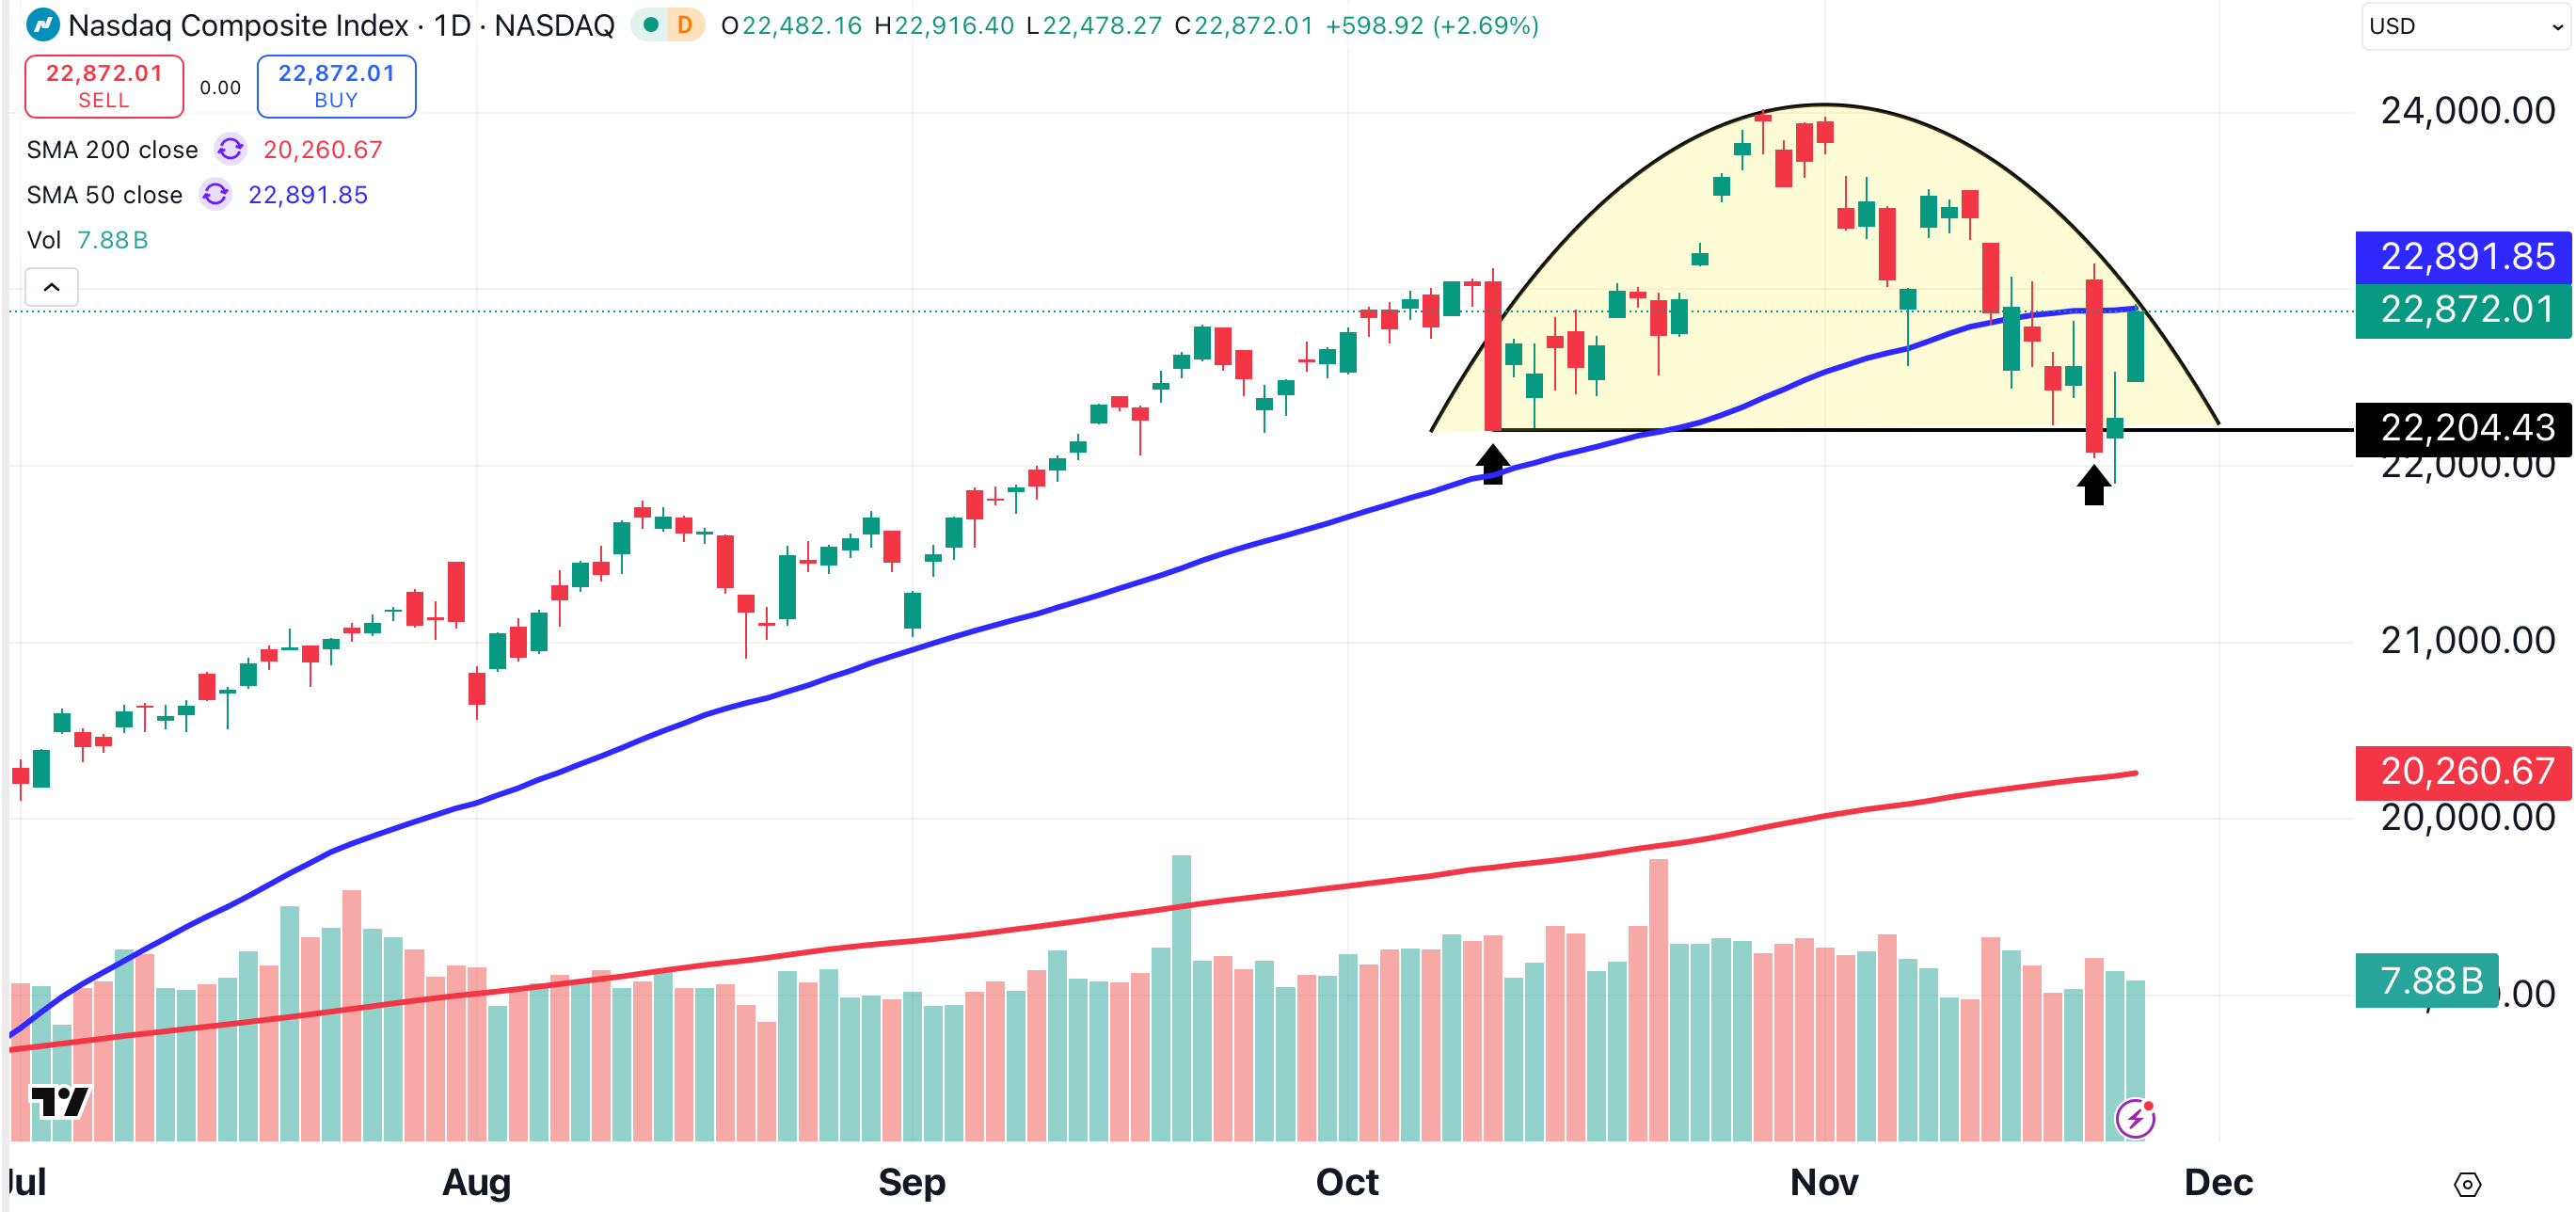
The bullish price action of the past two days hasn’t prevented the formation of a bearish pattern on both charts. Both the S&P 500 and the Nasdaq Composite could be forming rounded top patterns (shaded yellow).
While the overall market picture has improved, bulls are not out of the woods yet. For both indexes, a rally above the 50-day moving average would be constructive, while a decline below the indexes’ respective support levels (6550 and 22,200) would point to further losses.
Within these indexes, there is a tug-of-war unfolding. Two large-cap tech names are attempting to pull this market higher, while several big names continue to weigh it down.
Apple, Alphabet are Powering the Market
Apple (AAPL) , which reached an all-time closing high on Monday, has resumed its role as a market leader. Apple remains in a bullish channel (green diagonal lines), and trades well above its key 50-day (blue) and 200-day (red) moving averages.
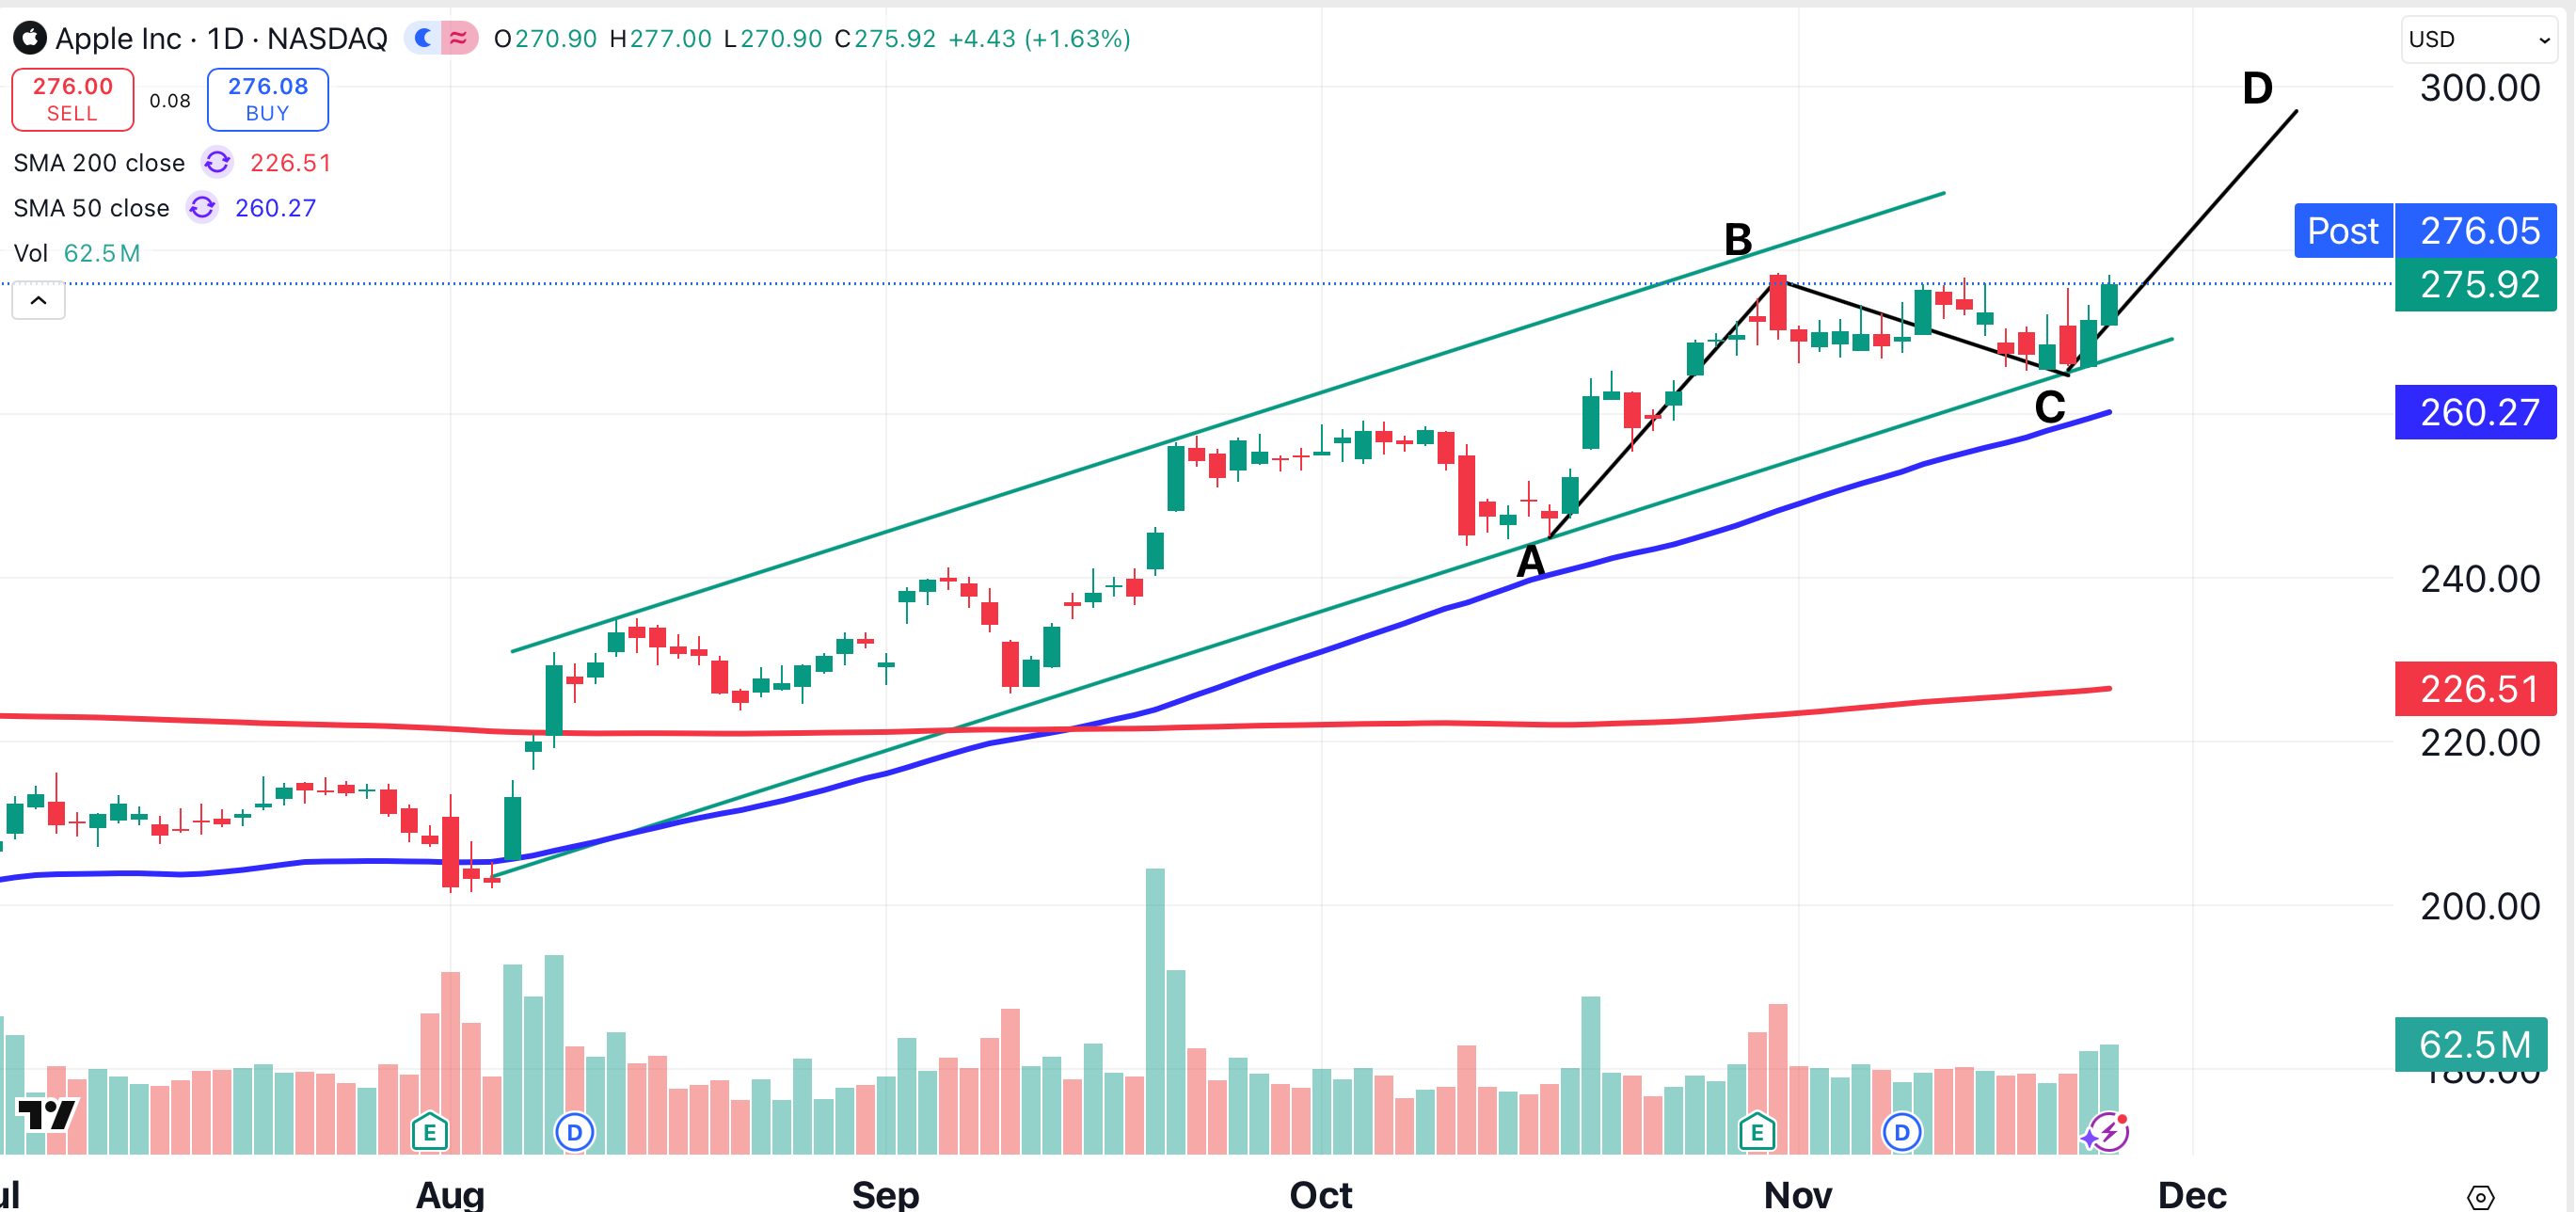
Within that channel, Apple has formed an A-B-C-D pattern (black lines). According to that pattern, Apple is headed to $300 per share.
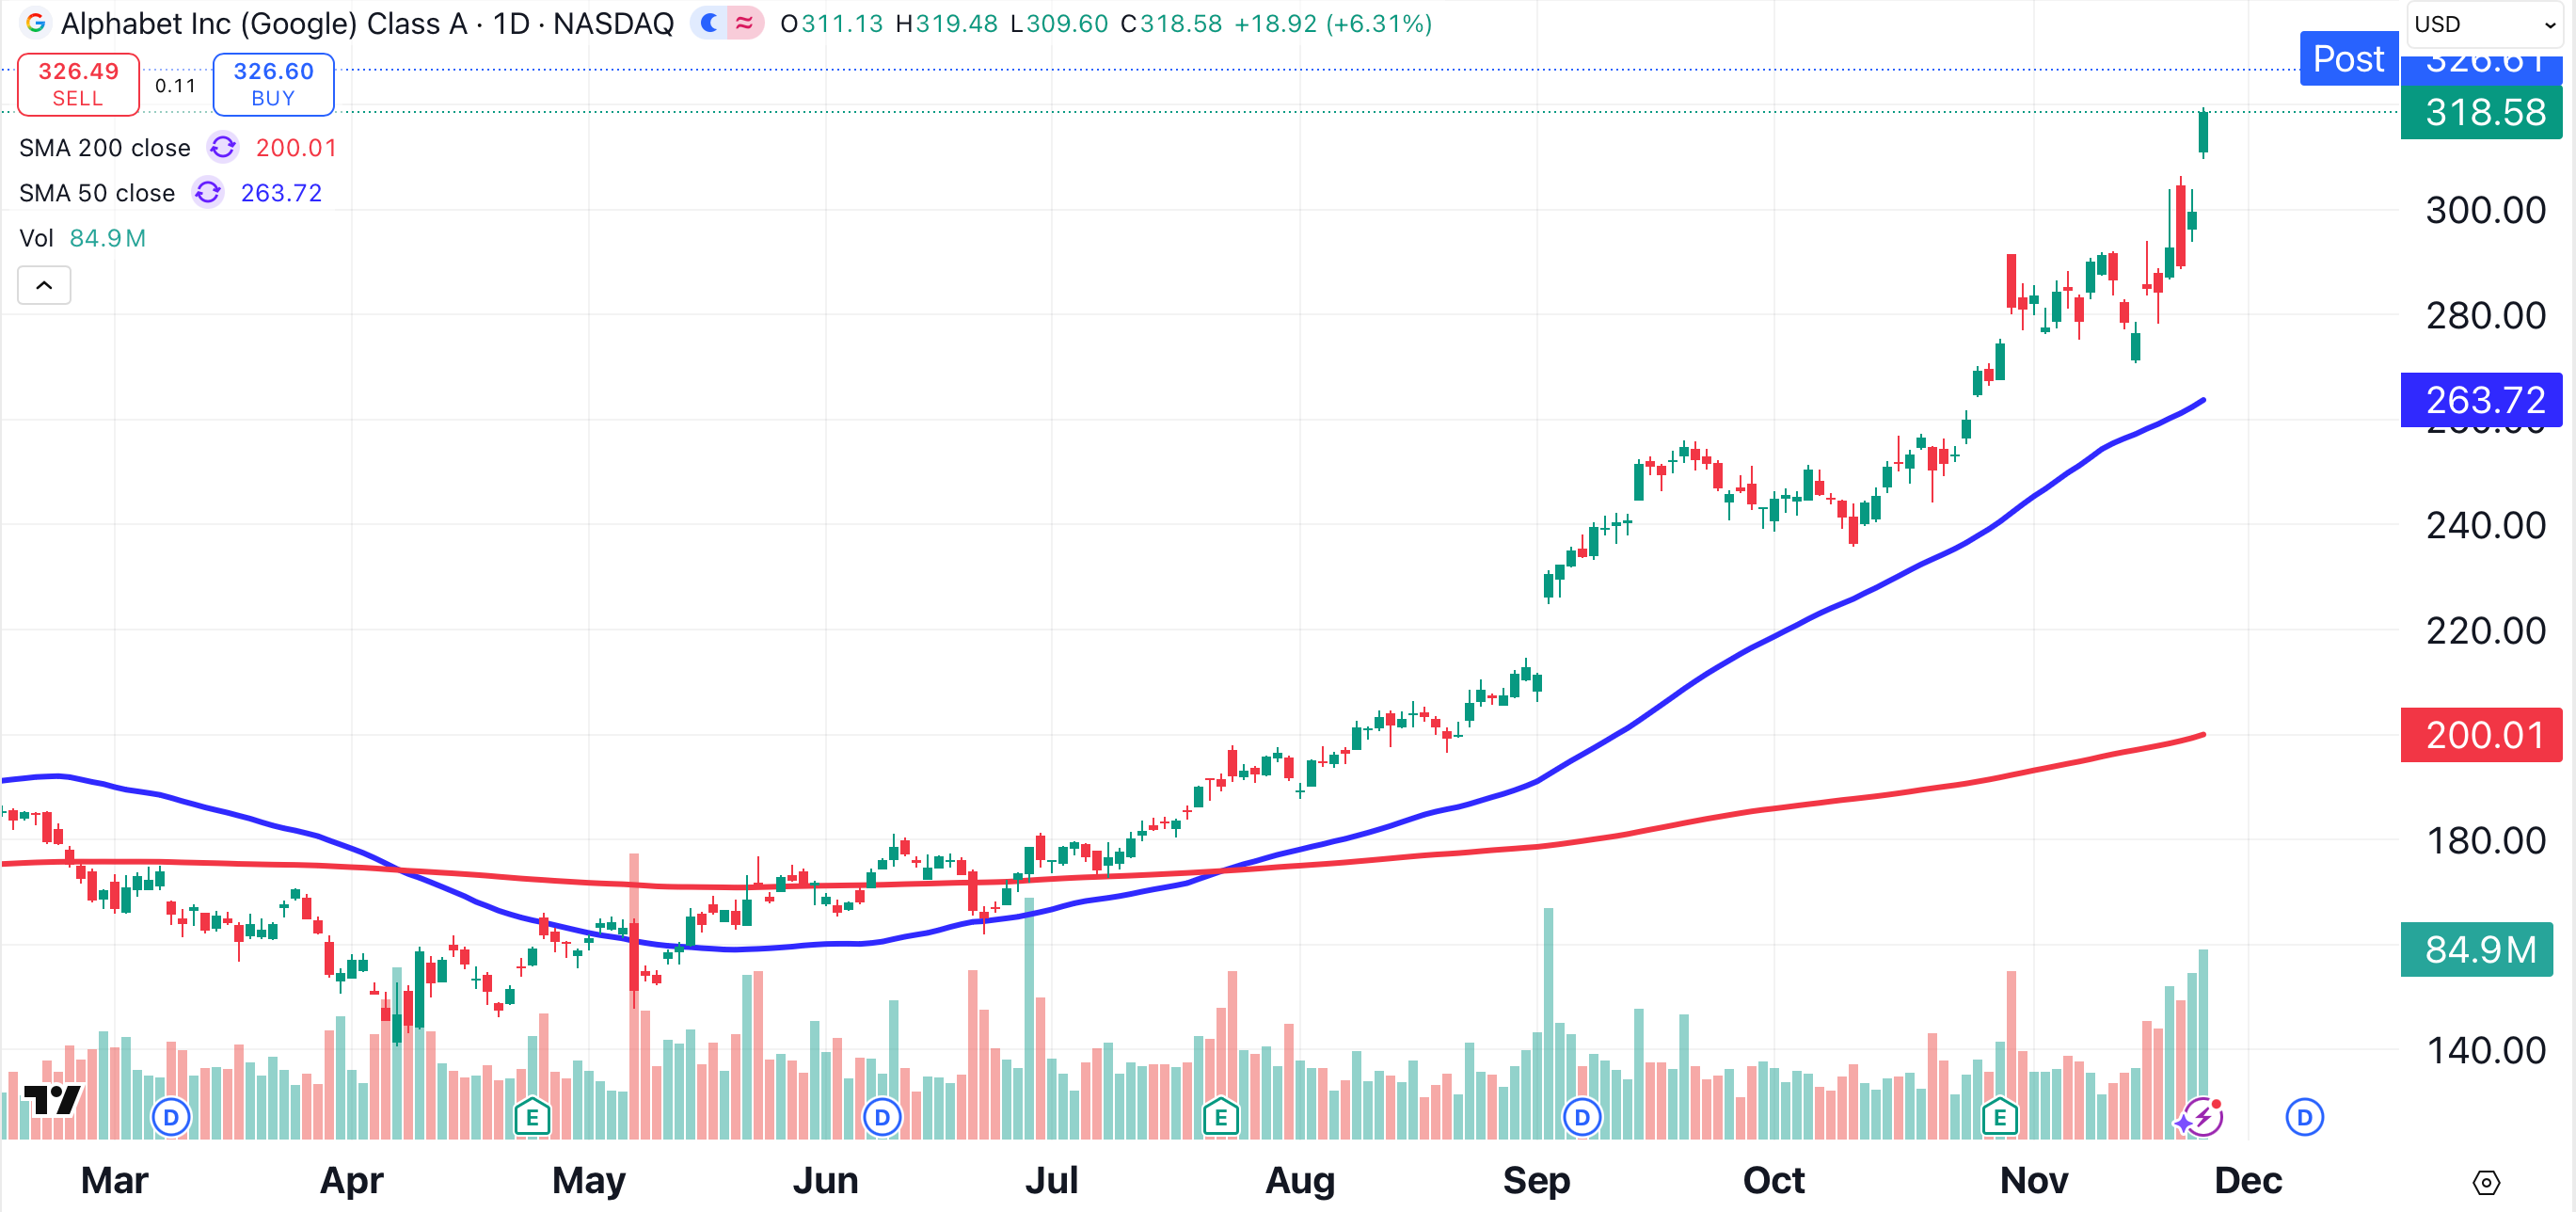
Alphabet (GOOG) , which also closed at an all-time high on Monday, is pulling the indexes higher. Alphabet has now gained 67% year-to-date.
Apple and Alphabet can’t do the job alone. Some of the most widely-held names aren’t pulling their weight right now.
Three Weak Mega-Caps
Meta Platforms (META) has finally found support (up arrow) in the $585 area. The parent company of Facebook, Instagram, and WhatsApp is trading well below its 50-day (blue) and 200-day moving averages, which appear headed for a bearish crossover (circled).
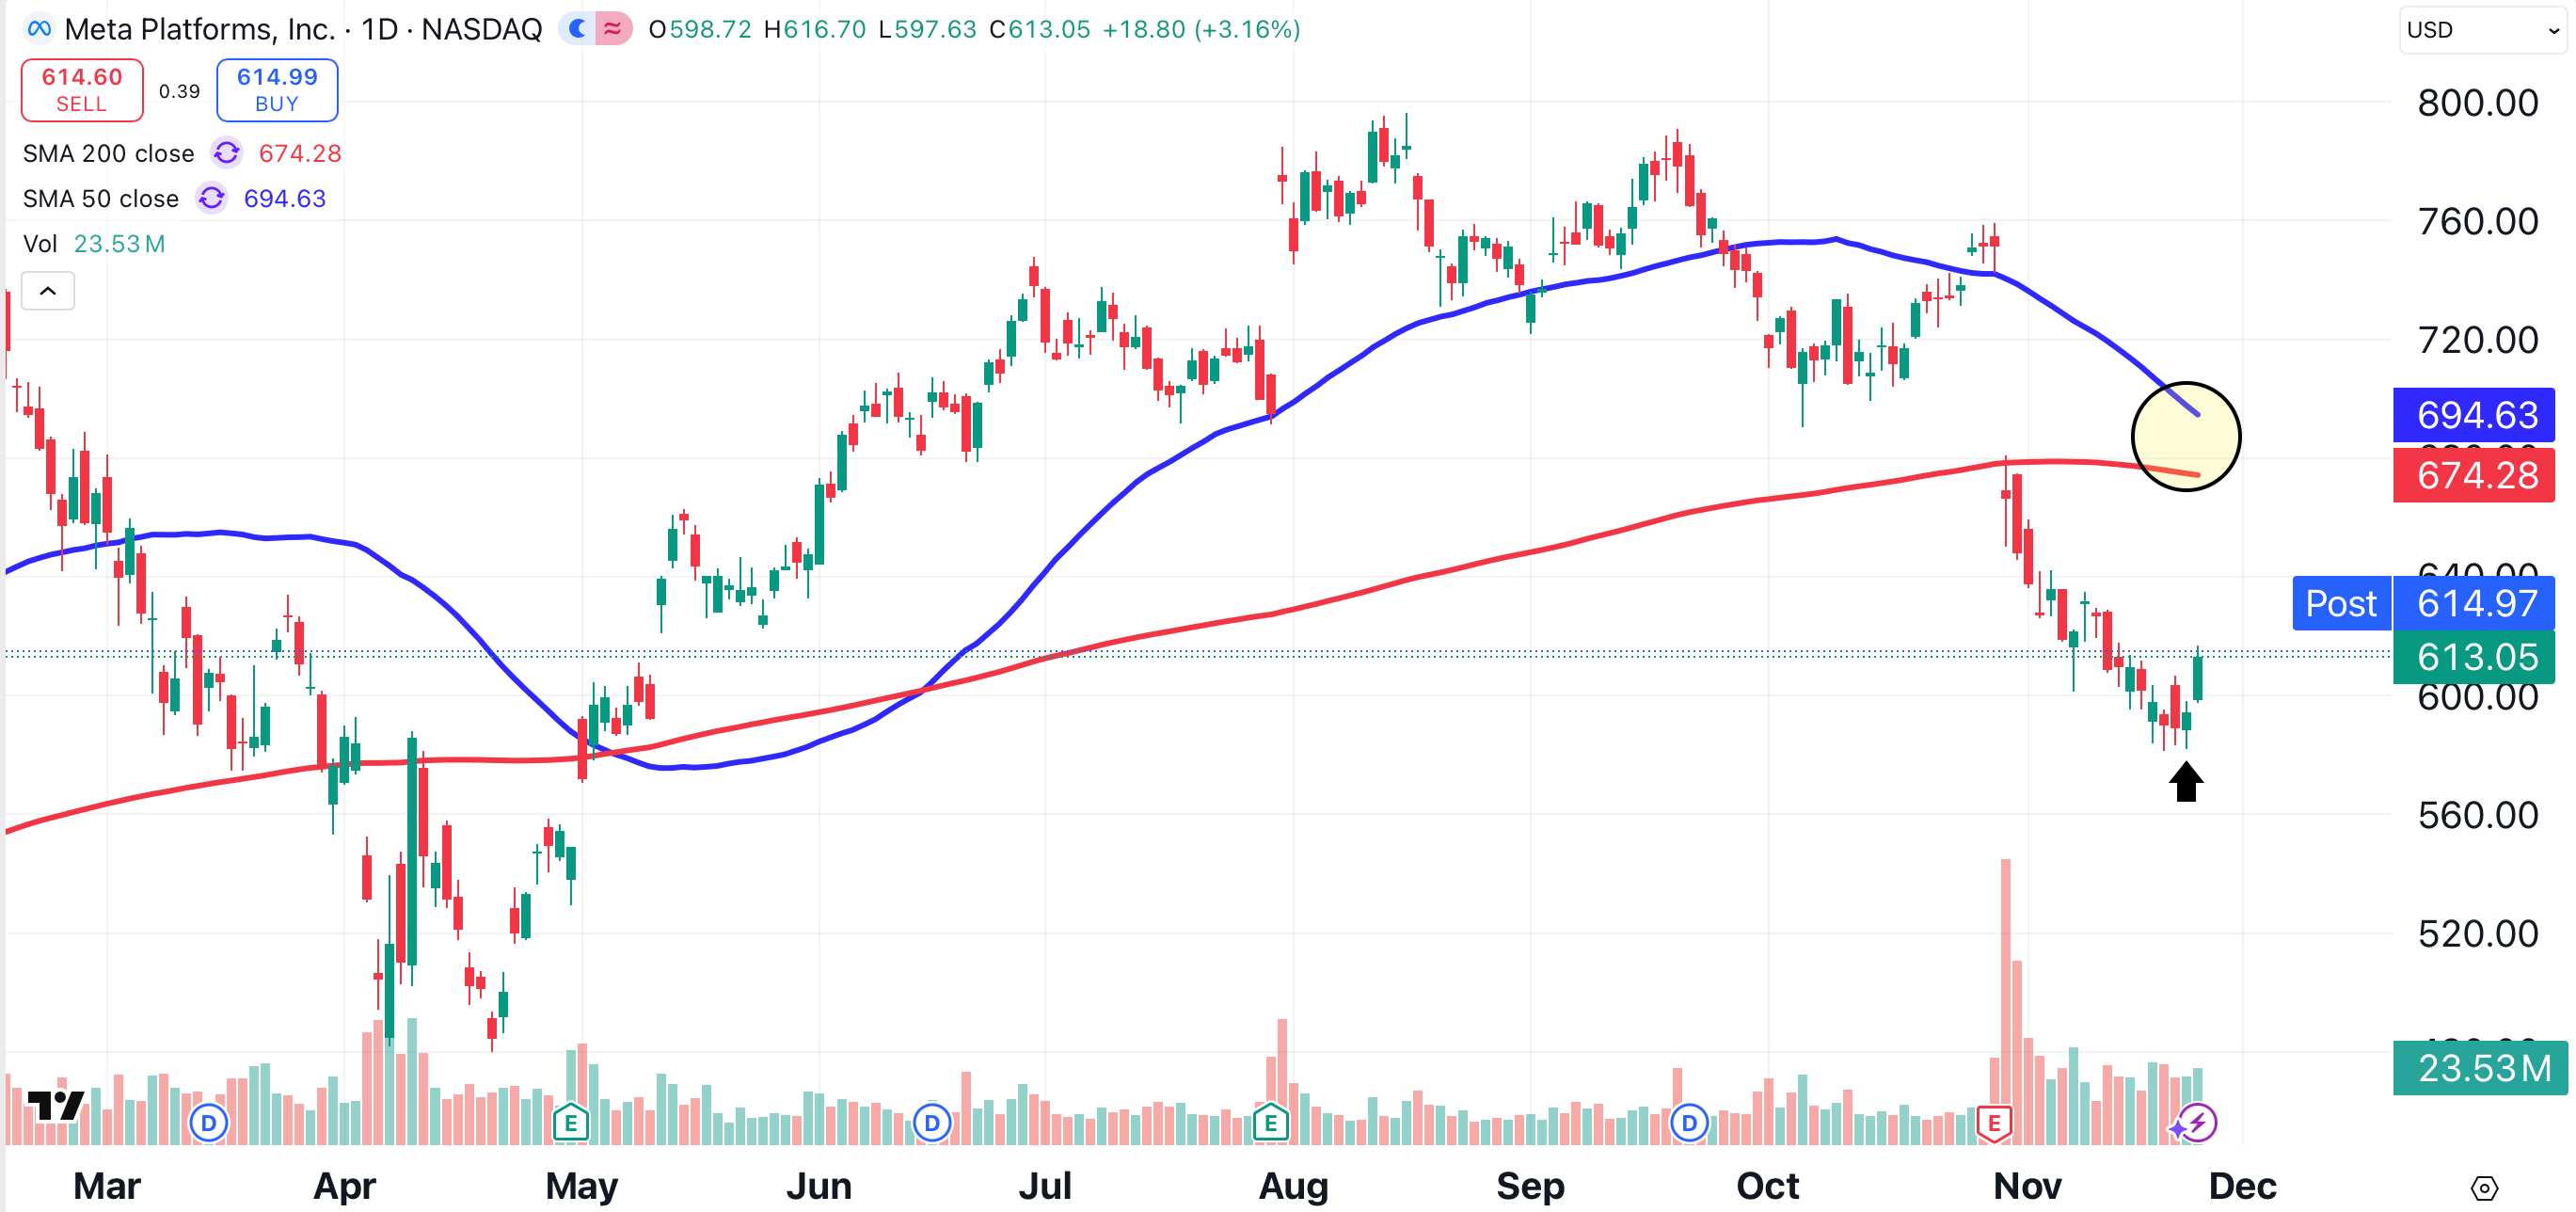
Shares of Meta Platforms have lost 17% over the past month.
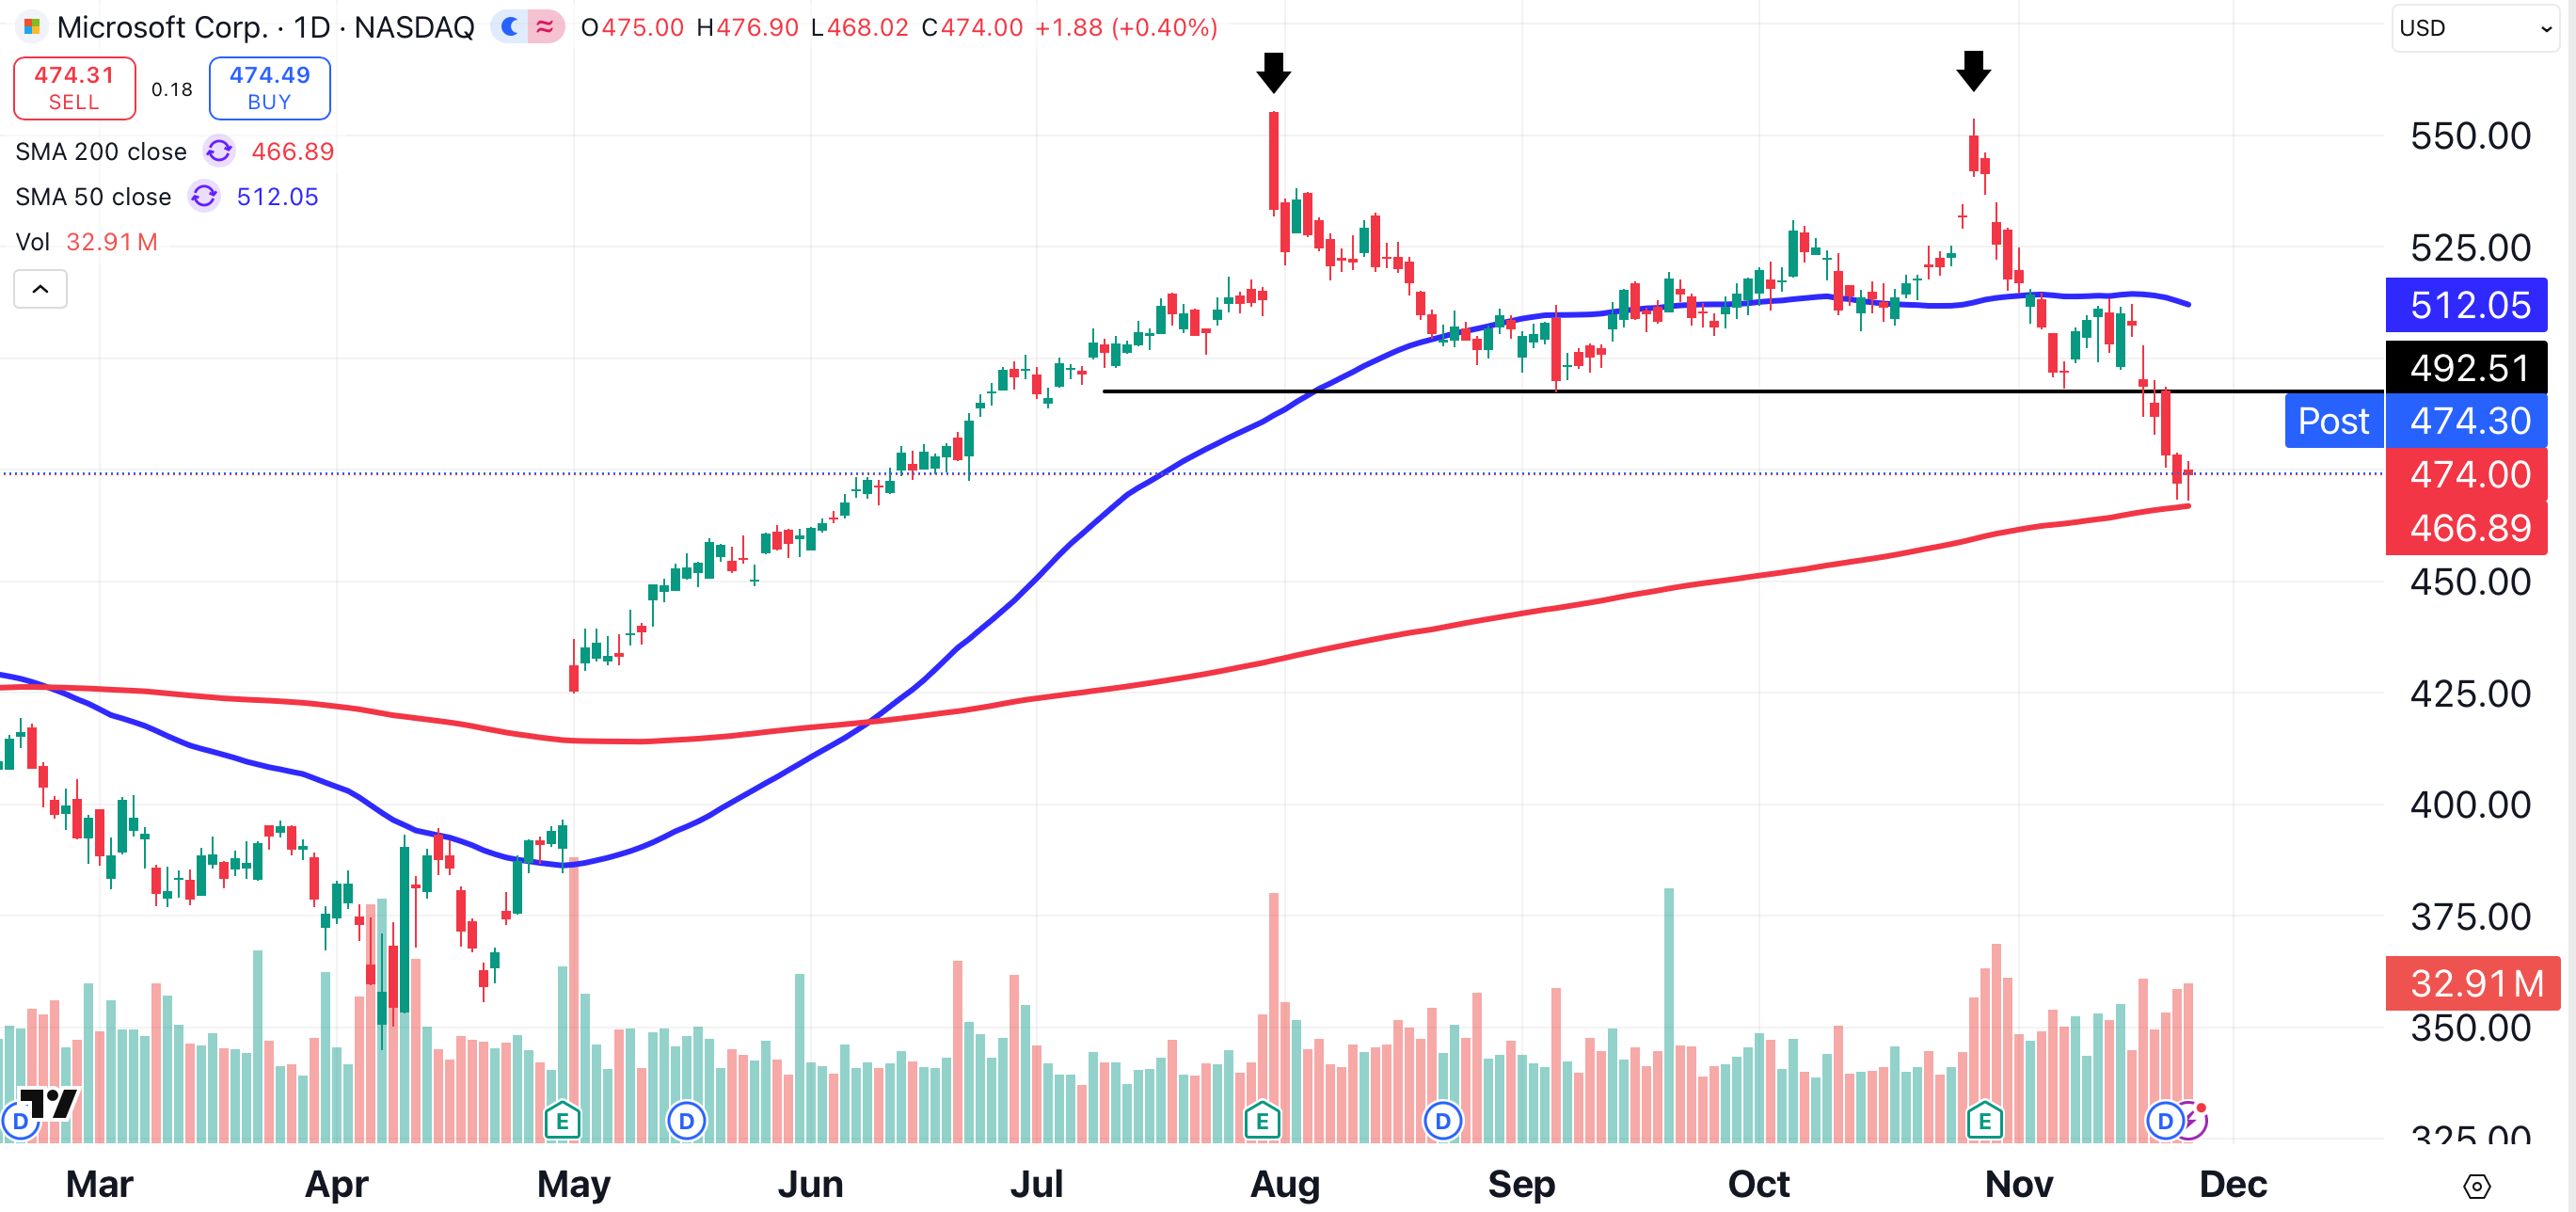
Microsoft (MSFT) continues to slide after forming a double top (arrows). The software giant is now testing its 200-day moving average (red). Microsoft failed to gain traction during the Friday-Monday stock rally.
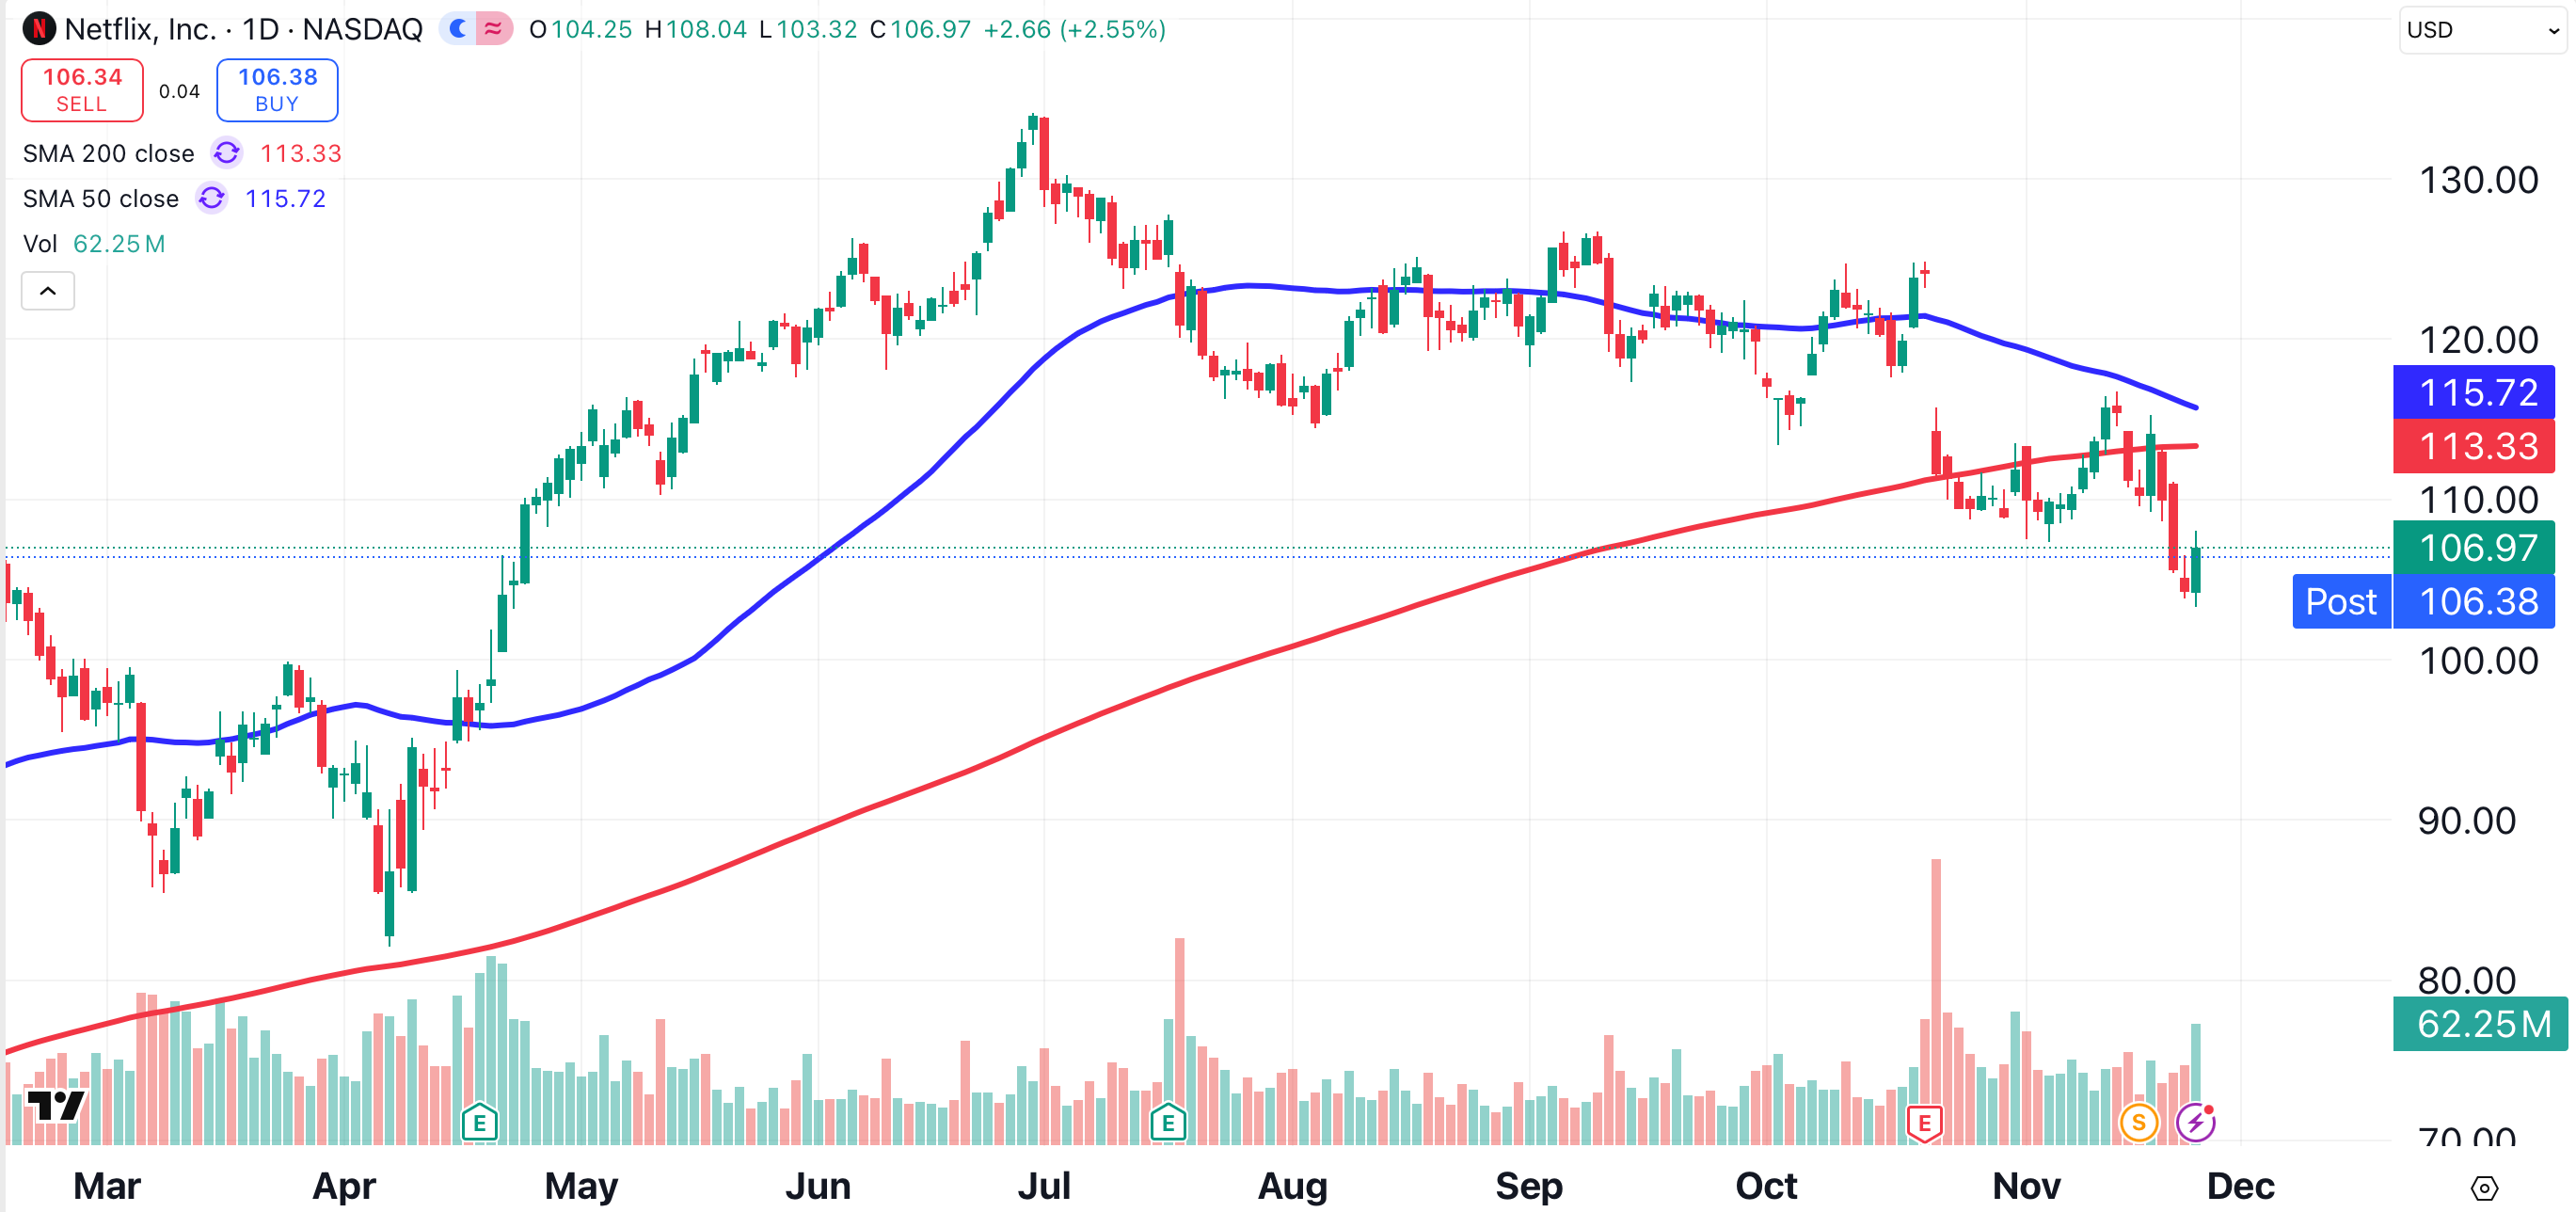
Netflix (NFLX) is experiencing a sustained move below its 200-day MA (red) for the first time in two years. On Friday, shares of the streaming giant closed at a six-month low.
Can Apple and Alphabet drag this market higher? Or will Meta, Microsoft, and Netflix continue to weigh it down? The S&P 500 and the Nasdaq Composite are weighted indexes, so these stocks will have an outsized influence on market direction.
At the time of publication, Ponsi was long AAPL.
