And the Chop Goes On
Wednesday was yet another day of indecision and chop.
You've reached your free article limit
You've read 0 of 1 free Pro articles.
The Market
If you feel as though today was a day of indecision and chop, it was.
Once again, breadth was not sour since it was flat as a pancake. The number of stocks making new lows did not increase for the day. For the third straight day, the put/call ratio was over .90, something we have not seen in quite some time. Is it extreme? Not at all, but it has certainly come off the boil. I consider that a plus.
Of the charts we have been watching, the only one that has broken is Microsoft, and at least for today, it is the only one that hasn’t been able to recapture 405. It seems to me we should give it another day or so to see if it can do so.
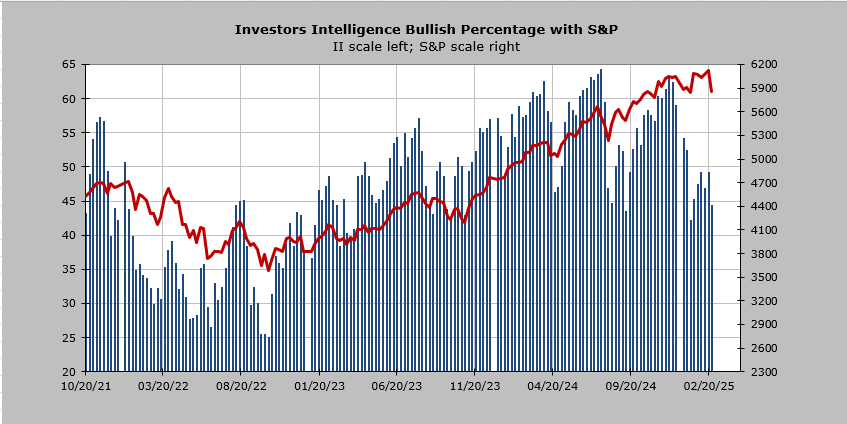
The Investors Intelligence bulls fell five points to 44.3%. They were lower in mid-January, but this, too, is a step in the right direction. I expect the AAII readings tomorrow will continue to show bearishness, but the S&P is down 200 points in a week since the last AAII report was released which is why I like to see AAII confirmed elsewhere. The Investors Intelligence readings are finally trying to catch up.
I would still like to see us rally for a day or so and come back down to a good short-term oversold condition.
New Ideas
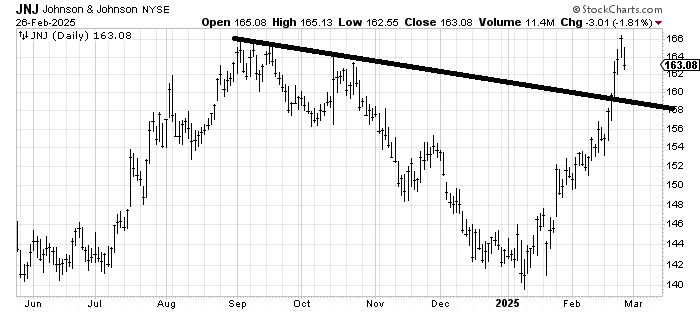
I was asked where to buy Johnson and Johnson JNJ back. The only spot I see right now is that line around 158. But the stock has run quite far quite fast. I would be showing some patience with it and the other staples and drugs right now.
Today’s Indicator
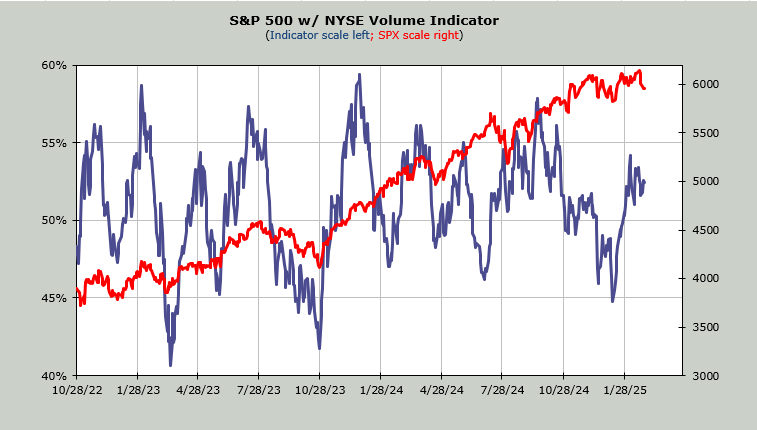
The Volume Indicator is still overbought.
Q&A/Reader’s Feedback
Helene welcomes your questions about Top Stocks and her charting strategy and techniques. Please send an email directly to Helene with your questions. However, please remember that TheStreet.com Top Stocks is not intended to provide personalized investment advice. Email Helene here.
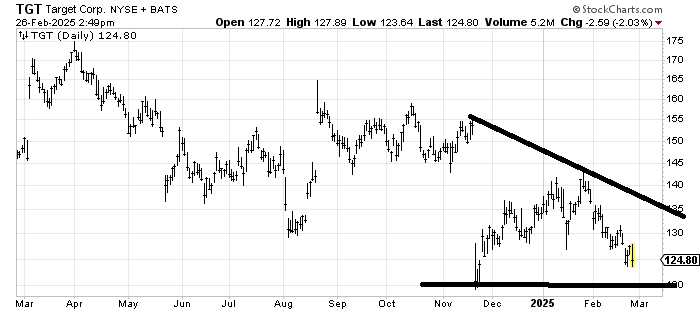
I look at the chart of Target TGT and wonder when the heck did it start trading like a small cap with all those gaps? Earnings are out early next week so I should start by saying I am generally not a fan of putting on a new position right before earnings. Should the stock come down to 120 and hold, it’s probably worth a shot, but mostly, it is a stock in a downtrend. A break of 120 gives a measured target close to 100-ish. I believe down there, I might find some merit in owning it.
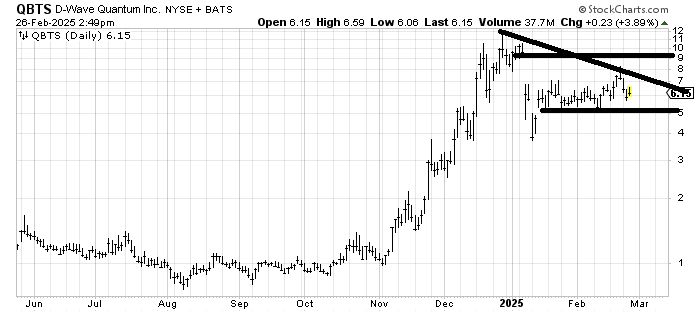
D-Wave Quantum QBTS strikes me as a chart in the middle of nowhere. It’s in a trading range between 5 and 9-10. The only good news I see is that the plunge to 4 in early January could be construed as an island. I’d get very concerned if it breaks 5.
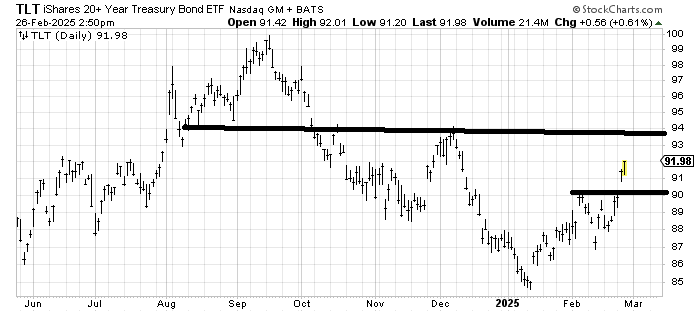
When we looked at the iShares 20+ Year Treasury ETF TLT earlier this week, I said it needed to get over 90 in a hurry. And so, it has. It measures to the 93 area. Resistance is at 94 and I think it is eventually getting there. Near term it is over-extended and vulnerable to a pullback. Pullbacks toward 89-90 will probably get bought unless sentiment gets too bullish on bonds. With the DSI at 42, that is not yet a problem