All it Takes is Some Short Covering to Get Stocks to Rally
Today was one of those days. What's next?
You've reached your free article limit
You've read 0 of 1 free Pro articles.
The Market
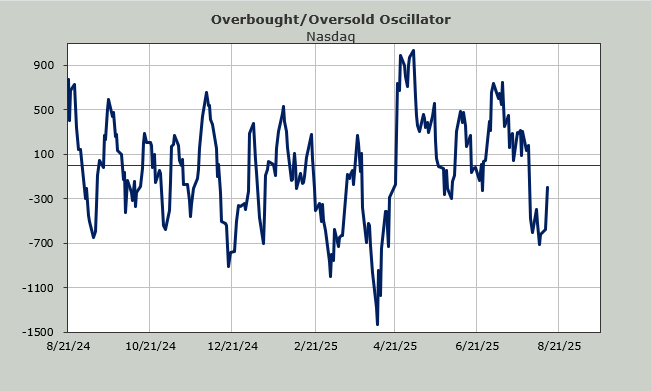
I think today was those negative numbers dropping off (oversold) at work. I also think the rally felt like short covering. Not all short covering rallies are bad. In fact, famed technician Bob Prechter once said ‘every rally begins with short covering’.
Why did it feel like short covering? Because almost all the stocks that have been down for the last six-plus weeks are the stocks that rallied. Like the Transports. Like small-caps. Like banks. Notice the drugs didn’t rally that much, but the biotechs rallied.
That table I showed you on Sunday, of the numbers we are dropping off the Overbought/Oversold Oscillator, is red through Friday. After that, there are still red numbers to drop, but they are much more moderate numbers. For example, tomorrow the Nasdaq advance/decline number we drop is -1615, but next Wednesday that number is -168.
This doesn’t mean the market will rally from now until then. It just means it has the chance to move up.
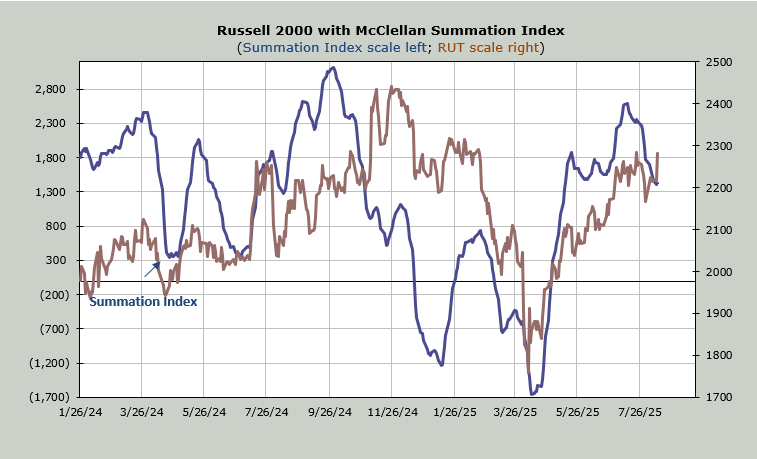
None of the indicators changed except the McClellan Summation Index stopped going down. Now it needs another good day of breadth to get it to turn back up. The chart is below.
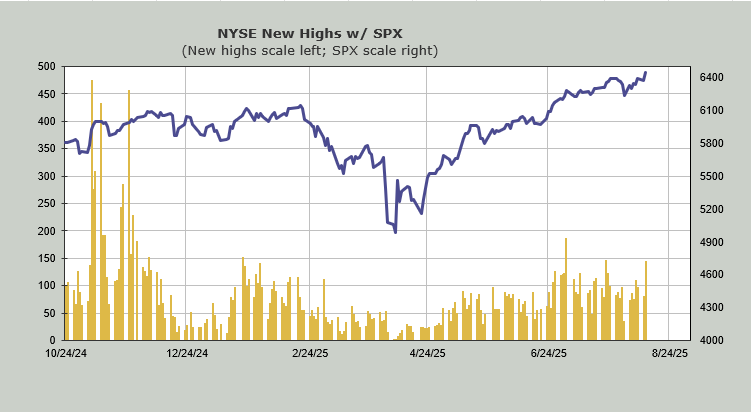
The number of stocks making new highs improved but it remains a smidge under the peak readings for this rally. And still well below the rally from earlier in the year.
Considering the small caps were up so much I must report that the upside volume once again failed to get over 80% for both Nasdaq and the NYSE. I should also report that the DSI for the VIX is back to 17 which makes the runway short because if that falls under 15 at the same time we run out of big red numbers to drop we probably won’t see the rally run much longer than that.
New Ideas
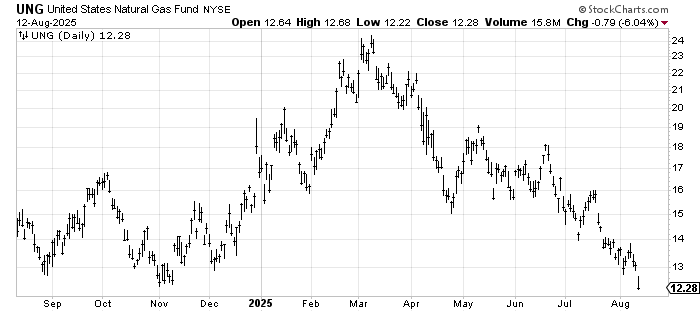
I am going to start with UNG, an ETF to be long natural gas, because the DSI is 20. The chart is hideous and actually measures to 8-ish. But if that DSI gets under 15, this will be worth it for a trade to the upside.
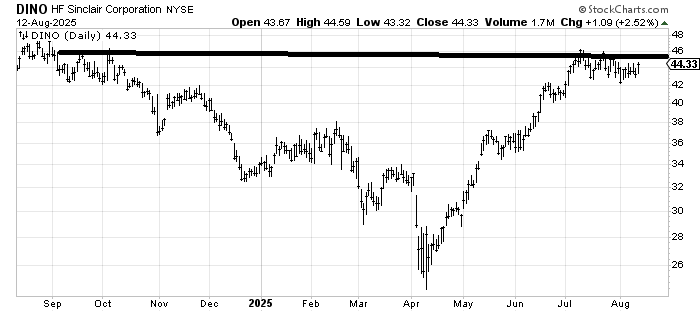
HF Sinclair DINO which has one of the best ticker symbols has been digesting its rally nicely. I think I am a little early but as long as it doesn’t break 42 this has my interest.
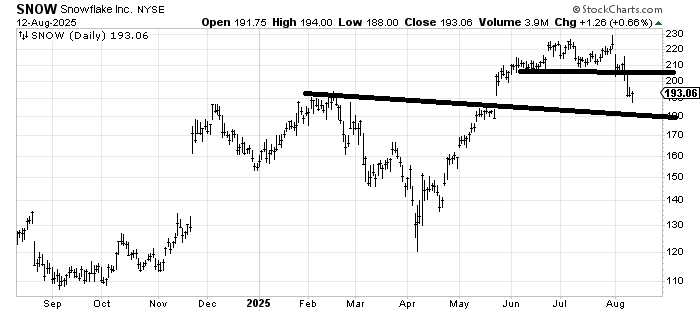
Finally, I promised to follow up on Snowflake SNOW. It hasn’t been as awful as so many other software names but it’s not been great. The little top it broke down from measures into the 185-190 area and it got to 188 today. It may still fill that gap but the stock is getting oversold and is near support. Just for a trade.
Today’s Indicator
The McClellan Summation Index is discussed above.
Q&A/Reader’s Feedback
Helene welcomes your questions about Top Stocks and her charting strategy and techniques. Please send an email directly to Helene with your questions. However, please remember that TheStreet.com Top Stocks is not intended to provide personalized investment advice. Email Helene here.
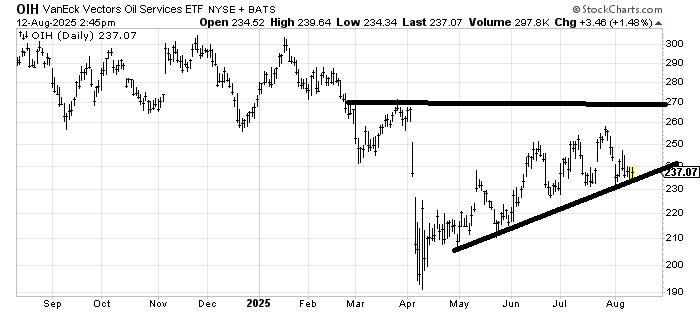
We finally got the rally to fill that April gap in OIH. I was hopeful it would pullback and rally again but so far it hasn’t. If it breaks 230 I will give up on that idea. That is my line in the sand, something under 230.
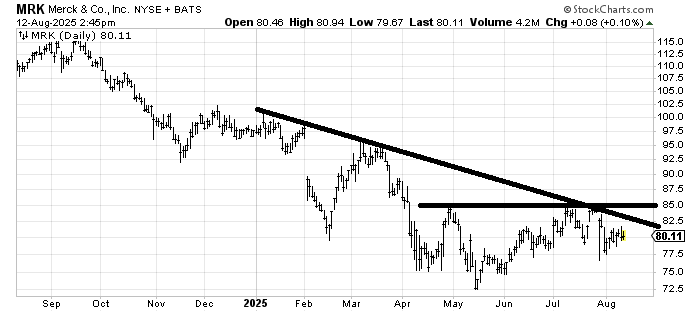
I have been of the mind that Merck MRK was trying to build a small base. It’s still too small to fuss over. But as long as it doesn’t take out that May low it should be considered base building. If it can get over 85 it would be one more step toward base building.
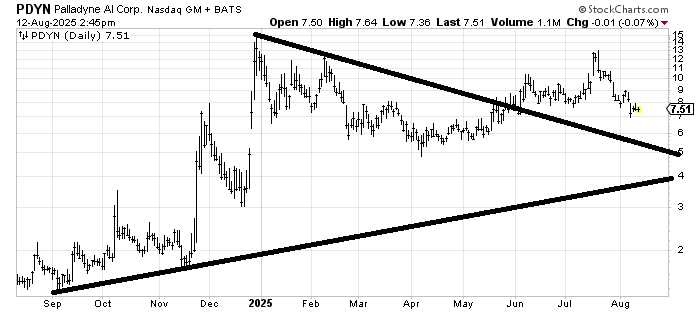
Palladyne AI (PDYN) has good support back in that 5-ish area. Notice how before the runup in early June it had scooped or rounded under. Then before the July run up it also rounded under. If it is going to make another run, my guess is it will need to form that type of pattern again.
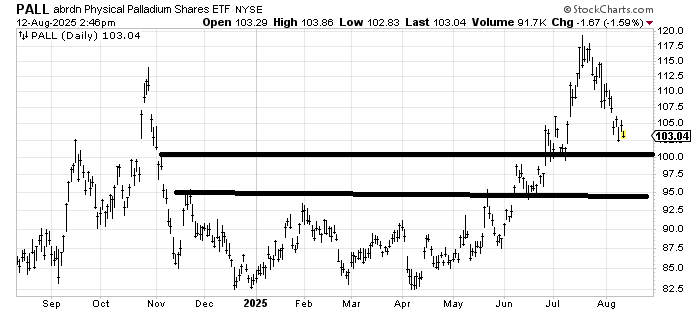
PALL, an etf to be long Palladium, is enjoying a much needed correction. I would look for some stabilizing again in that 95-100 area, hopefully it will then round under and get interesting again.