After Six Up Days, Here's What to Watch This Week
Let's run down the list of indicators and see what they're telling us.
You've reached your free article limit
You've read 0 of 1 free Pro articles.
The Market
Come on, surely the indicators changed after today. Surely, they did not. But we’ll check in on the now memorized list anyway.
First of all, I’m sure that you realize that with the exception of the Dow and the S&P, most indexes have spent the last week going sideways. In fact, the S&P has now been green six straight days, and my rule of thumb is the longer we go on a streak, the more likely it is to go the other way. Maybe the S&P will carry on until the end of the week without a down day, but I doubt it will.
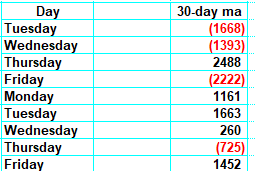
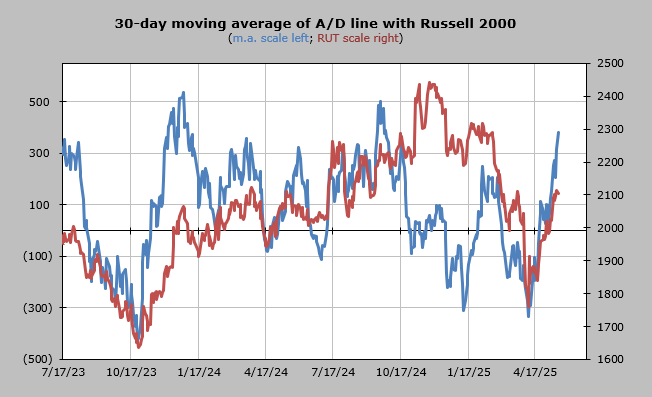
But let’s talk about breadth. Quite frankly, it could have been a lot worse today than it was with net breadth at -325 on the NYSE and volume basically flat. Down below, you will see the chart of the 30-day moving average of breadth (the advance/decline line) is heading into that overbought condition I’ve been highlighting, the one I think arrives at the end of this week.
The rule of thumb is that when we stop dropping big red numbers and start dropping big black (or green) numbers, we are overbought. You can see that Friday is the last of the big red numbers to be dropped. Remember, the exact day is not what matters; it’s the general time frame, and we are getting into that general time frame.
That is why I am focused on the indicators, and I want to see if there is a change. For example, the McClellan Summation Index is still heading higher (bullish). It will now take a net differential of -1700 advancers minus decliners on the NYSE to halt the rise. I consider this number a decent cushion, meaning we can have a few down days and the indicator ought to hang tough. Once this number gets under -1000, it gets harder to call it a decent cushion because one harsh down day can change the indicator. So we’ll watch this one all week.
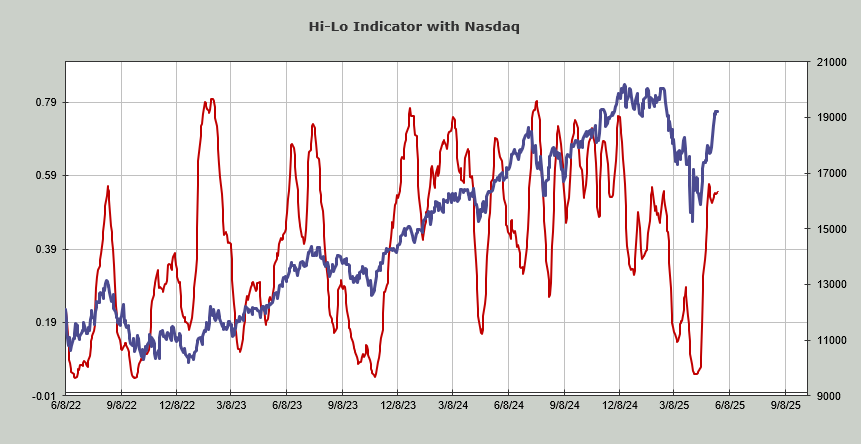
The NYSE Hi-Lo is still creeping upward, while Nasdaq’s is also creeping upward but still hasn’t made a higher high. That’s what we’ll watch into the end of the week.
I would add one final note in that today’s volume was what I would call bearish. The NYSE traded 4.1 billion shares, which is the lowest volume in weeks. That means there was no panic selling at all, but it also means the buying wasn’t terribly aggressive. On its own, I wouldn’t fuss. But Nasdaq had record volume of 13.2 billion shares, three billion of which was in penny stocks. I can live with the penny stock speculation if it is happening while other stocks are rallying. I cannot live with it when they are the only game in town.
So those are the things to watch as we head into the end of the week.
New Ideas
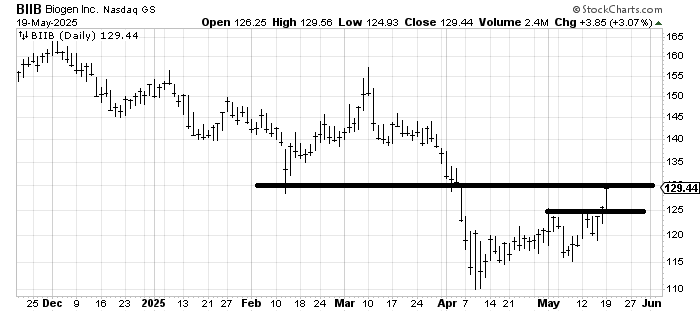
We finally got the move to resistance in Biogen BIIB–you see? Drugs are doing well in the last few days!—I would be inclined to take a little off here, and I would use a stop under 125 for the remainder.
Today’s Indicator
The 30-day moving average of the advance/decline line is discussed above.
Q&A/Reader’s Feedback
Helene welcomes your questions about Top Stocks and her charting strategy and techniques. Please send an email directly to Helene with your questions. However, please remember that TheStreet.com Top Stocks is not intended to provide personalized investment advice. Email Helene here.
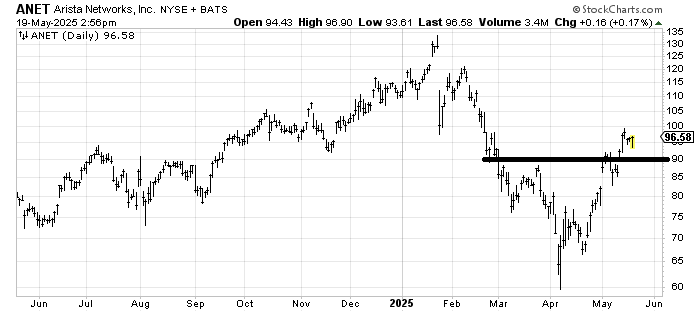
Arista Networks ANET has two things going for it. The first is that it has been correcting for a week now. The second is that it is over 90, and 90% of the stocks that make it to 90 will make it to 100, which it already did last Monday. What it doesn’t have going for it is that there is resistance all the way up. So I’ll say the stock is okay as long as it stays over 90. What it does in the next few days is a coin toss to me.
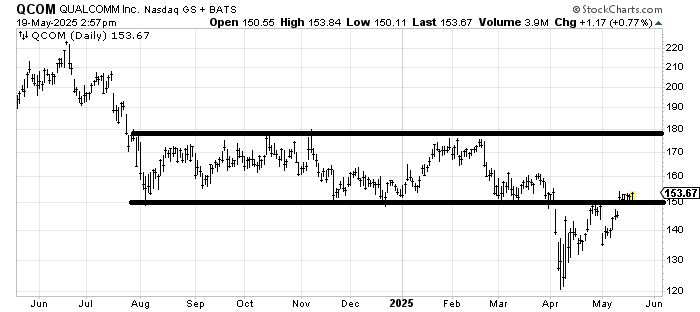
I should probably start the review of Qualcomm QCOM by noting that late last year, I liked the stock because it hadn’t broken down and looked to be basing. It rallied and then just collapsed. That means this entire area between 150 and 180 is resistance. On a short-term basis, I don’t want to see it head back under 150. Maybe it fills that gap below (145), but a strong stock should not cross back under support once it has inched over it.
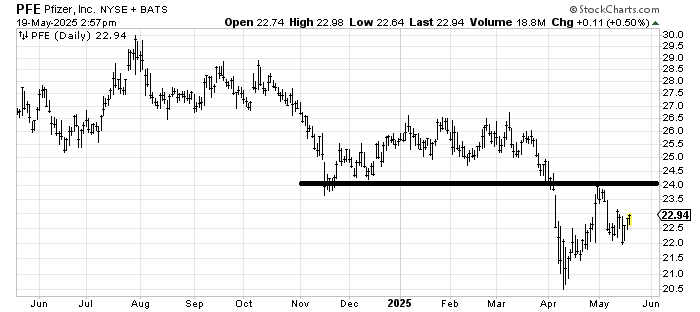
All it took was for me to say something nice about the drugs, and the Pfizer PFE chart comes up. I think it can rally to 24, maybe even higher. But the stock has not made a higher high in almost a year, so I’m going to start with 24 and see if it can get over that.