After Seven Up Days, Are the Transports Ready to Make a Turn?
Let's look at some key market indicators to see what's next for stocks.
You've reached your free article limit
You've read 0 of 1 free Pro articles.
The Market
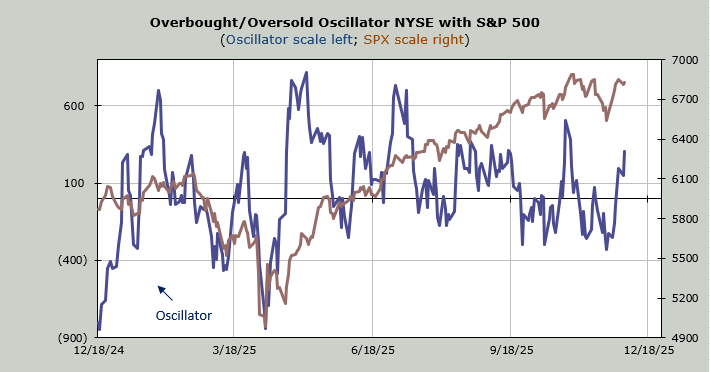
Well, I guess that lethargy will have to pass for a rally. Maybe we’ll get another rally in the next day or so to push us into short-term overbought territory.
I am still eyeing the end of this week as the point in time that my own Overbought/Oversold Oscillator reaches an overbought condition. I wouldn’t even be surprised if Wednesday is down and Thursday is up because that’s pretty much a chop situation.
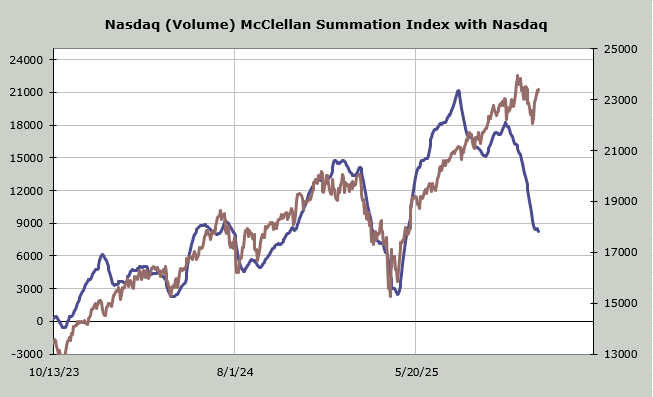
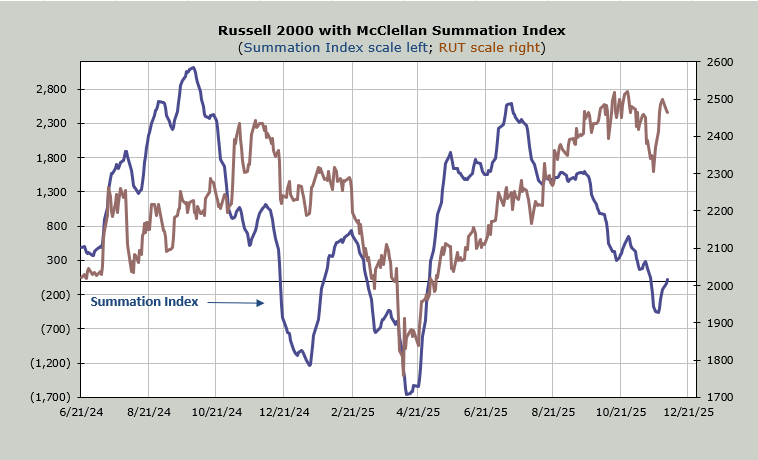
Even though breadth was negative today, it wasn’t as awful as it could have been. More importantly, it wasn’t enough to halt the rise in the McClellan Summation Index. Not yet. The cushion there is still fairly decent, with a net negative of -1100 advancers minus decliners on the NYSE, halting the rise. The chart is below.
I would, however, note that the Summation Index for Nasdaq has not turned up despite the rally last week. As a reminder, I use volume here (up minus down) as the input, and it would still require a net volume of +3.1 billion shares to halt the decline. It has been trending lower since last summer.
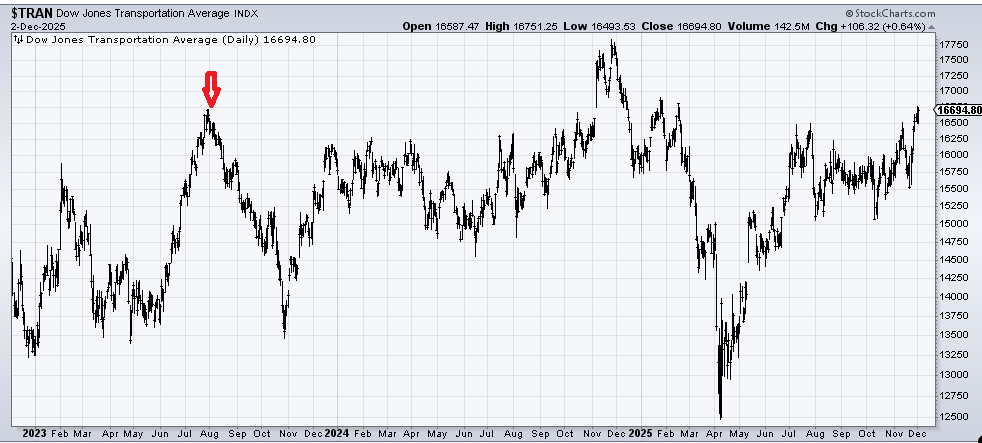
Let me finish by noting that the Transports, which I have been bullish on, have just completed seven straight days of green. That is the longest streak since early July 2023. I think they are due for a pullback, and the chart today looks vastly different than it did in July 2023, but I feel compelled to show you what happened after that seven-day streak was done. Use stops.
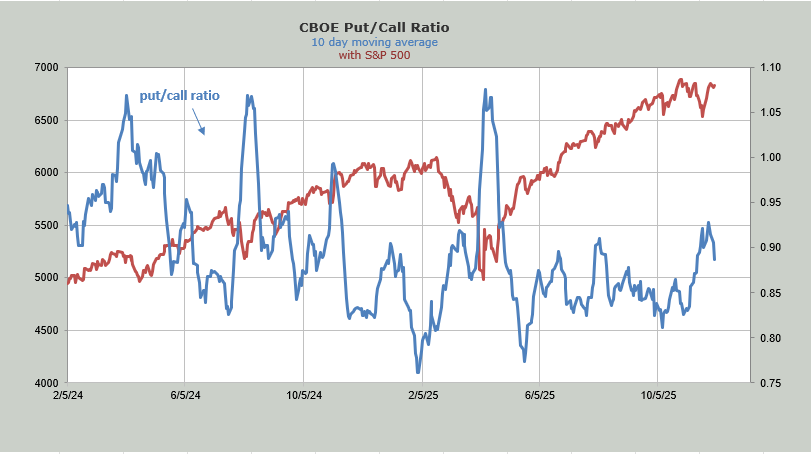
Finally, there is sentiment. The put/call ratio did fall to .70 on Friday, so Monday’s pullback was to be expected. Monday’s reading was back up to .95, but today’s was back down to .78. The end result is that the ten-day moving average is heading back down quickly; it is already under .90.
New Ideas
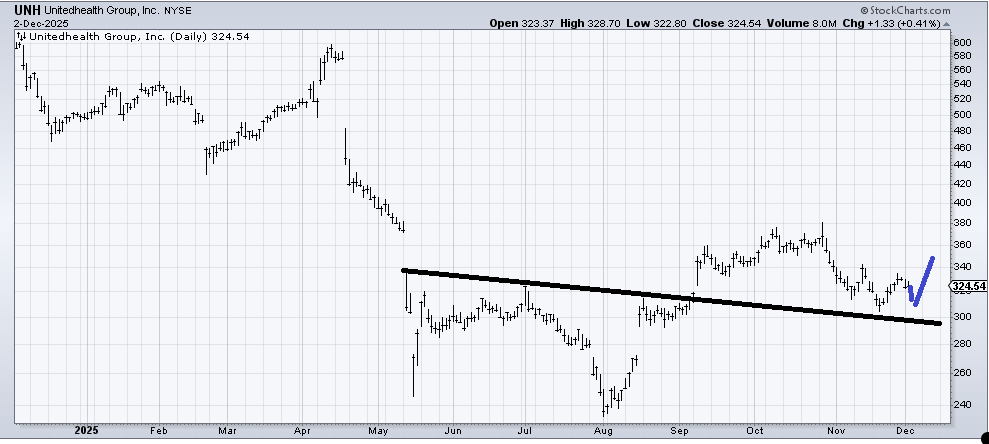
United Healthcare (UNH) filled that gap at 380 and has mostly been heading lower ever since. I have my eyes on it now as it has been sloshing around support. If it can turn up from this 320 area and get over 340, it would look much better.
Today’s Indicator
The McClellan Summation Index is discussed in full above.
Q&A/Reader’s Feedback
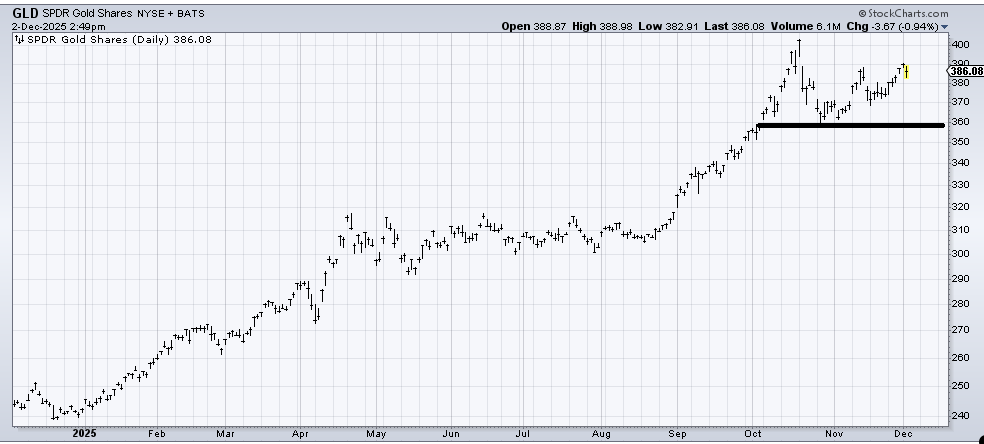
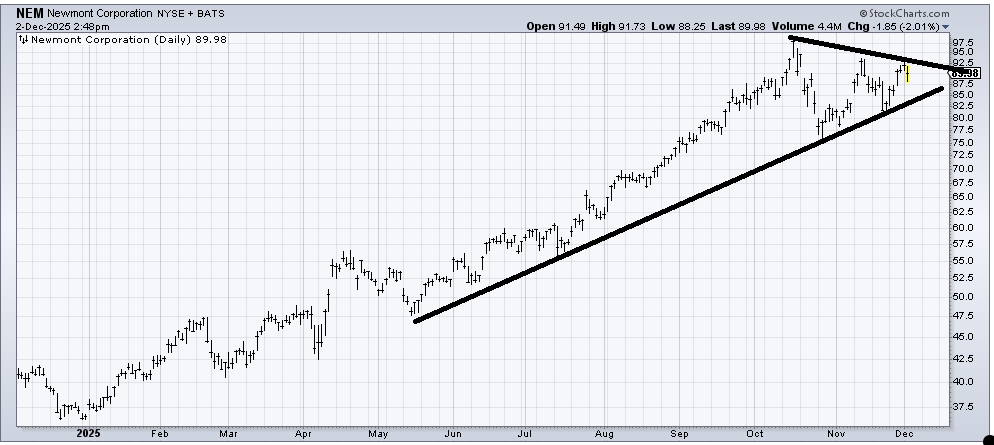
I view the chart of Newmont (NEM) much the same way I view (GLD) . There was a speculative peak in October, but I am undecided if it was a major peak or something more akin to what we saw in April. My leaning is to what we saw in April, which means that NEM and GLD just went into a giant sideways pattern for quite some time.
If 360 breaks on GLD or 77 on NEM, I would take another look to see if it is bearish. Right now, the DSI on Gold is in the 80-ish area, which is why I am not even thinking it is about to break out.
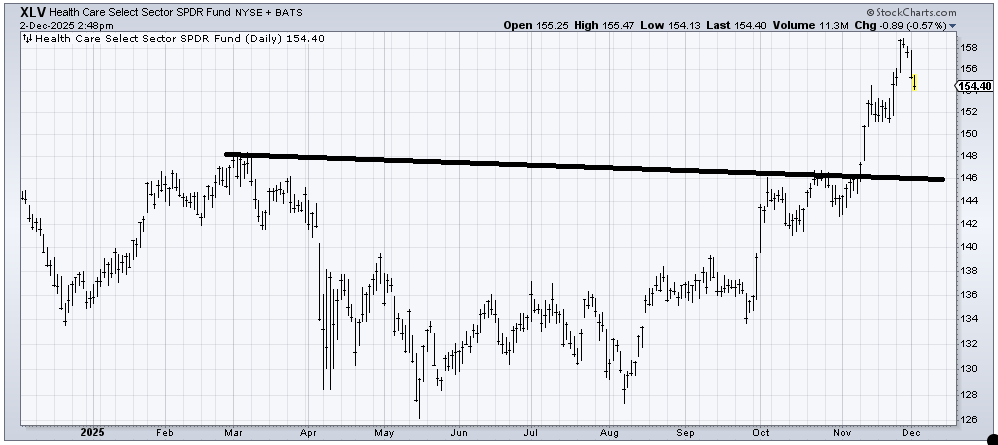
XLV, as I noted with the chart of Merck (MRK) the other day, is over-extended and in desperate need of a pullback (which began three days ago). I suspect I will like it again after a correction and some time to build a new pattern (and shake out all the late comers). First support is that 152-153 area. I’d love it to come back to 146-ish because that would be a real re-test of the breakout. Either way, patience is needed.
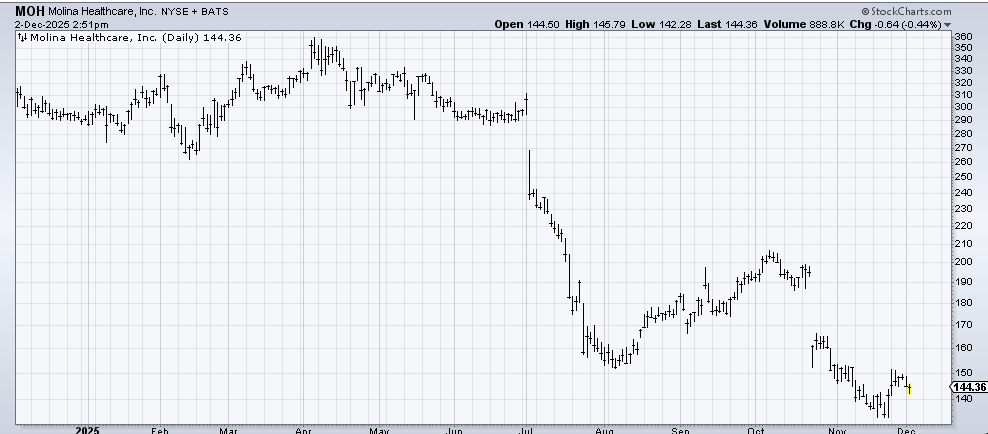
The best news I can offer on the chart of Molina Healthcare (MOH) is that there was a measured target around 130, so it ought to start basing. But with two gaps down in the last six months, I’d be inclined to wait for a base to build. Or at least let it get up over 165 to show me the sellers are finally done.
With my penchant for healthcare, though, I would like to warm up to this one.