After a Surprise Spike, This Market Looks Ready to Go Giddy
Monday's change in volatility is the perfect example of how sentiment shifts out of complacency.
You've reached your free article limit
You've read 0 of 1 free Pro articles.
The Market
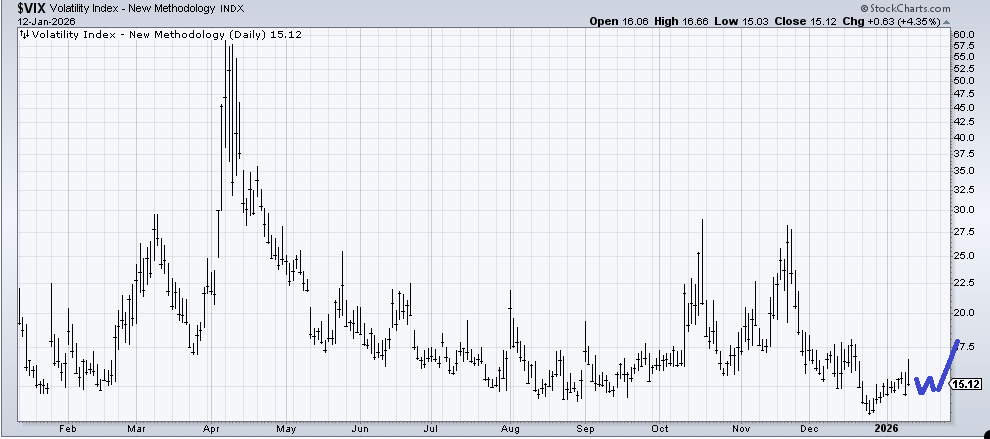
Hey, we got some volatility. Seriously, I got a tiny little spike in the VIX. What I would love to see is something akin to what I have drawn in blue. Because, while I know I have said this for a month now, this looks like a bottoming chart to me.
I think Monday was the perfect example of how we push sentiment from complacent to giddy. As I noted last week, folks were highlighting the lagging mega-cap tech stock, the QQQs. But the first group to turn green today was tech/Nasdaq. So a day like Monday changes minds.
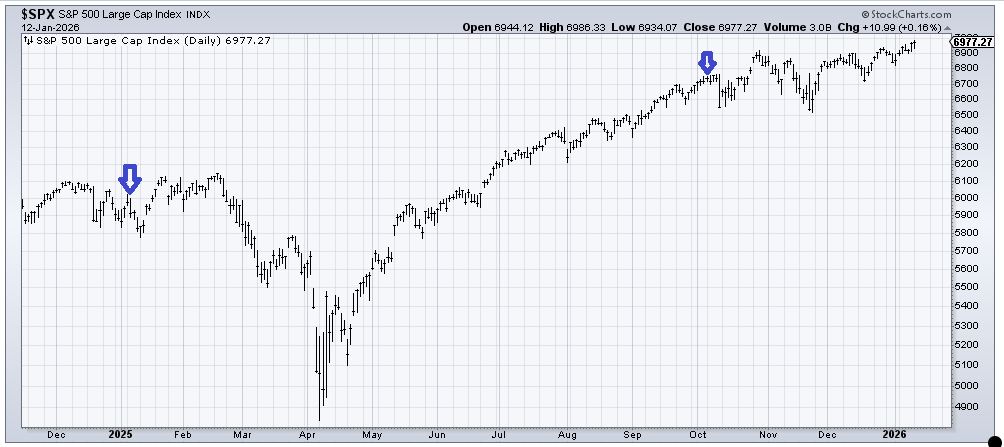
Folks go from "lagging tech" to "gosh, this market is like a beach ball under water." And if you need more proof of that, just look at the ISE Equity call/put ratio today. It was 3.05. It doesn’t get over 3.0 very often. In fact, the last time it did so was on October 8, 2025. But the last time before that was in early January 2025.
What do those two points in time have in common? Both saw a swoon within days. Both swoons were bought and made a higher high, and then came a "better" decline. I don’t know if it turns out the same way, but what I do know is that such a high reading tells me these folks stepped into "giddy" today where they were not last week.
We will be back to short-term overbought by Friday, so I’m thinking we should not rest on the volatility because it looks likely to return sometime next week. And wouldn’t that make sense as we head into earnings season.
New Ideas
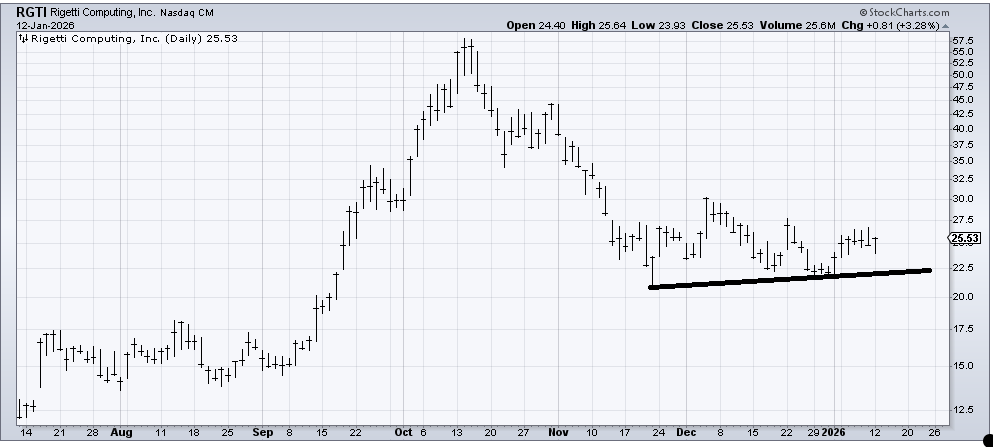
We had a great trade in Rigetti Computing (RGTI) last year so I was asked if it has "done enough work" to enjoy another rally. I would not argue against it. But I would consider it a trade only.
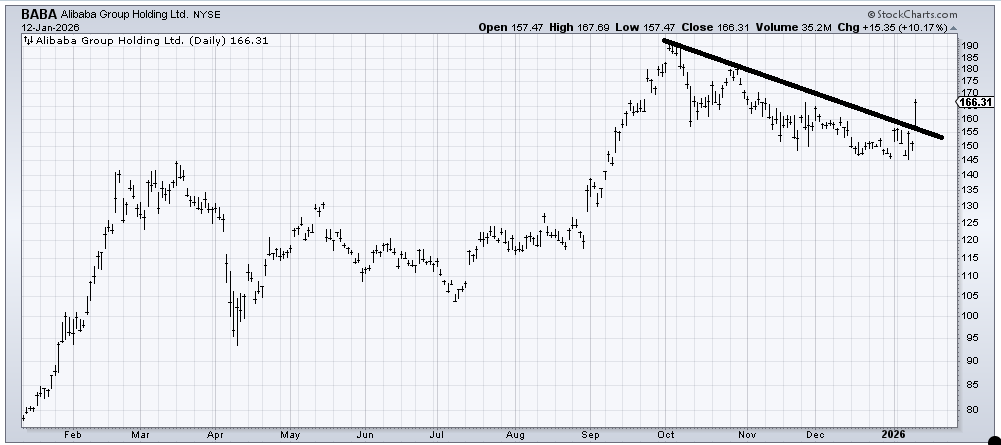
We finally got that rally in Alibaba (BABA) over the line. So where does it go now? There is resistance all the way up so I don’t have a proper target yet, but for now pullbacks look OK to be bought. Keep in mind this stock trades quite thinly so we can easily see it give back a chunk of Monday's gain.
Today’s Indicator
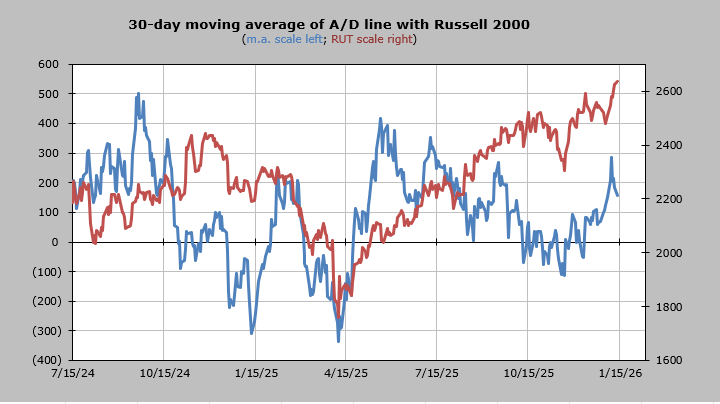
The 30-day moving average of the advance/decline line has come down quite a bit. It probably has a little room to head back up before getting back to overbought again next week.
Q&A/Reader’s Feedback
Helene welcomes your questions about Top Stocks and her charting strategy and techniques. Please send an email directly to Helene with your questions. However, please remember that TheStreet.com Top Stocks is not intended to provide personalized investment advice. Email Helene here.
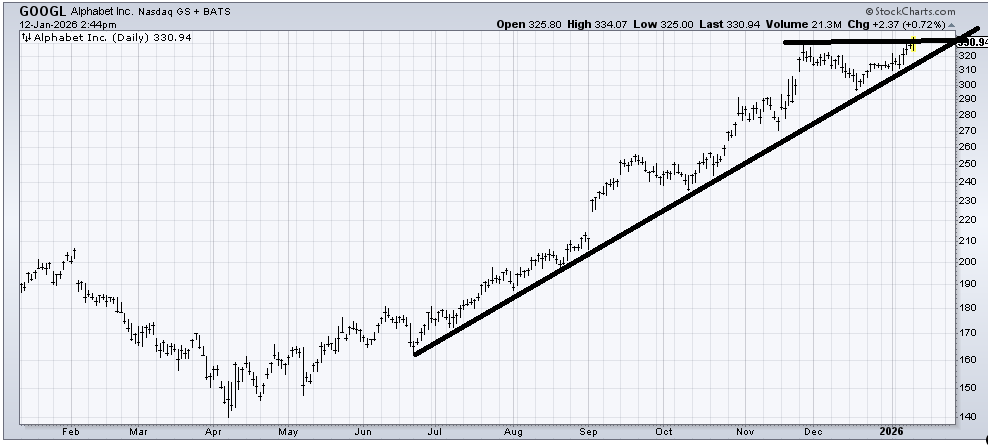
Alphabet (GOOGL) hasn’t done anything wrong but up here it is not my kind of chart just because it has had such a run. I call it a hold with a stop under that uptrend line (310-ish).
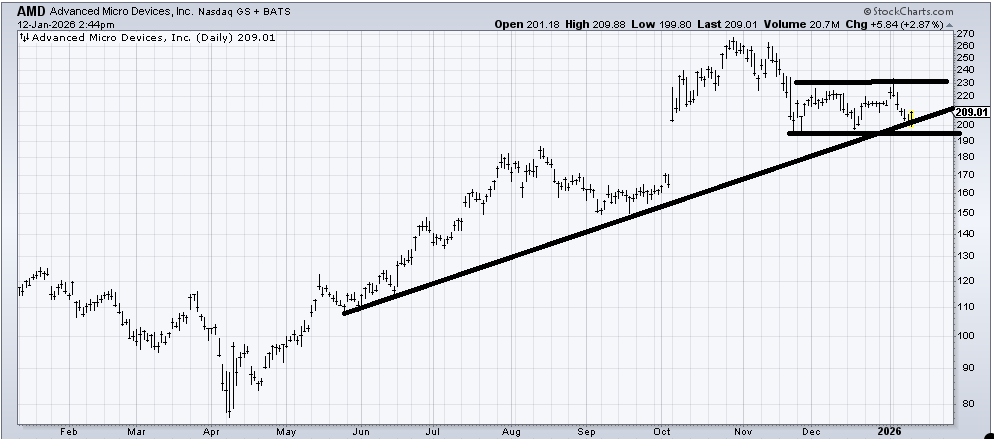
I liked the Advanced Micro Devices (AMD) chart a few weeks ago, the last time it was down in this area and the semis were oversold. Or, maybe I should say, I thought it could rally to resistance. And it did so.
I suppose as long as it doesn’t break this lower line it’s fine, but what would be great is if the stock could go sideways a bit longer and then whoosh to fill that gap. That would have given everyone who was a weak holder time to get out so the whoosh could be the last of the selling. A break of 190 and I think this goes to 170 in a hurry.
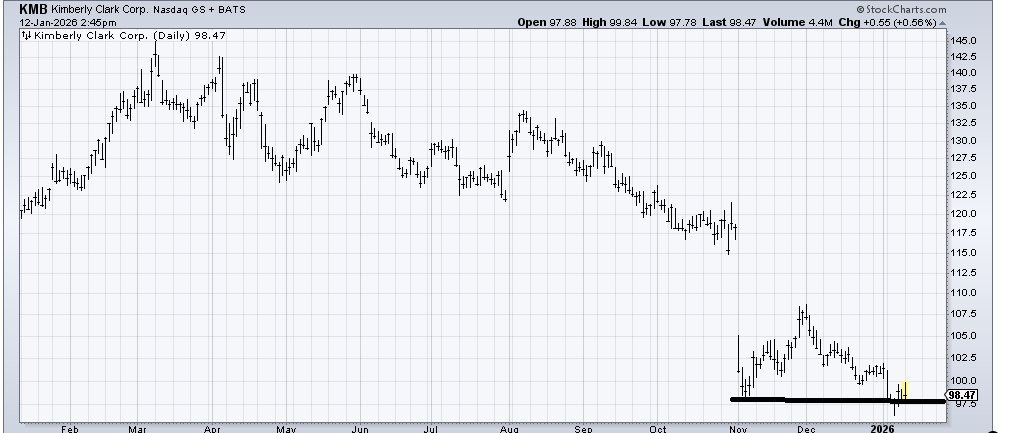
Kimberly Clark (KMB) is not one of the staples stocks I have considered buying lately, even for a trade. But now I am considering that it could play catch up in the coming weeks. I’ll be wrong if it trades much under 96.
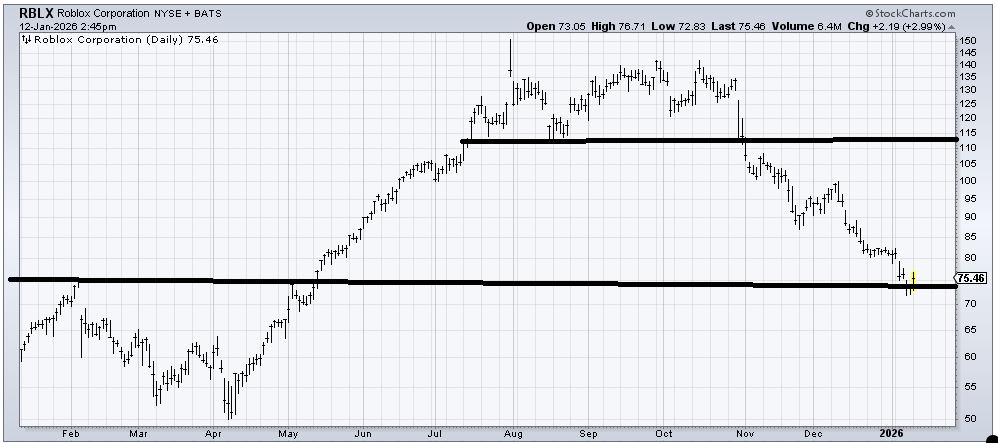
Roblox (RBLX) is certainly trying to hold support. It’s early but it’s oversold so might be worth a shot if you have some patience.
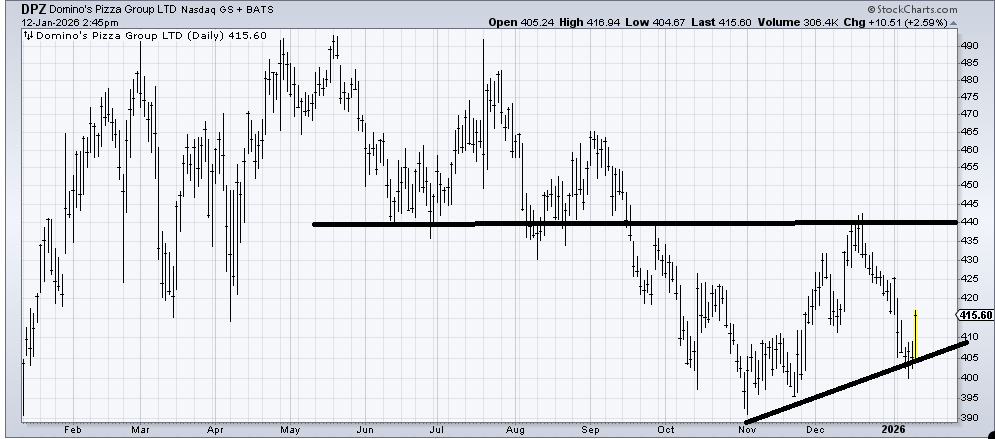
Domino’s Pizza (DPZ) is trying to bottom but it is early and there is much resistance overhead. It’s oversold enough to rally for a few more days.
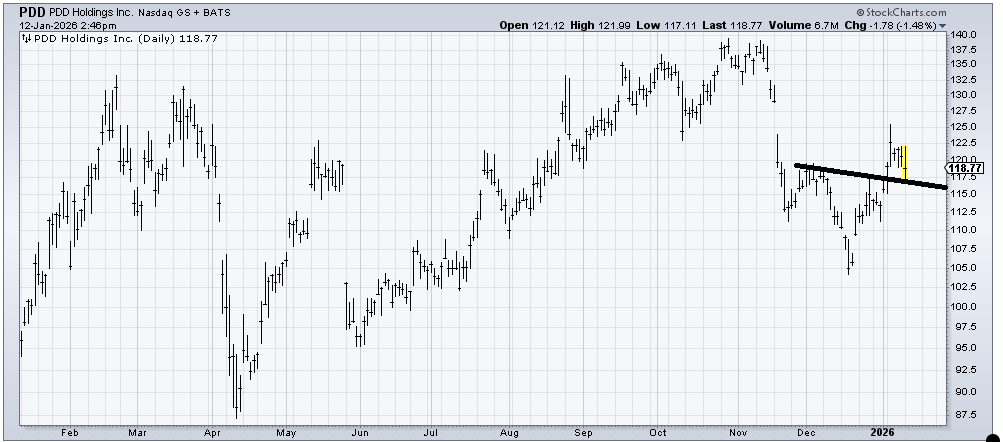
PDD Holdings (PDD) seems to be testing its breakout. I’d like to see it hold this 115 after and fill that gap overhead around 128.
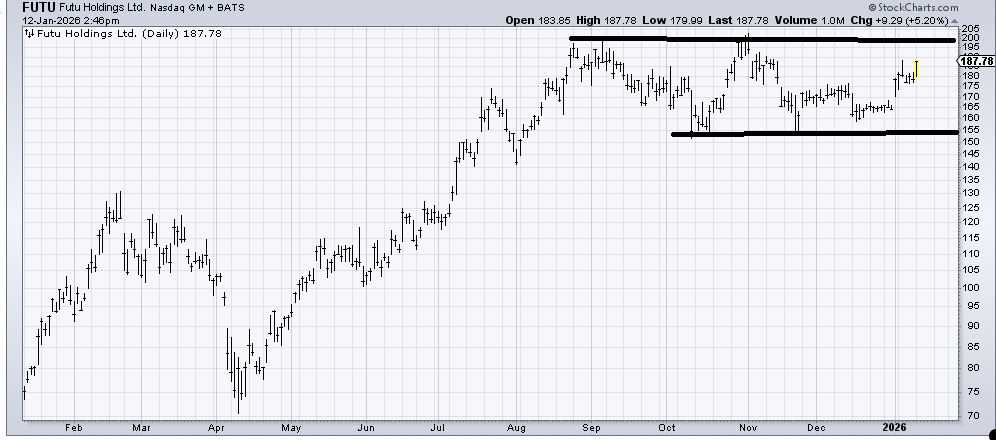
Futu Holdings (FUTU) is trying to rally. Can it get out of the resistance at 200? I would like to think so, but let’s see how it acts when it gets up there. The chart has gone nowhere for nearly five months, so it’s done the work.
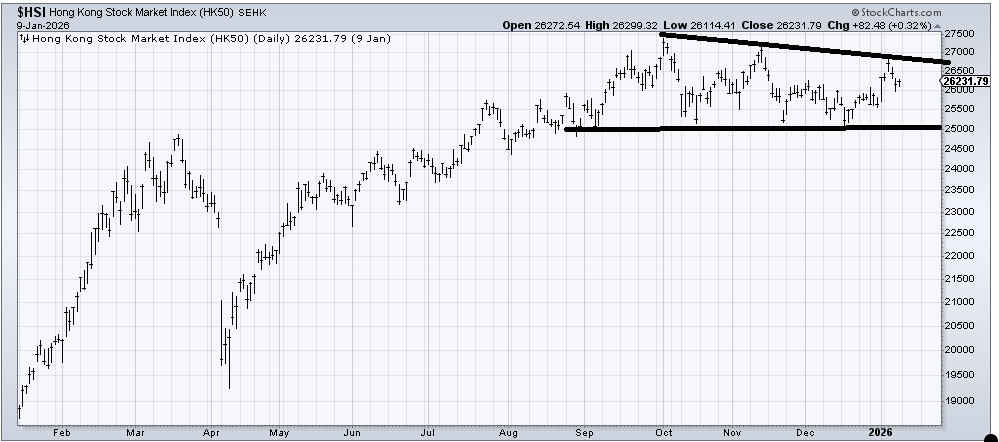
I have been a fan of (KWEB) , (BABA) and (BIDU) , so the question is about the Hang Seng (HSI) and can it breakout? Let me say this: If it can stay over 26,000 then I think he has a good chance at it. If it breaks 26,000, then I’ll stick with the trading range.
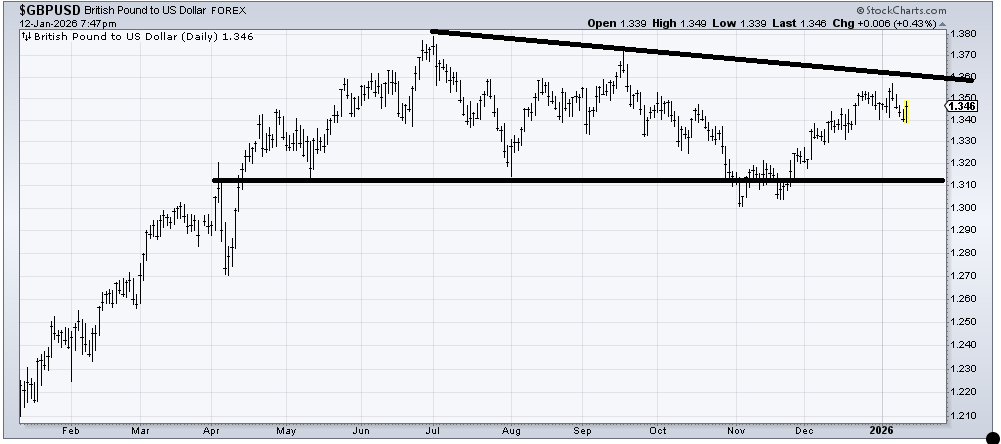
The British pound (versus the USD) looks range bound to me. I’m going to stick with range bound for now but if it gets up and over 1.36 with any oomph, then I’ll say it’s a breakout.
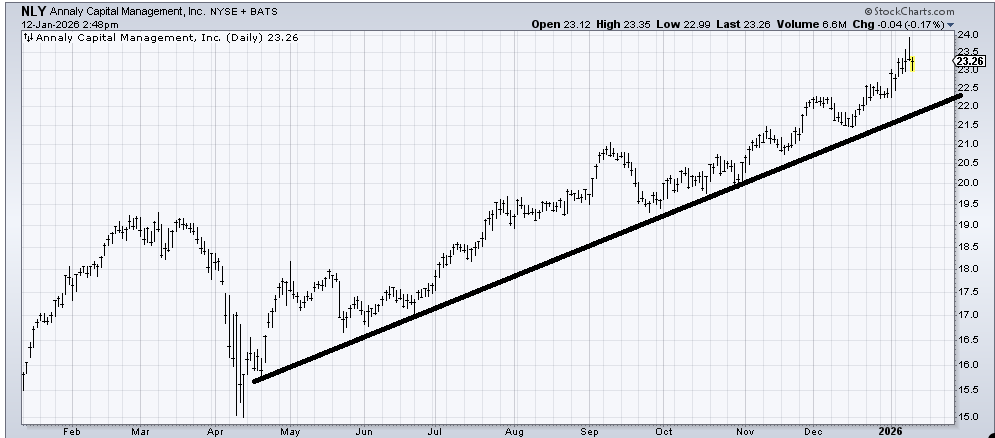
Annaly Capital (NLY) is in an uptrend, so if it pulls back to the line I’d be a buyer. But I can’t chase it.
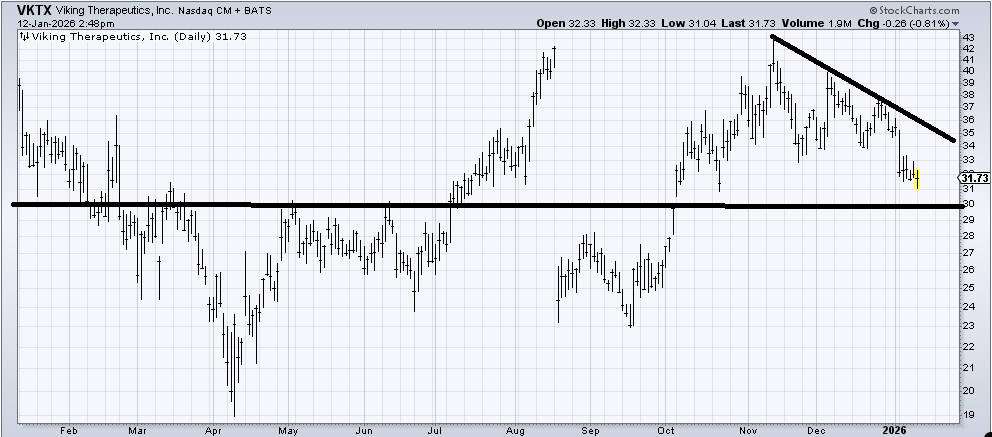
I don’t like the chart of Viking Therapeutics (VKTX) , but I do think there is an awful lot of support at 30. But it also has a lot of resistance overhead. It’s difficult to want to buy it with all of that resistance, but if it can bounce from 30 it ought to get to the downtrend line on a bounce.
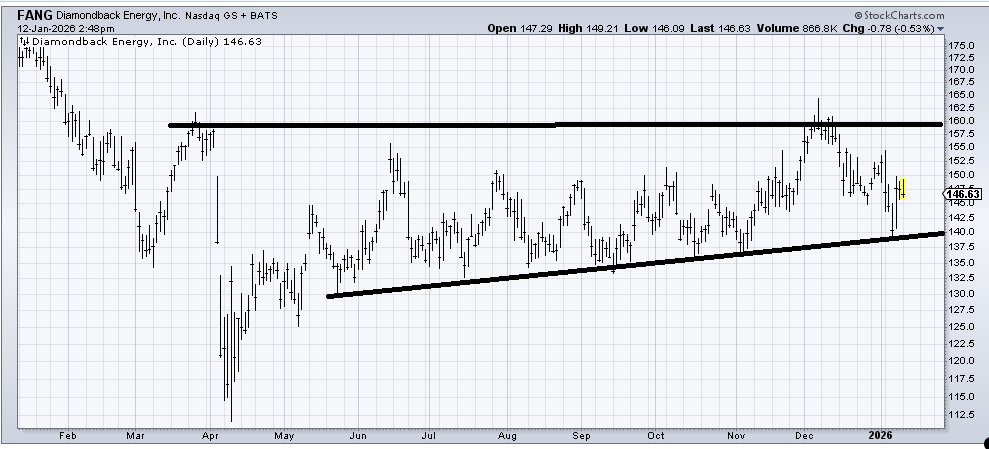
Diamondback Energy (FANG) has been going sideways for almost a year, so I would lean toward thinking we eventually see a breakout to the upside, obviously with a stop under 140.