After a Big Up Day, Can We Rally for Another Day or More?
Let's take a look at the indicators to see when the market might get to a short-term overbought.
You've reached your free article limit
You've read 0 of 1 free Pro articles.
The Market
Well, I feel better about the market today than I did yesterday. As you probably know, I am simply a slave to my indicators. I don’t use my gut feel (because my gut feel is terrible). I just use the indicators. Too bad the indicators couldn’t help me out on Monday!
But naturally, now the question is, can we rally for another day or more? When I first showed you the table of the numbers we are dropping from my Overbought/Oversold Oscillator a week ago, they showed a string of negative numbers that last until late this week.
By that I mean there is a negative number to be dropped Wednesday, a positive one on Thursday, but Friday we drop a decent red one. After that, it gets overbought. This is why I said late this week we should be back to overbought. I will stick with that for now.
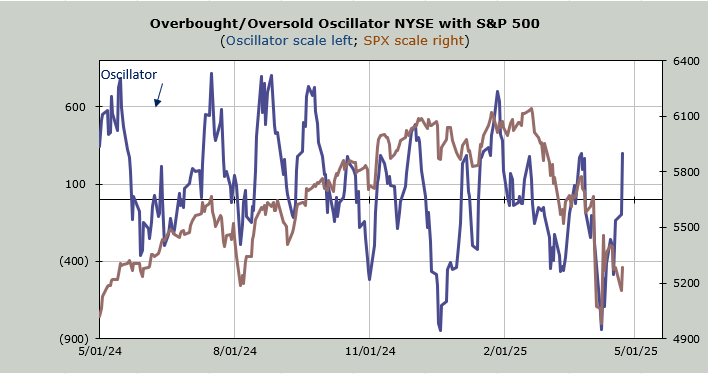
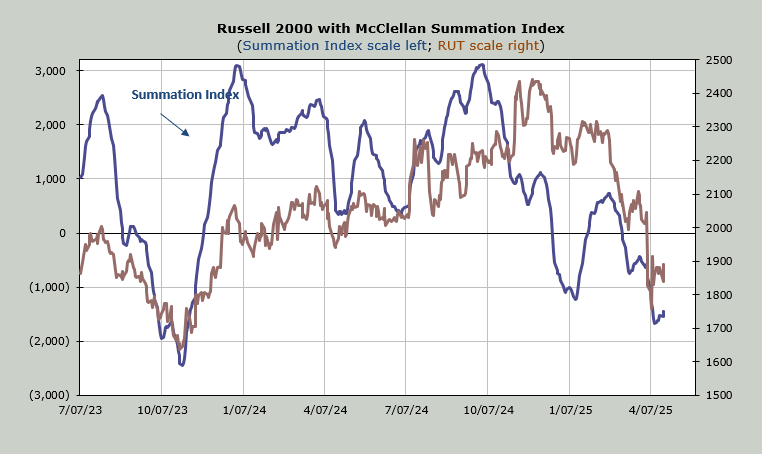
The McClellan Summation Index, which is still heading upward (shown below), currently needs a net differential of -2000 advancers minus decliners on the NYSE to halt the rise. If we have another good breadth day or two, this ought to get to -4000 or greater by Friday, rendering it overbought as well.
In other positive news, there were more new highs than lows on the NYSE today for the first time in a month (March 25th), which is a plus as well.
As usual, we’ll keep an eye on sentiment to see if it gets too bullish too quickly. Already today we saw the put/call ratio at.86, so my guess is folks get bullish in a hurry.
New Ideas
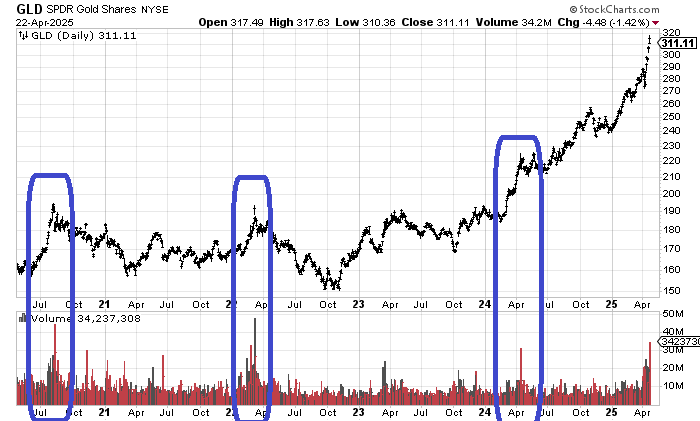
Let’s start with the chart of GLD. We have not managed to get the DSI over 90, but the volume in GLD today is the highest since early 2022. Long-time readers know I like high volume declines in the QQQ (recall we had over 100 million shares trade two weeks ago). When it comes to GLD, high-volume rallies tend to be a problem. At the very least, a correction is needed.
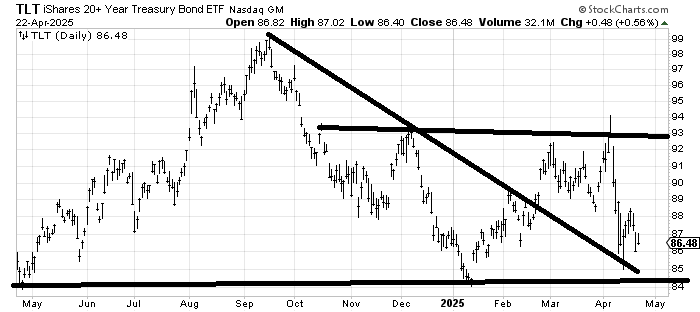
I was asked to address TLT again. It trades poorly, but I look at this chart, and it does not have the look of a chart about to break down. It continues to have the look of a chart that is going sideways in a wide range. Should it crack under 84 in a major way, I would have to reassess my view, but that’s not my current base case.
Today’s Indicator
The McClellan Summation Index is discussed above.
Q&A/Reader’s Feedback
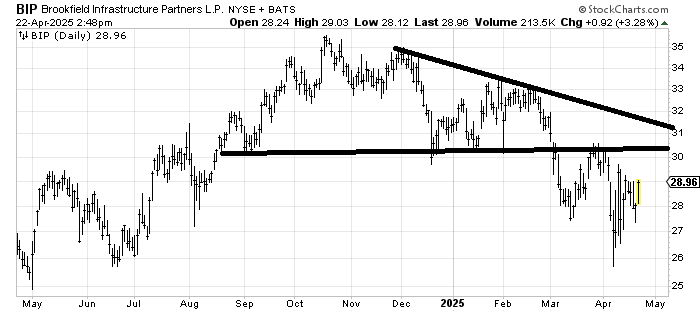
We can see the resistance overhead on the chart of Brookfield Infrastructure Partners BIP, so I’d say I’m a little bit positive on it in the short term because it ought to make its way there to resistance.
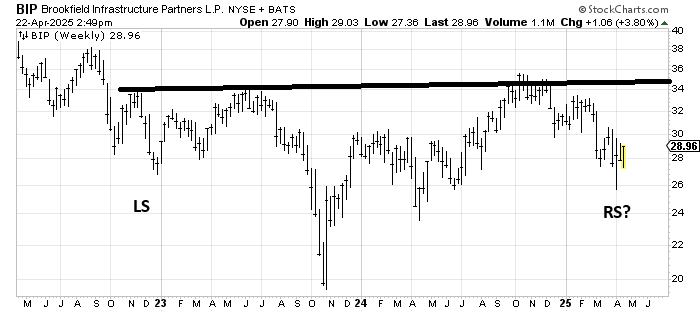
However, when we step back and look at the three-year weekly chart, I see a base building, a potential head and shoulders bottom. It needs time to develop, but if you have some patience, it seems okay.
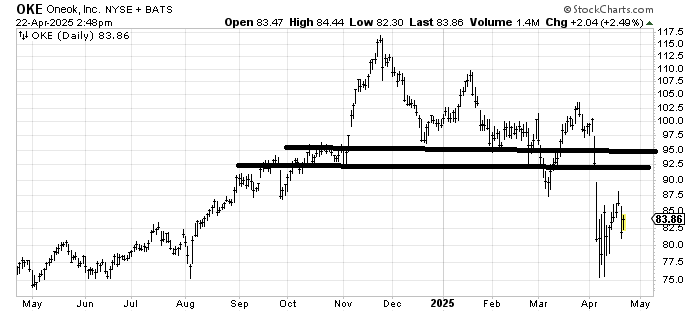
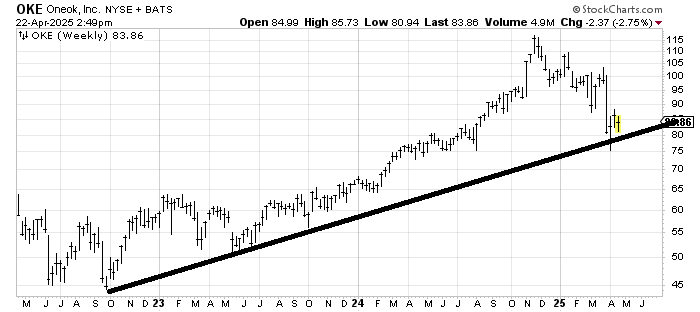
Oneok OKE has one good thing I can say about it: when it got to 75, it tagged the measured downside target. In the short term, 92-93 would be a good place to sell it. On a longer-term chart, it hasn’t done anything wrong. I just don’t like that big gap that needs to be filled.
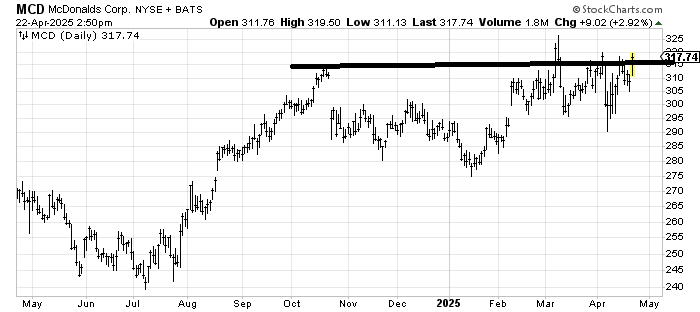
I recommended McDonald’s MCD back in January, and I admit it has held up rather well. I don’t love buying stocks that are up and have had very little selling, but the chart hasn’t done anything wrong yet. In the short term, that spike high at 325 is going to be difficult.