A Tough Day But Are We Closer to an Oversold Bounce?
The market was down and indicators show concern but there was no panic.
You've reached your free article limit
You've read 0 of 1 free Pro articles.
The Market
Wasn’t that an interesting day?
First, let me say I don’t much care about the 200-day moving average, although everyone else seems to. If you are looking for a bounce off of it, let me remind you that the IWM sliced right through its 200-DMA so I would not use the 200-DMA as my guide.
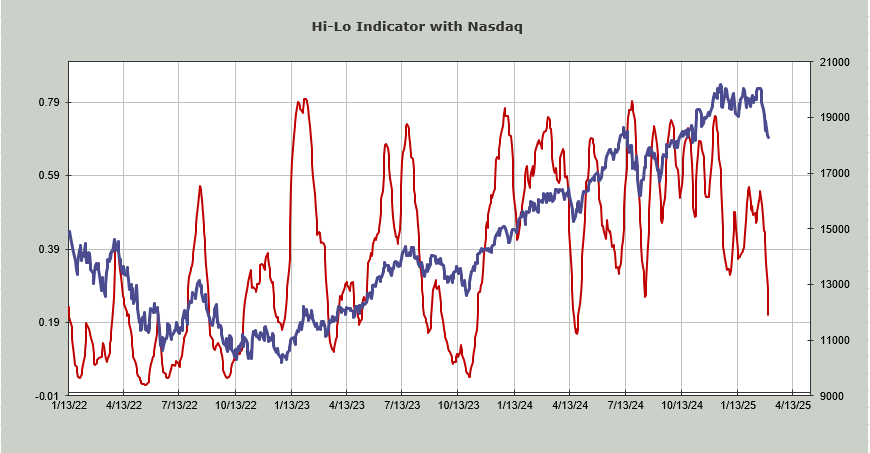
I still do not like the number of stocks making new lows, which keeps expanding. However, all that selling has taken the Nasdaq Hi-Lo Indicator to .21, so it’s at least getting closer to an oversold condition
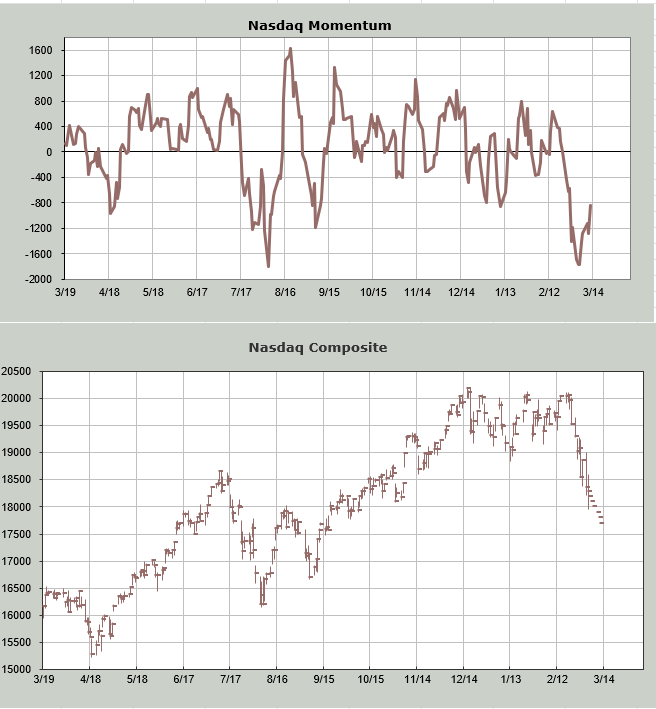
I am however interested in the oversoldness. The short-term still sets up for an oversold rally. Even after today, that Nasdaq Momentum Indicator still turns higher starting tomorrow. I suppose if Nasdaq were to crumble 7 or 800 points in one day, it would change the indicator, but that’s not my expectation.
I don’t think there was panic today. We did not see 90% of the volume on the downside (73% is what we saw). I did not see the VIX get jumpy. I did not see the put/call ratio over 1.0.
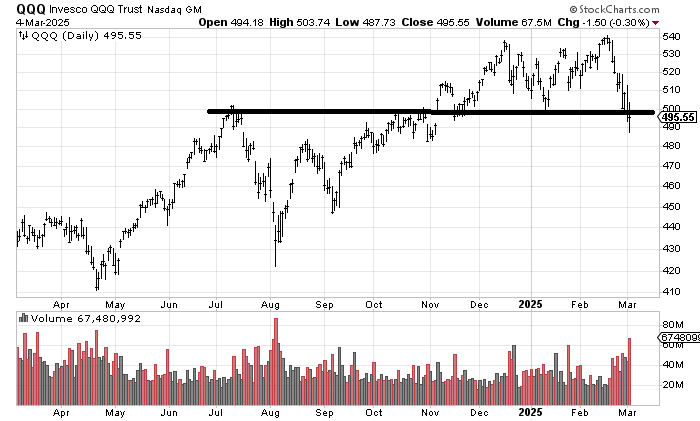
But I did see the NYSE with the highest volume in more than a year for a day that was not an expiration or rebalancing day in the market. I also saw the QQQs with their first volume day over 60 million shares since the August low.
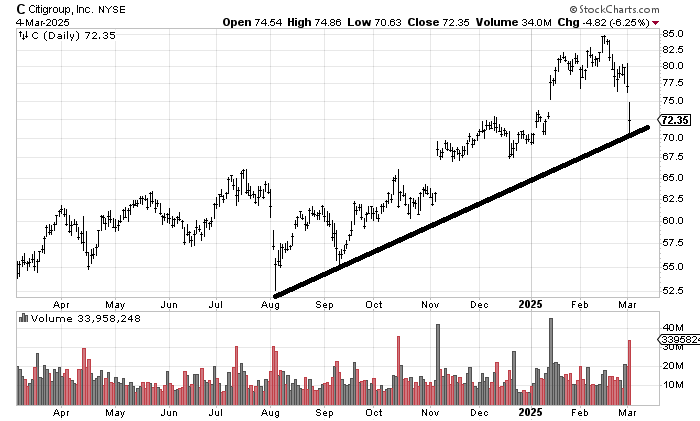
I also saw a massive amount of volume in the bank stocks. I have not been a fan of the banks for a while now –and I am still not—but Citigroup C did come down and tag that uptrend line, and it did it on volume.
But do you see that trading in the last two months? It looks like the chart has a hat on now. If Citi cannot fill that gap at 77-ish in a hurry, that will be an island, and I would look for the line to break after a rally.
So yes, despite some pretty poor action and some not so pretty charts, I still think we are due a short-term oversold rally.
New Ideas
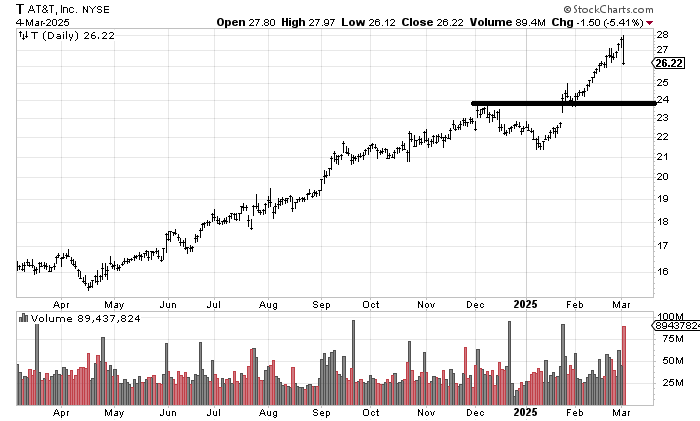
It’s been a while since we checked in on AT&T T but you can see the sellers finally come for it today—and look at the volume. I don’t think it goes down easily but I do think it eventually makes its way toward that line around 24. It’s had a great run, I’d take some profits.
On the buy side, I will always look to trade an index when we get oversold. It’s just a trade.
Today’s Indicator
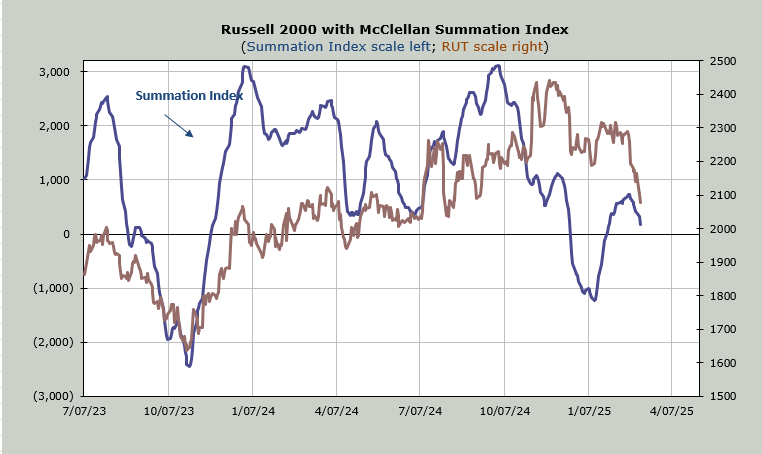
The McClellan Summation Index is still heading down. It needs a net differential of +2500 advancers minus decliners on the NYSE to halt the slide. That is not extreme (Nasdaq is extreme).
Q&A/Reader’s Feedback
Helene welcomes your questions about Top Stocks and her charting strategy and techniques. Please send an email directly to Helene with your questions. However, please remember that TheStreet.com Top Stocks is not intended to provide personalized investment advice. Email Helene here.
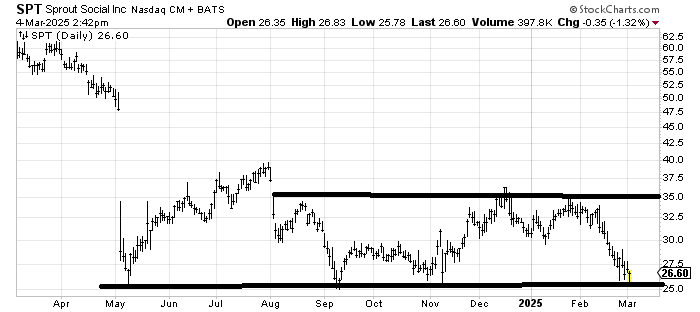
They say there is no such thing as triple bottoms. That might be the case. I do not know what they say about quadruple bottoms, but the risk/reward for Sprout Social SPT isn’t bad. You know you are very wrong if it breaks under 25 in a meaningful way. My guess is you need some patience for this, though.
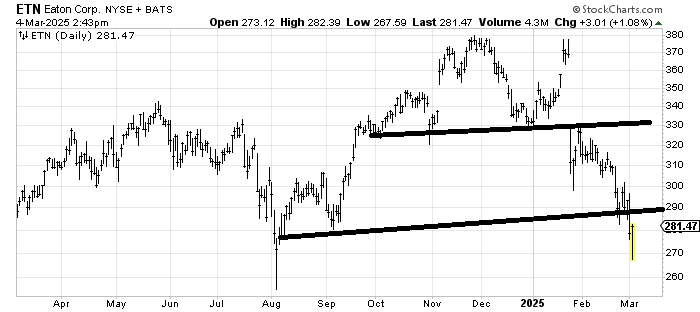
That top in Eaton ETN measured to 280-ish, which is where it is now. It needs to recapture 290, though, for me to trust that this is ‘it.’ Then it would need quite some time to work to build a base. The first step, though, is getting back over 290.
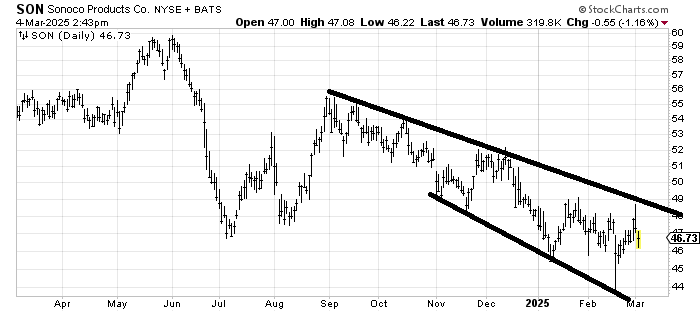
I have drawn in some weird lines on Sonoco SON because they are not really straight, but considering they have been working for a few months now, I’m going to use them. Until something changes, buy the lower line and sell the upper one. If it gets over 49, that would be quite a change (to the positive).
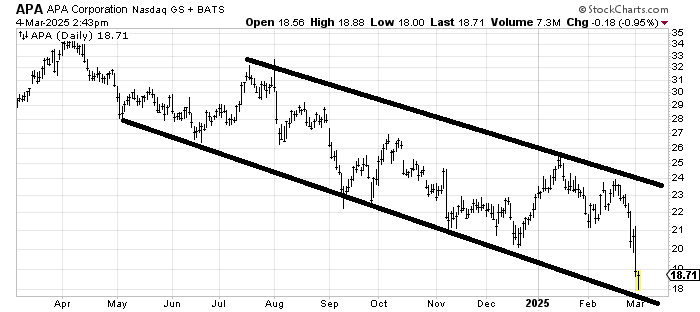
APA APA is in a downtrend/channel. As with most channels, you should buy the low-end and sell the high-end. If I didn’t draw in the channel and drew flat straight lines, then this is a sale at 20-21. I note that because if it stops at 20-21 instead of making it all the way up to the top, that would imply it’s going even lower.