A Rather Disappointing Day, Despite the Big Gains
The market is playing out according to the sentiment map I've shared. So, what's next?
You've reached your free article limit
You've read 0 of 1 free Pro articles.
The Market
Yes, I know today was a bit of a disappointment as stocks drifted lower after the open and closed near the lows. But breadth stayed positive all day. Again.
In fact, of all the major indexes, the Russell 2000 is the only one that has managed to get over that Wednesday 4//9 peak so far. So while the Russell hasn’t outperformed in the last two days, it hasn’t underperformed either; it has kept pace.
Another interesting positive is that the number of stocks making new highs was more than new lows for Nasdaq today. We saw that in yesterday’s NYSE numbers, but today was Nasdaq’s turn, and it was the first time since mid-February.
In terms of sentiment, I’m going to say today was an odd day sentiment-wise. We have not managed to see a day with the ISE call/put ratio under 1.0 almost the entire decline, but today it was under 1.0. All of a sudden, they are not loading up on calls? Weird. But it goes on the positive side of the ledger.
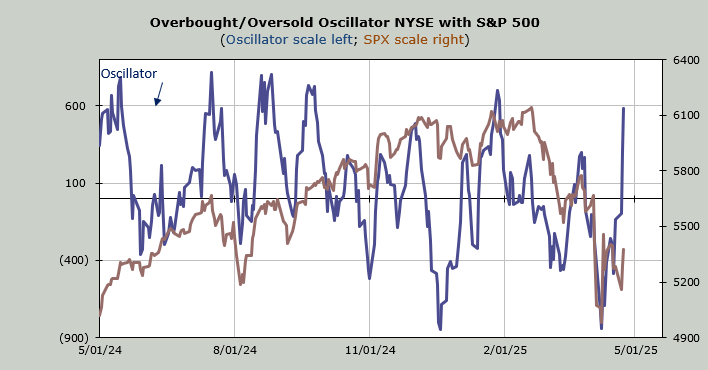
Now let’s talk about my Overbought/Oversold Oscillator. Just a week ago, I showed you the table of the numbers we were set to drop off the ten-day moving average of the net of the advance/decline line. There was a string of big red numbers, which I thought meant we should rally. I noted that I thought the Oscillator, which was at the bottom of the page, ought to get up and over the zero line. Well, today it did so in a big way.
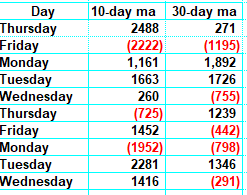
Now we will look at the numbers we are dropping going forward. What you can see is that Friday seems to be the last day for several days that we will drop a big red number (when we drop big red numbers, we are oversold or at least not overbought; when we drop big green/black numbers, we are overbought).
What we see is that we will take a little step into overbought territory tomorrow, but it’s possible we rally through Friday. Either way, I would view next week as overbought. I have also shared the 30-day moving average numbers with you so you can see they aren’t dropping a lot of red either.
My view has been that after the Panic low, we should rebound and then that rebound tends to go into a choppy period with a lot of ups and downs. Next week could see another dip.
New Ideas
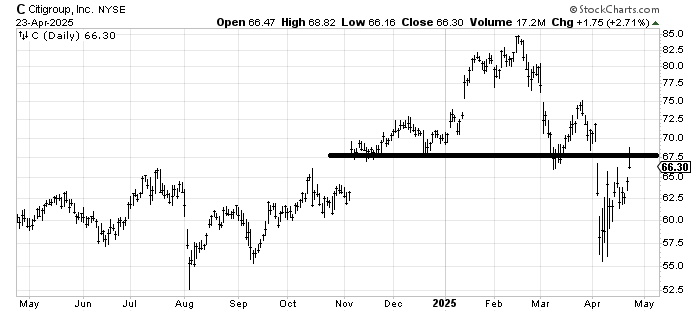
Two days ago, I looked at Citigroup C with a positive eye because I thought it was acting better/well. But I also noted that it had a ton of resistance overhead, and it was going to take time to get up there, eat through it, and do some work.
Today, it was rejected from resistance. Think of it like that old joke: how do you eat an elephant? one bite at a time. Today was the first bite. I think with some back and forth, it should improve.
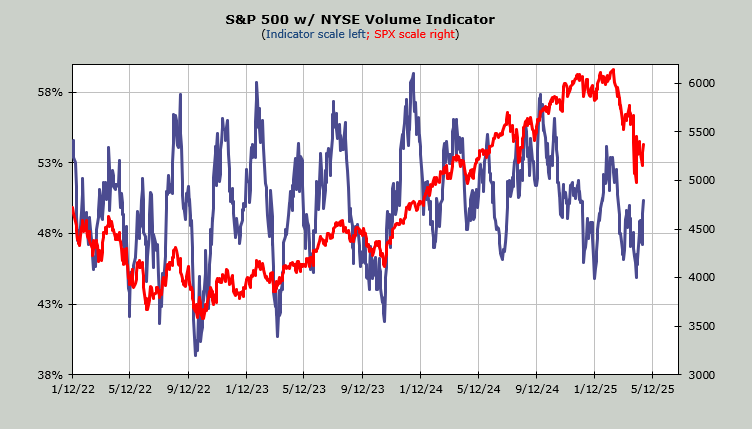
Today’s Indicator
The Volume Indicator is at 50%. It is no longer oversold. I’ll call it neutral.
Q&A/Reader’s Feedback
Helene welcomes your questions about Top Stocks and her charting strategy and techniques. Please send an email directly to Helene with your questions. However, please remember that TheStreet.com Top Stocks is not intended to provide personalized investment advice. Email Helene here.
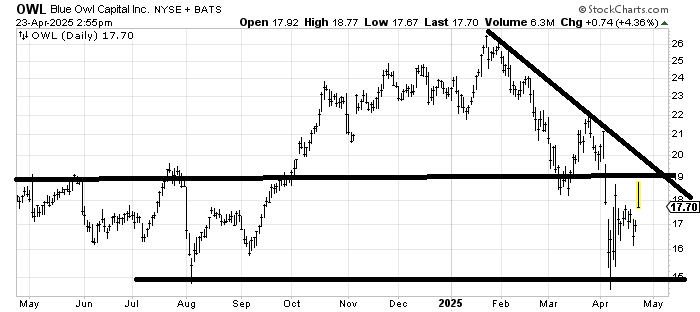
Blue Owl OWL has a lot of resistance at 19-20 (like so many other charts). I’d venture to say that this is a chart more likely to go sideways (between 15-20) for a time rather than zoom upward or collapse. If it can cross over 20, I would consider that a more constructive move.
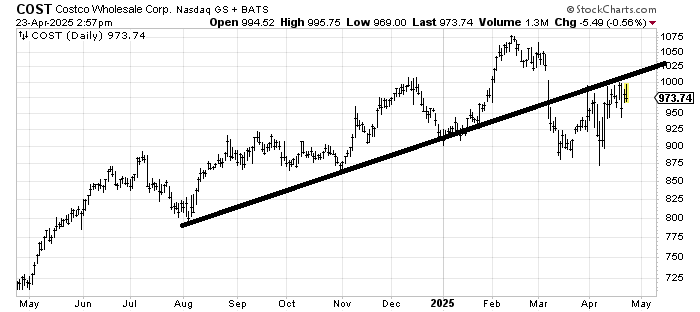
When we looked at Costco COST about a week or so ago, I said I expected it to rally to 1000, but the question would be if it could get through. So far, it has not been able to do so. If it goes over 1000, I expect it to fill that gap at 1025, which would also negate the head and shoulders top that is in place.
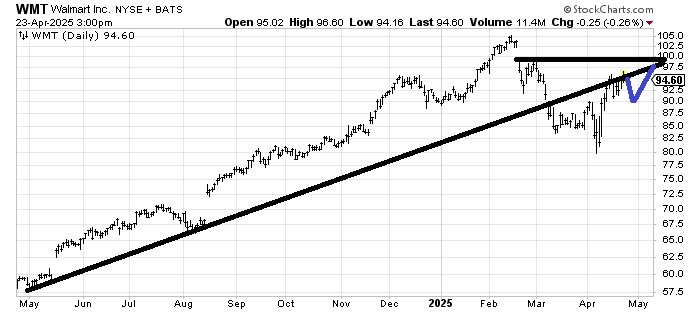
Walmart WMT has actually done rather well in that it has made a higher high than the April 9th high. I think it has one more rally in it, at least to 100 and maybe to fill that gap around 102-103. It should dip toward 90-ish first before another rally, though.