A Possible Bullish Setup as Sentiment Turns Bearish
Investor sentiment has tumbled over the holiday season. Is it possible we could set up to climb a wall of worry?
You've reached your free article limit
You've read 0 of 1 free Pro articles.
The Market
Let me share what I think would be an excellent setup over the next few weeks.
We have seen the ‘others’ get quite oversold over the last few weeks but as I explained in my first missive of the new year, most of those stocks reached their lows right around the December FOMC meeting and have since been drifting upward/sideways. Yet in that same two or three week period the sentiment had finally come off the boil.
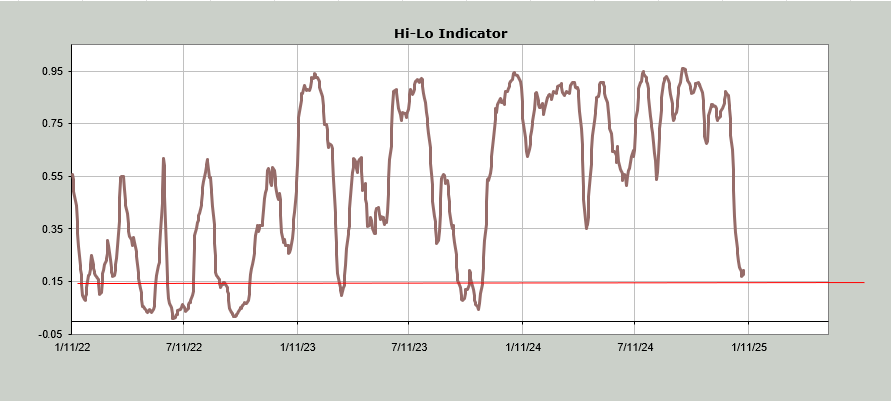
Some intermediate term indicators reached an extreme oversold condition (for example, the Volume Indicator got to 46%, where oversold territory is around 47%) while others could use one more push (such as the HiLo Indicator which sits at .17 where oversold is under .15). Some of this might sound picky but for arguments sake let’s say it’s not picky.
That means if the market opted to take one more slide in the next week or so almost all the intermediate term indicators would be firmly oversold. That also means that the sentiment which as I noted came off the bullish boil as of Thursday might even get to the point I would call it bearish.
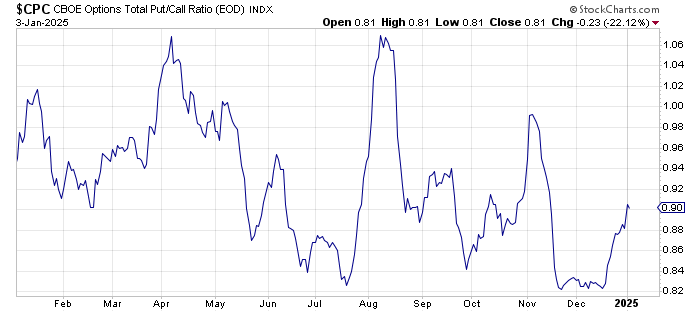
For example, the day traders at AAII might even have more bears than bulls. The Investors Intelligence bulls, now at 54% might slip into the 40s. And the ten day moving average of the put/call ratio might even get up at/near 1.0.
And maybe, just maybe, we would see interest rates have one more spike up (TLT down), something to get folks panicky—give them a ‘reason’ to turn bearish.
That would be the kind of set up that would feel as if we could have a multi-week rally.
Even if we don’t get that set up I think the opportunity is there but let me point out that the put/call ratio for equities got to .80 on Thursday, a reading not seen since the big slide in early September. That is a positive in terms of sentiment. A big one.
But on Friday we rallied and what did that same metric do? Sunk to .45, the lowest reading since before Christmas. In other words, all it took was one day of rallying for all that put buying to evaporate. That’s why I would like it to get to the point that when we do rally we actually have a Wall of Worry, not an immediate return to ‘here we go’.
New Ideas
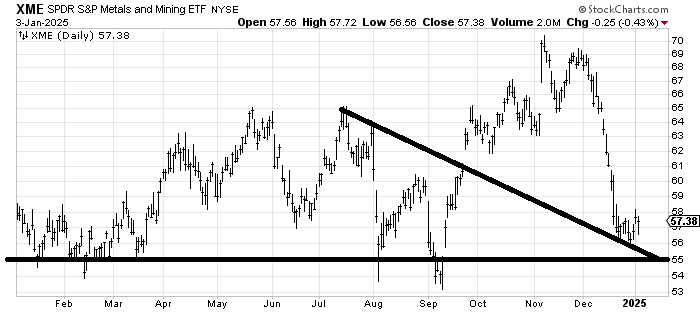
Let’s take a look at XME, an etf to be long metals and mining. It is down 20% since the pop after the election. I can’t think of anyone who likes this group yet as we discussed last week, here is another chart that essentially made its low right near the FOMC meeting. If we did see another pullback in the market this coming week I still think this would hold that 55-56 area because it is starting to look sold out.
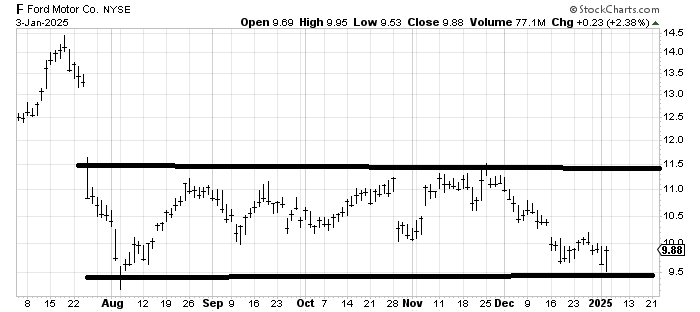
Take a look at Ford F which I was asked about when the stock was around 11. I was not excited about it then but Friday saw bad news for auto makers and the stock bounced right off support. It has a ton of resistance all the way up but get it through 10 and it crosses the first resistance hurdle.
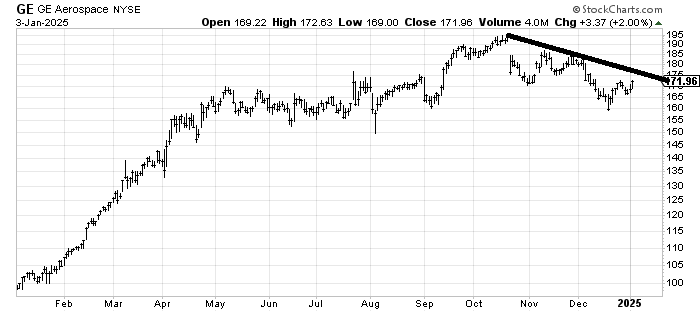
GE Aerospace GE is the poster child for what many stocks did last year. It peaked in the spring (we discussed this a month or so ago) then had a nice rally into October when that was it (the majority of stocks have been going down since October). Then it bottomed on the FOMC day and made a higher low last week. It has resistance all the way up but isn’t it possible it is sold out and can cross that line?
Today’s Indicator
The number of stocks making new lows has dried up (noted last week). The Hi-Lo Indicator sits just north of a really good oversold condition. Perhaps I am quibbling over a few points here or there so let’s call this an indicator that says one more push down would do it which is why we shouldn’t fear if we get more downside, we should embrace it.
Q&A/Reader’s Feedback
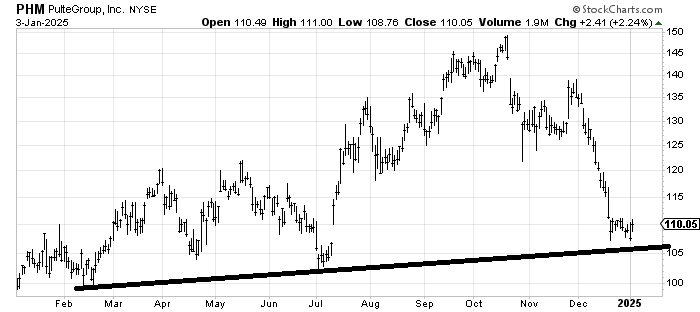
Pulte PHM and the other homebuilders have become a hated group. Notice this is yet another stock that peaked in October but it is also another chart that seems to have found an area of a low on that FOMC day. One more trip down looks to me as if it would find support in that 105-ish area. I think it can rally to 120, especially if we get that set up I so desire!
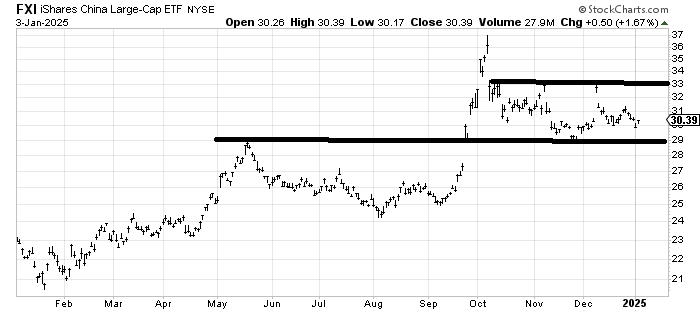
I have not spent a great deal of time discussing what I believe is the relationship between the majority of stocks here and the Chinese market but it’s there. That peak in October shows up on so many of our charts. FXI has been in a trading range for three months now so when it’s at the bottom of the range I look for a rally to the top and vice versa. Until that changes the set up is there. So a rally toward 33-ish.
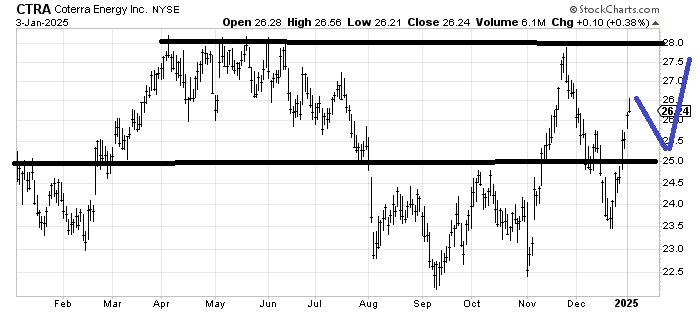
Coterra Energy CTRA has had quite a pop since the FOMC meeting (there it is again!). I would like to see it pullback toward 25-25.50 before it makes another stab at resistance since it is quite over-extended right now. I’ve drawn in blue what would make this chart more interesting to me.
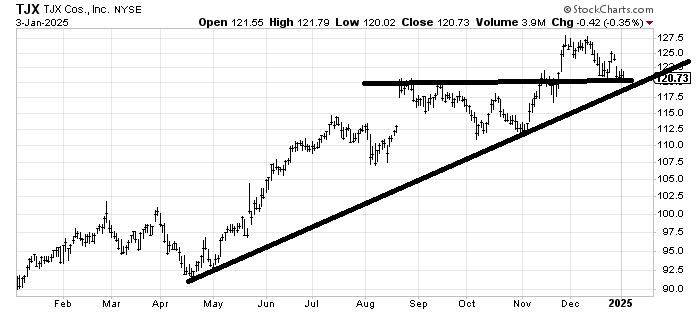
TJX TJX proves another point I tend to make: most retailers tend to make a high between Thanksgiving and Christmas. There is support in this 120 area but this is not my kind of chart. It hasn’t corrected enough to be down and out, it met its upside measured target when it got to 127 and it has a gap down from late December. If it rallies and can’t get over 125 I would fret it breaks 120 on the next trip down.
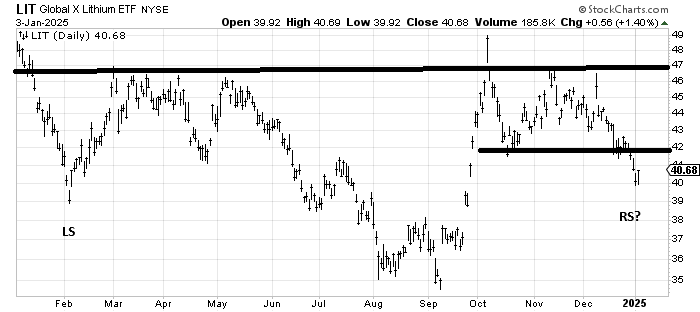
Hope springs eternal with me: is LIT, an etf to be long Lithium forming the right shoulder of a head and shoulders bottom? If it can’t get over 42 then I am wrong.
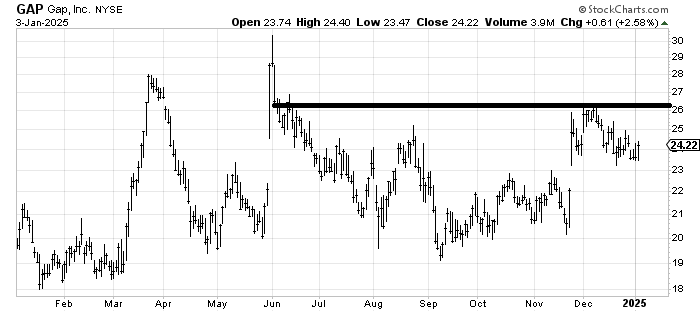
Gap GAP made a high between Thanksgiving and Christmas but it is developing a base. A whack into 22-23 would fill that gap (a positive) but I like the base so I lean toward being a buyer. The only issue is that a stop is quite far away.