A New High, but Expect the Choppiness to Continue
Breadth holds the clues for when this chop might end.
You've reached your free article limit
You've read 0 of 1 free Pro articles.
The Market
Well, we got to see what was up there on a rally today. It wasn’t great. It wasn’t awful, but it is not what I was hoping for.
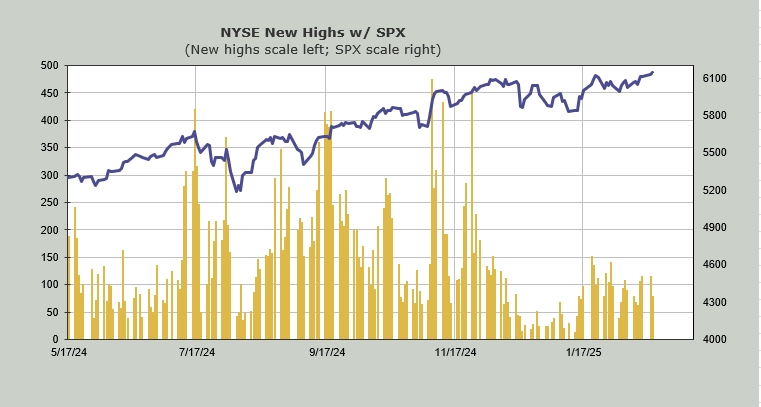
First, new highs did not expand but, rather, contracted. And new lows ticked up. Yesterday, the NYSE saw 115 new highs, and today, there were 78.
And yes, I know the Russell was down, and breadth wasn’t great today (see? Not great but not awful) but I am going to stick with my view that we are more apt to be choppy than blast off to the upside or collapse right now.
I would note that one reason I have been in the choppy camp is that the 10-day moving average of breadth was dropping positive numbers while the 30-day was dropping negative ones. And vice versa. That’s how February set up, and it continues to set up that way.
However, by midweek next week, we’ll have both the ten and thirty-day moving average lines set to drop a string of positive numbers. Keep that in mind while I note that the McClellan Summation Index is still rising. It now needs a net differential of -500 advancers minus decliners on the NYSE to halt the rise. Should that indicator roll over between now and midweek next week, it would give us a set-up for another pullback in the market.
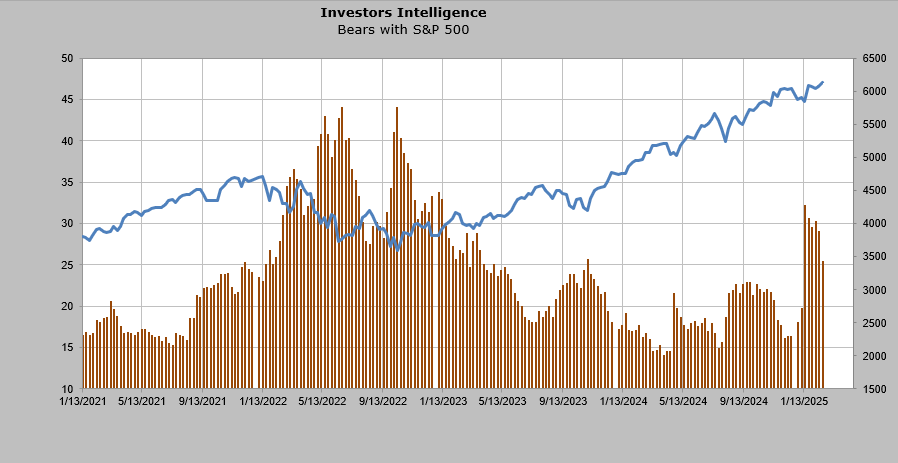
The Investors Intelligence folks remain vastly different than the AAII folks with the bulls up nearly four to 49.2% and the bears down four to 25.4%. The bears are the lowest they have been in six weeks. I don’t think they will collapse in the next week but I suppose it is possible the bulls get to 55% although I think that would be a huge stretch.
New Ideas
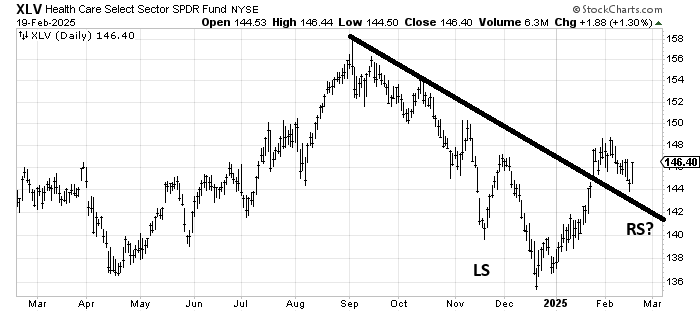
I keep getting asked about XLV. I keep seeing this pattern setting up when it comes to this ETF for drugs or healthcare. I know it’s a bit funky because the neckline is up-slanting but that’s what I see and it is a positive. Recall everyone loved healthcare in January when it was strong but now they don’t talk about it because it pulled back.
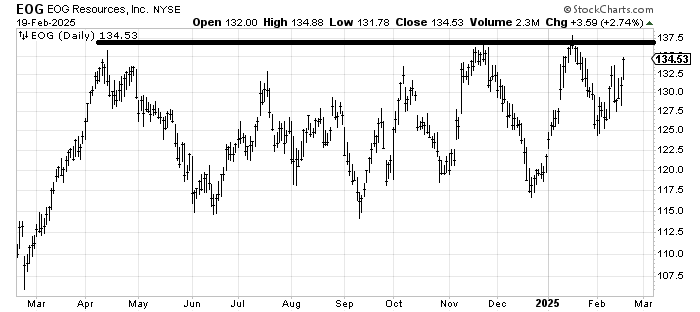
Typically, I hesitate to show the sort of base that EOG Resources EOG has because it is a high base, trading near the top of the range. And the line is not exactly flat. But if this ever breaks out, that would be terrific. I think it gives it a try in the next month or so.
Today’s Indicator
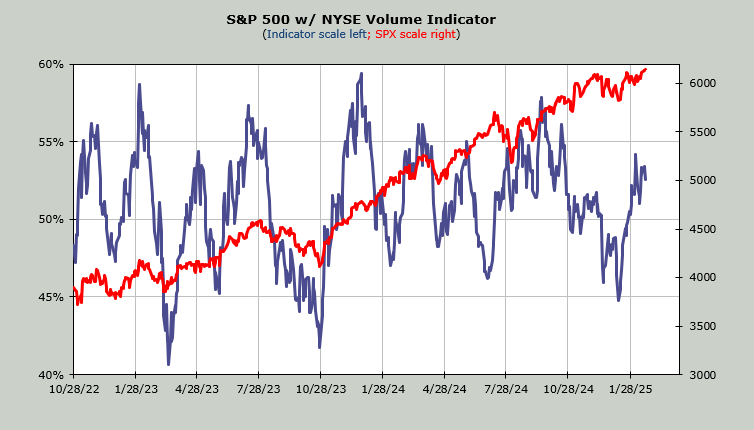
The Volume Indicator leans overbought, but considering breadth has been okay, not great, and the S&P is at a new high, I’m thinking it’s the lack of market momentum that this can’t even get to 55%.
Q&A/Reader’s Feedback
Helene welcomes your questions about Top Stocks and her charting strategy and techniques. Please send an email directly to Helene with your questions. However, please remember that TheStreet.com Top Stocks is not intended to provide personalized investment advice. Email Helene here.
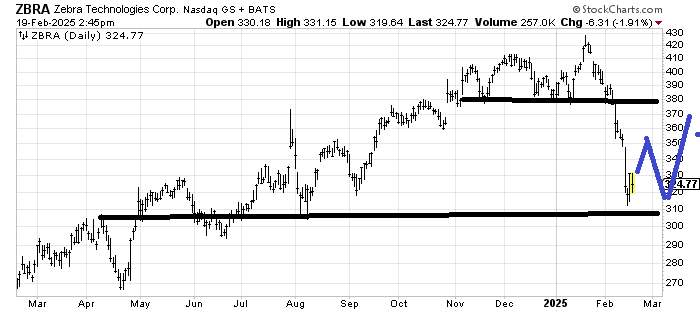
Zebra Technologies ZBRA has met its downside target when it collapsed recently. It is also at/near support. As someone who prefers to see at least a W pattern I would say have some patience. Let it bounce and come back down to at least prove that this is the spot folks are willing to buy it.
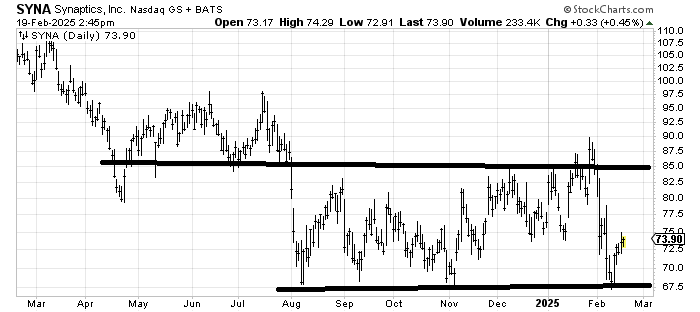
Synatpics SYNA is yet another stock that has gone sideways for months on end. It’s got some short term resistance in this 75-ish area so if it gets rejected from there and pulls back to the low end of the range I’d say it’s buyable for a trade in the range.
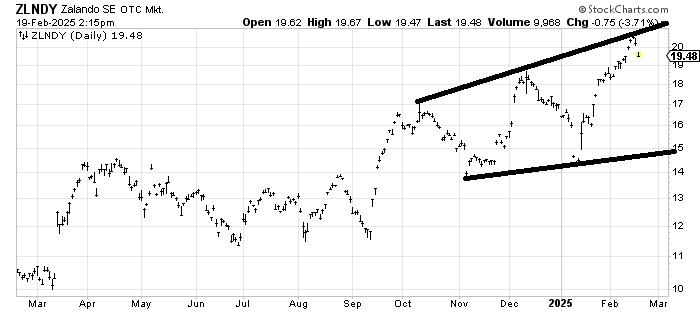
Zalando ZLNDY trades by appointment it is so thin. I’m not even sure I’m confident that the support back at 17 will hold but I would be fairly confident that if it makes its way back to the lower line it would be oversold enough to rally again.
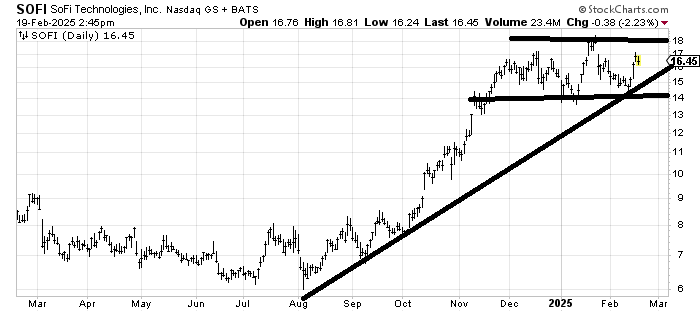
SoFi SOFI is the kind of chart I struggle with. Because I look at it and think, head and shoulders top. But it doesn’t really feel like one up here, it feels more like a stock that has run far since last fall and is now in a giant consolidation period. Near term the gap fill near 18 probably stops it
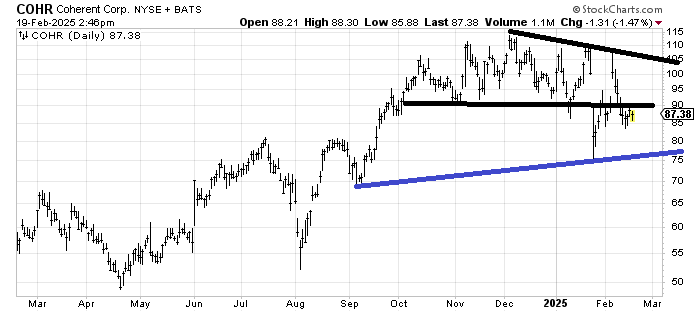
If Coherent COHR cannot recapture 90 in the next few days, then I would say it’s gone into a new trading range between 90 and 75. But if it can recapture it within a few days, I would say that volatility in the last month, between the plunge to 75 and the surge to 108 shook out both sides and so then the stock is just in a very wide trading range with 105 at the top end. The chart does tend toward spikes but any retest of 75 should be buyable.
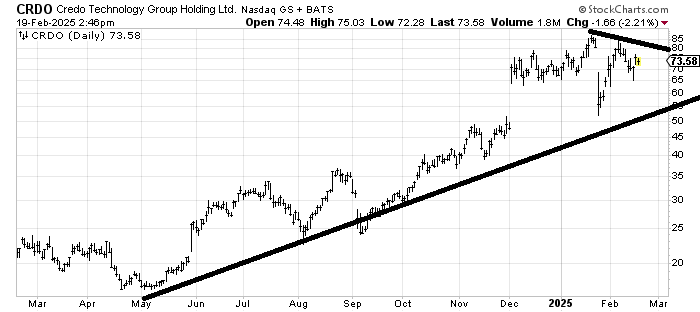
Credo CRDO also looks as if it shook out the weak hands with the plunge in January and then shook out weak shorts with the rise into early February. Now both sides are scared to trade it! At this point I am not sure I would trust either side but if it came down anywhere near 65-ish I would consider that a W/retest of the plunge and therefore buyable as long as it didn’t break that uptrend line.