A Moving Average Lesson with Bearish Repurcussions
Are you panicked? Yeah, neither is anyone else. And that's part of the problem.
You've reached your free article limit
You've read 0 of 1 free Pro articles.
The Market
Today felt like the selling took place in the first hour of trading, and then that was that. We sat there all day after that. That means no panic. Again. It’s where we have been for more than a week.
It also means there was very little change in the indicators or the charts.
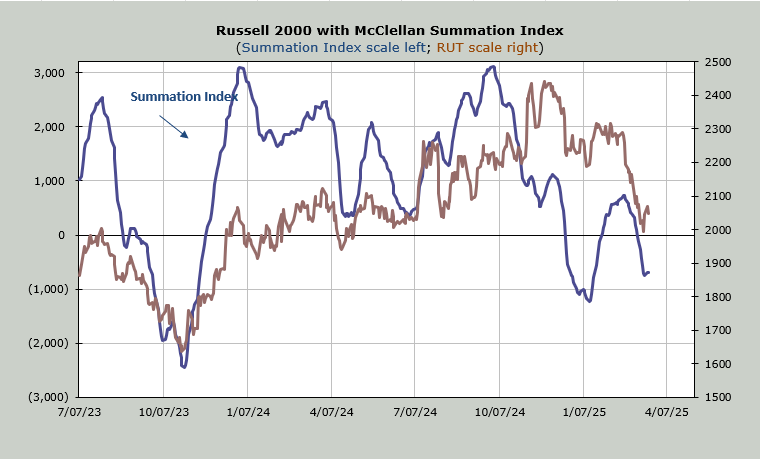
Breadth was negative but not as bad as it could have been. But it hasn’t helped the McClellan Summation Index turn upward. You will see the chart down below. Don’t be fooled by what looks to be an upturn; it’s really more of a flat/sideways move. The market needs another day of positive breadth to turn that upward.
But the number of stocks making new lows did not expand. We’re still looking at far fewer new lows than we had on March 4th for both the NYSE and Nasdaq.
And I do wish I could tell you sentiment was bearish today, but it felt to me as if those who are bearish stayed that way and those who are bullish stayed that way. The most problematic aspect of sentiment is that the put/call ratio, which had been at least over .90 for nearly ten days, sunk back down and now resides at .78.
Are folks expecting the FOMC tomorrow to be market-friendly? I don’t know, but I would much prefer to see a high put/call ratio on a down day if I am bullish.
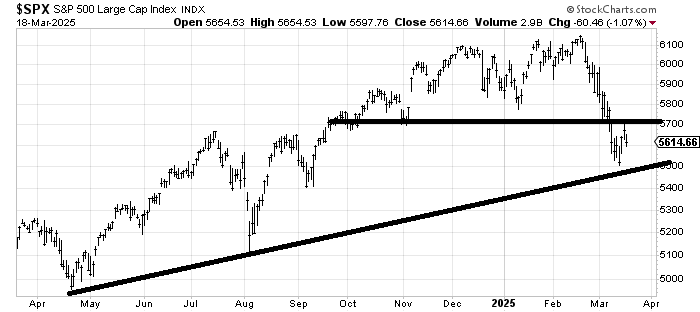
In any event we remain gridlocked between support near 5500 and resistance at 5700. The longer time we spend under 5700, the more bearish the market becomes overall. Let me explain.
The 50-day moving average is already rolling over. A moving average that is heading down acts as resistance. A moving average that is rising is easier to get through. Two hundred trading days ago was early June. If you look at the chart of the S&P, you can see that in early June, it was trading around 5300.
If you replace 5300 with the current 5600 the moving average is still rising. For the next few months, the longer-term moving average line will not be in serious jeopardy of rolling over as long as the S&P stays over this 5500-ish area. Three months from now, the moving average will be dropping that breakout over 5600 from September. That’s when the moving average would start dropping higher numbers and replace them with lower ones. And that is how the moving average line rolls over.
New Ideas
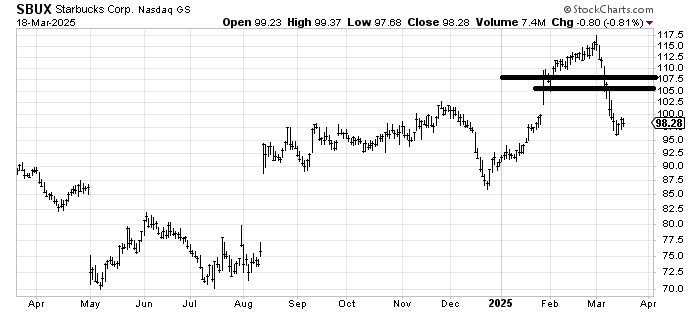
When Starbucks SBUX was up at 115 recently, I said I would sell it. It has since come down and is trying to rally or at least stabilize. If it can rally back to that 105-107 area, I’d sell it there.
Today’s Indicator
The McClellan Summation Index is discussed above.
Q&A/Reader’s Feedback
Helene welcomes your questions about Top Stocks and her charting strategy and techniques. Please send an email directly to Helene with your questions. However, please remember that TheStreet.com Top Stocks is not intended to provide personalized investment advice. Email Helene here.
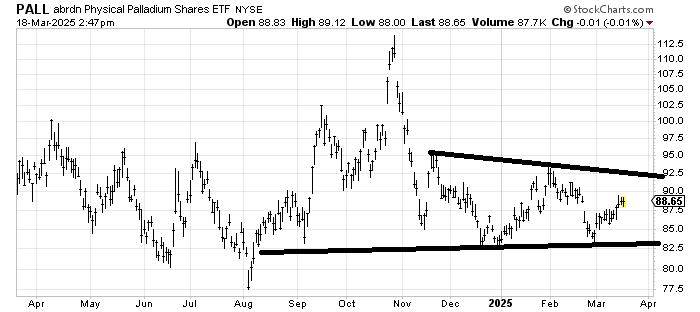
A while back, I said I was interested in PALL, an ETF to be long Palladium, and I was asked if I am still. Yes, I am. It’s still trying to build a base. Unless/until it can get itself up and over that 92.50 area, the base building goes on. I will obviously be wrong under 82.50, but I would really like to see this scoot up to resistance and let us see what’s up there.
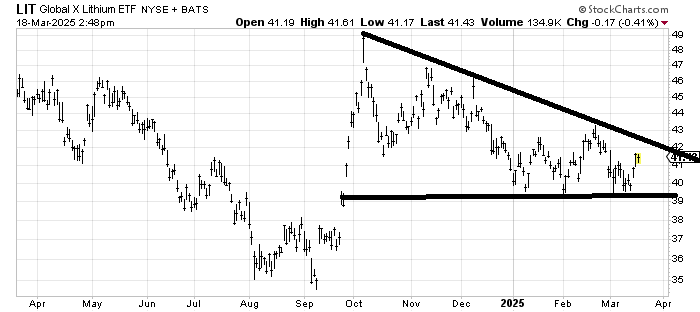
I was asked the same question about LIT, an ETF to be long Lithium because this too appeals to my base building sense. 43 is the level it needs to clear because it has already gotten up there once to eat through the resistance, but eating through resistance is like that old joke: how do you eat an elephant? One bite at a time. Patience is required.
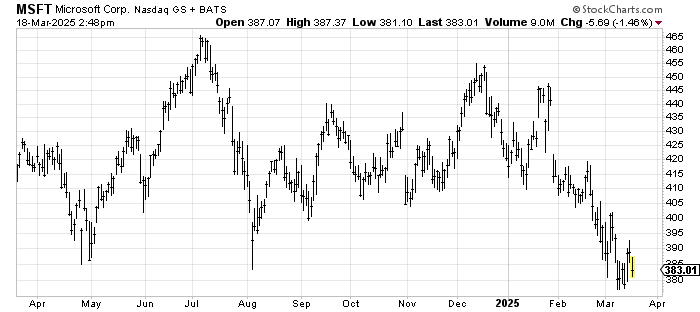
That break on Microsoft MSFT measures to 370 as a first target (there is a longer-term lower target, but let’s deal with what we have right now. The stock got to 378 last week, so it’s close to the target. A rally to resistance around 405 would be a good place to sell some.