A Market Stuck in Purgatory While an Indicator Tries to Turn Upwards
Today was a nothinburger. So, let's answer your questions and check in on dividend-paying stocks.
You've reached your free article limit
You've read 0 of 1 free Pro articles.
The Market
After the action over the last few weeks, today’s nothingburger was welcome. The problem with it is that the charts continue to show the same thing. There is very little discerning between one stock or the other.
Almost all stocks sit at resistance, and each day, we try and eat through and have little success. I could point out that the Russell 2000 had its first three-day green streak since January but again, the move was so lethargic it seems absurd to fuss.
Yet the S&P was red while breadth was green. And we had the lowest volume for the NYSE since April 2nd. For Nasdaq, it was the lowest since March 28th.
Here’s the real issue: we looked at the IGV the other day. I noted that so few stocks had managed to get to resistance, let alone into it yet IGV had. And while it has been up for the last two days now, it hasn’t made a whit of progress.
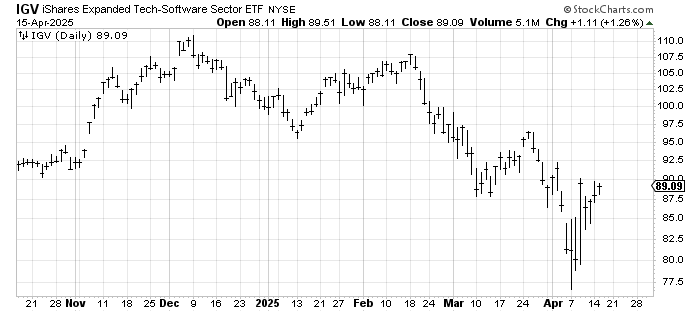
So doing well still doesn’t get you much. The market remains trapped in purgatory. I still think a pullback on Wednesday gives us another lift in the market but chewing through this resistance is proving difficult.
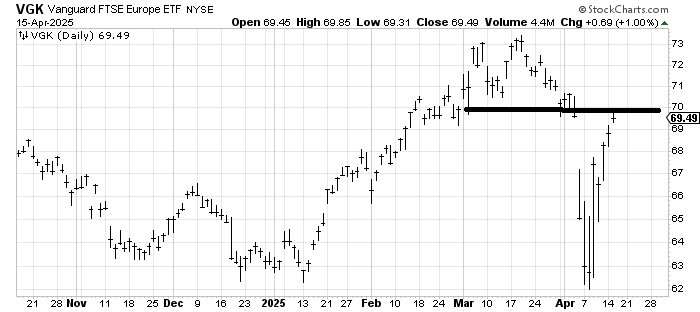
One chart that has had no trouble rebounding is VGK, an ETF to be long Europe. It is now filling the gap, but look at how last Wednesday’s high of 67.50 was surpassed without a hitch whereas the US indexes are mostly still under that surge.
New Ideas
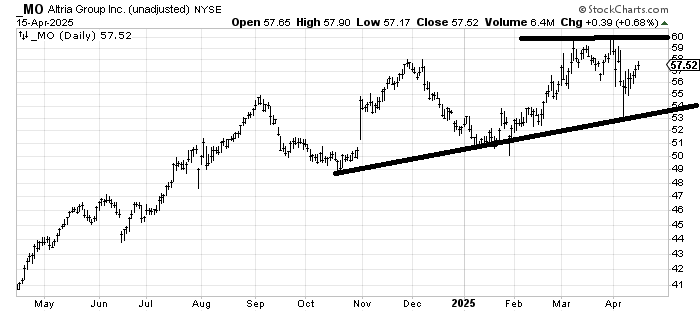
I was asked to look at some of the high dividend-paying stocks, so I’ll start today with Verizon and Altria since they have very different charts than say Pfizer and UPS. I’ll try and sort through these high yielding stocks in the coming days. If you have any in particular, please don’t hesitate to ask.
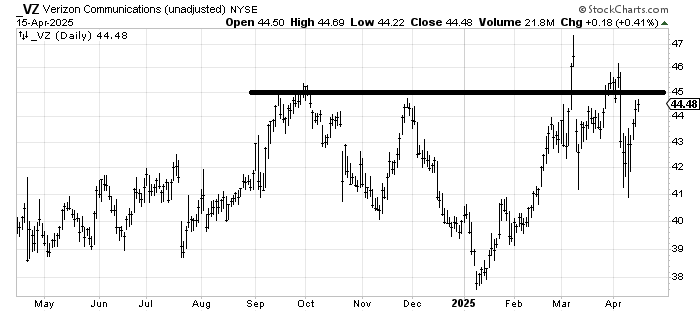
We looked at Verizon a few months ago, and I thought this 45-ish area was resistance. It still is. And that spike high at 47+ is going to be problematic. My inclination is that the stock should, over the next several months, work its way to the 50-52 area. But it is going to take some work.
Altria MO is in an uptrend, but here too, the near term has resistance at 60. I would note that while the stock hasn’t done anything wrong, there is a measured target around 56-60 so it is already at the target.
Today’s Indicator
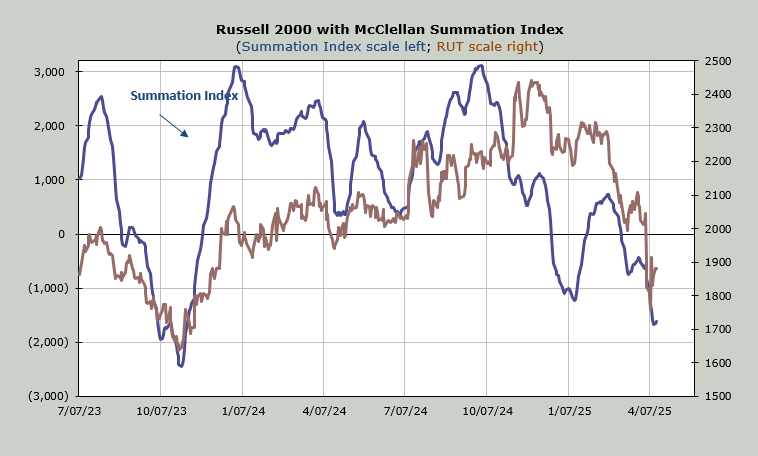
The McClellan Summation Index stopped going down. It’s trying to turn upward. A net negative of -500 advancers minus decliners on the NYSE will turn it right back down, though.
Q&A/Reader’s Feedback
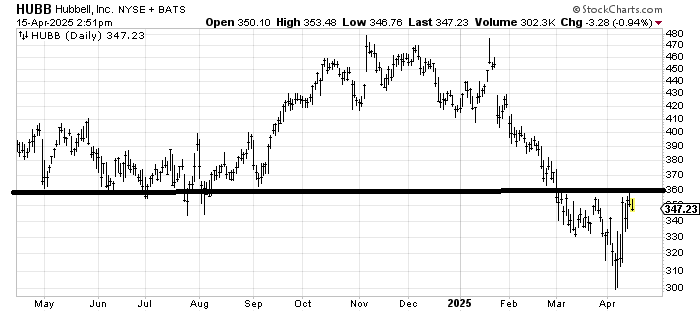
In the big picture, Hubbell HUBB has an awful lot of resistance in this 360 area. It is possible that we see it pull back into that 330 area, and it forms a small head and shoulders bottom but market conditions would have to change drastically because that resistance is formidable. For now, watch that 330-340 area on the pullback. Perhaps there is a trade in it.
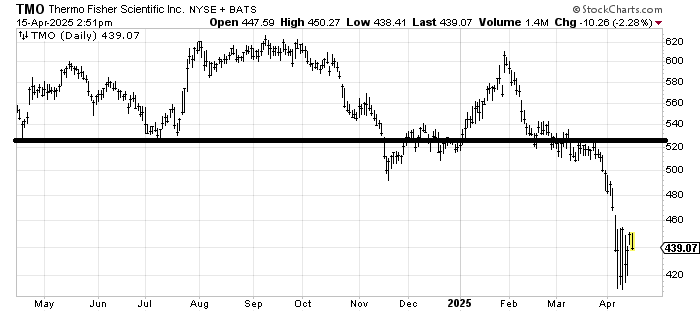
The only good news I have for the chart of Thermo Fisher TMO is that 420 was a measured target. But there is no base, and it hasn’t even been able to fill that gap at 465 yet. For the time being, I’d say a rally—if it shows up—in the 470-480 area is where to sell it.
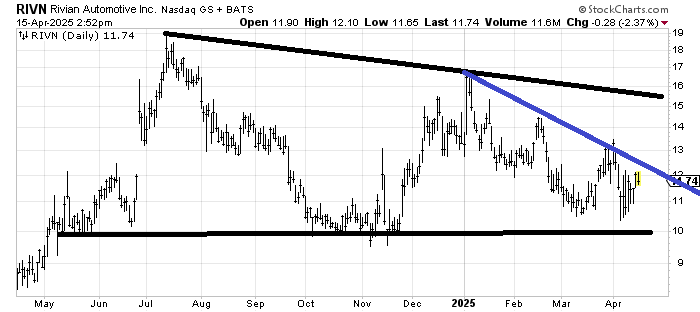
I am intrigued with the chart of Rivian RIVN in that it hasn’t made a lower low. If the chart is going to shape up into something more than intriguing, it will have to cross that blue line and then come down and retest it (over weeks/months), so it is worth keeping an eye on. Right here today though, it is a coin toss.