A Market as Clear as Mud
Let's sift through the mud for clues on what's going on, with check-ins on volume, sentiment and put/call ratios. Plus 'breathtaking' moves in two stocks demand a look, Disney and more.
You've reached your free article limit
You've read 0 of 1 free Pro articles.
The Market
We have a trend in place this week: every other day. Up/down/up/down which I suppose means Thursday should see the S&P 500 green (top analysis there!). The truth is that despite all those intermediate-term indicators getting oversold in mid-January and sentiment getting bearish, the market hasn’t gone anywhere in three months.
All we have on almost every index or group is these wide ranges. We’ve seen it in the SOX for seven months. We’ve seen it in the bonds for two years. Now we’ve seen it in the S&P and Nasdaq since November.
Everything rallies to resistance, sometimes it peeks its head up and over and then falls back into the range. When they get to the bottom of the range, they peek outside and then rally (see Apple AAPL).
I thought that would change since we had gotten so oversold a few weeks ago. But thus far it has not. And Wednesday was no different. The short-term overbought condition has led to a chopfest. We’ve got the S&P down three of the last four trading days so that’s how we’re working it off so far.
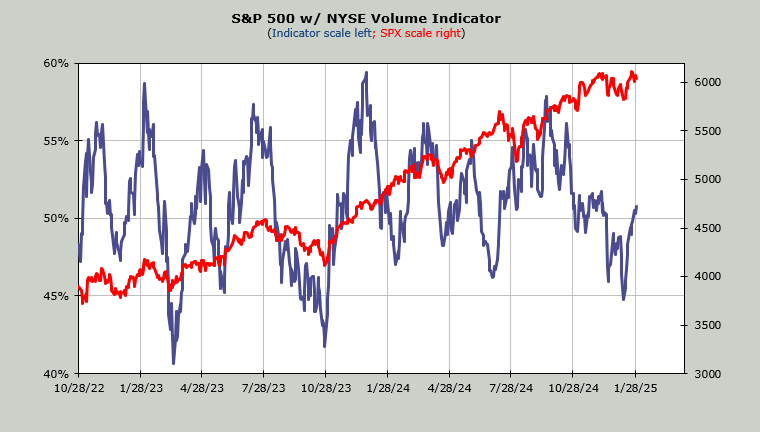
The intermediate term is not yet overbought. You can see the Volume Indicator below; it now resides at 51%. In the mid-50s it gets overbought. I anticipate it will get there midweek next week (early February).
Even sentiment is mixed. The Investors Intelligence bulls notched up another two so they haven’t even gotten back to 50%; they sit at 47.5%. I don’t expect after the week we’ve had that the AAII day traders will have decided to be bullish.
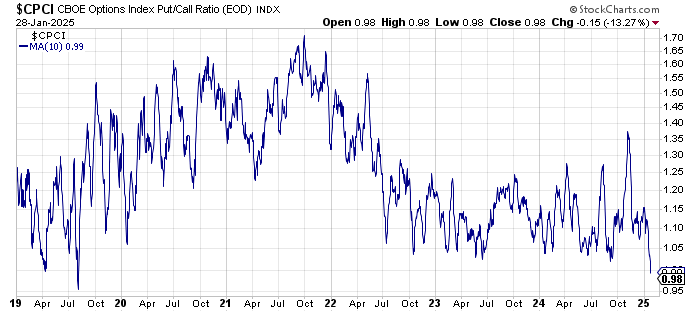
But we do have the 10-day moving average of the put/call ratio at 0.78, the lowest reading since November 2022 when it got to 0.74. And we also have the 10-day moving average of the index put/call ratio at the lowest level since July of 2019. That’s a long time ago.
If you are wondering if we got a pullback in July 2019 we did. The S&P fell 200 points (about 7%) in a matter of days.
Heck, even the Fed left things clear as mud.
New Ideas
I know everyone is much more concerned about the big tech stocks than so many others but there were two earnings reports, or lack of earnings/outlooks, that I want to highlight because the moves in the stocks are breathtaking.
An old friend of ours, Packaging Corp of America PKG was down nearly 10% Wednesday and no one seemed to notice or care. This is a pretty economically sensitive stock. Think of all that stuff you order to be delivered, it has to be wrapped in something!
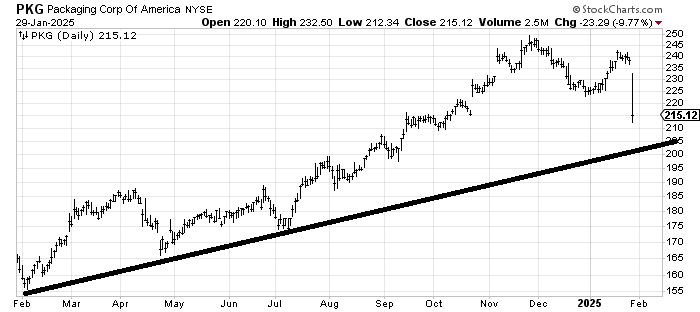
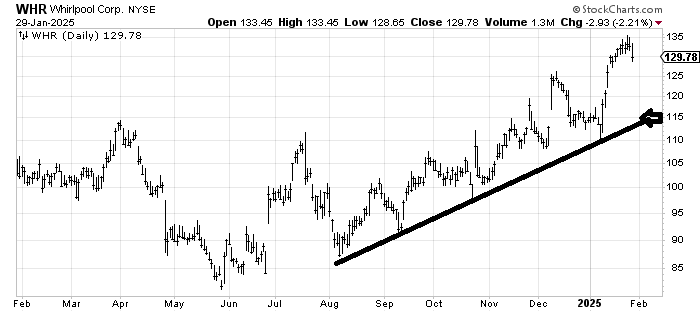
After hours, Whirlpool WHR lowered their numbers for the rest of the year and the stock is down just over 10% (arrow on the chart). In both cases, the stocks have not broken their uptrend lines but these are two companies that make "stuff" who are telling us 2025 is not shaping up great for them. I thought you should be aware.
Today’s Indicator
The Volume Indicator is discussed above.
Q&A/Reader’s Feedback
Helene welcomes your questions about Top Stocks and her charting strategy and techniques. Please send an email directly to Helene with your questions. However, please remember that TheStreet.com Top Stocks is not intended to provide personalized investment advice. Email Helene here.
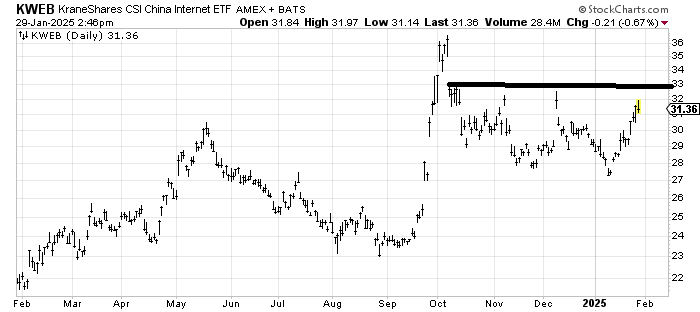
KraneShares CSI China Internet KWEB, an ETF to be long Chinese internet stocks, continues to base each time it gets down into that $27-29 area. Currently there is resistance at $33 that is quite strong so I’d like to see a pullback in order to give it some oomph to get through it. Short term, the range is still $27-33 but I think it is basing.
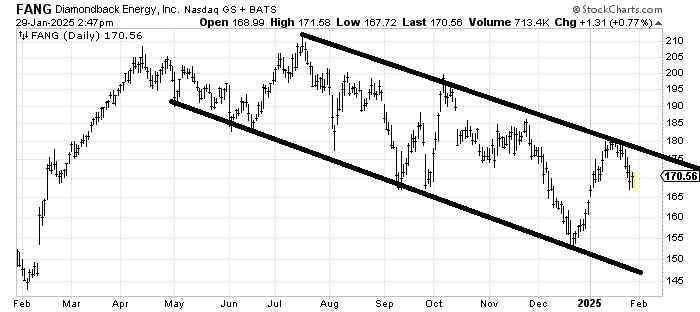
Diamondback Energy FANG has been in a channel since spring of last year so unless/until that changes I see no reason to trade it any differently. The first sign that it could break out on the upside would be seen if it can’t make it down to the lower line on this trip and instead turns upward and through the top line. That would be a big change and bullish.
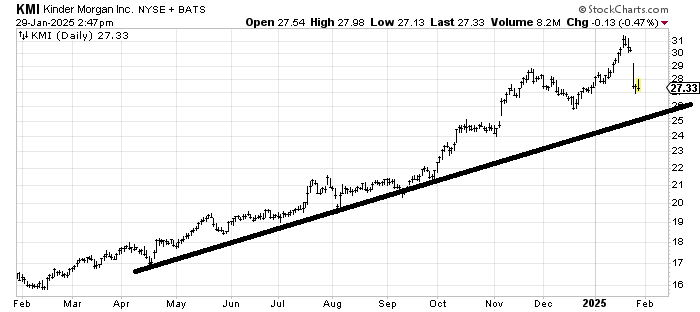
Kinder Morgan KMI is not my kind of chart because it is up so much already. However, it hasn’t done much wrong. Sure, that gap down the other day is not good, but what if it comes down to $26-ish (prior low and uptrend line) and the selling dries up? Then this will just look like a correction. So that’s the spot to focus on: that $26 area.
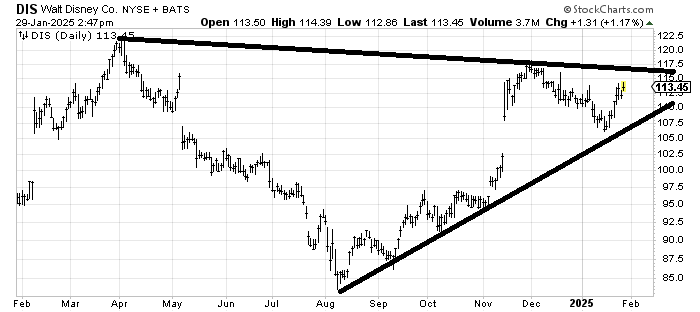
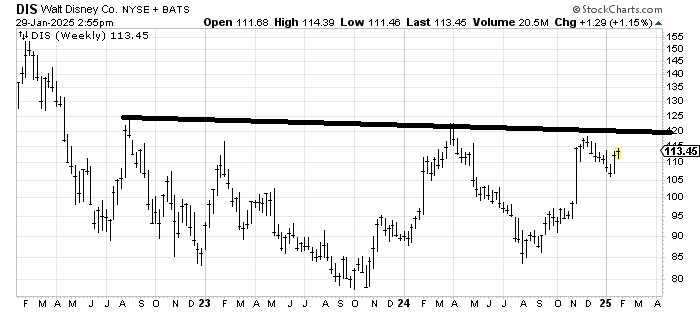
In the near term, Disney DIS has resistance in the $118-120 area that I would expect to be a problem. But then I look at the long-term (3-year) chart (second chart below) and think a breakout over $120 would be terrific. So for the time being I’d call it a hold but use a stop, which is far away under $100-ish because that gap fill around $102-103 could still be in the cards. It depends on your time frame.
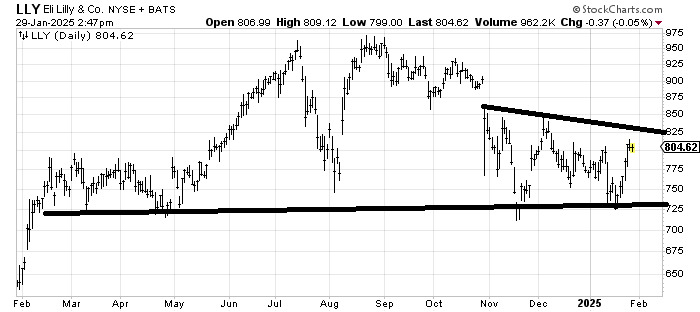
Eli Lilly LLY might be trying to bottom. I’d love to see it get up and over $825 and I do not want to see it under $725. A dip to $750-775 that holds there would make it more interesting because that would be a higher low.