A Key Indicator Shows the Direction of Most Stocks and It's Pointing Downwards Now
Let's look at this breadth indicator and answer your questions.
You've reached your free article limit
You've read 0 of 1 free Pro articles.
The Market
So that’s what a down day looks like! Was it awful? It looked standard to me.
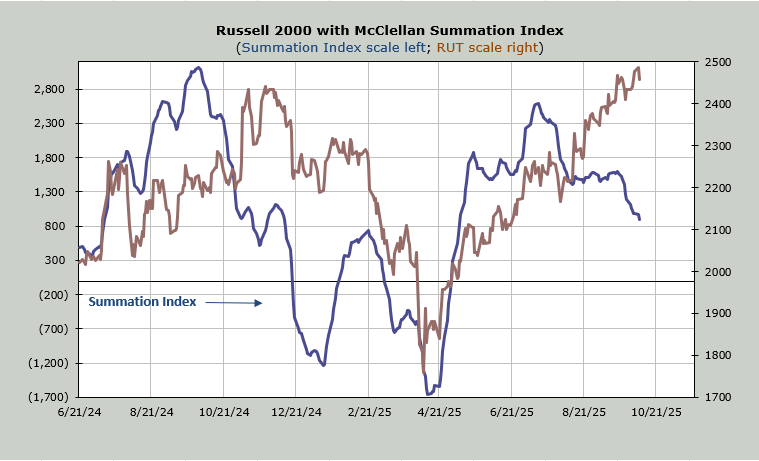
There are a few things I would highlight, though. The McClellan Summation Index has gone from sideways to definitely down. It has always been my view that it tells us the direction of the majority of stocks. The chart is shown below.
Sure, some of the speculative names pulled back quite a bit, and some kept going. But one thing I want to point out that relates to the chart we looked at last night regarding the quality stocks relative to the S&P. I went through the ten largest S&P stocks today. Not one made a new high yesterday. Well, okay, maybe an intraday new high was eked out (questionable), but when the S&P makes a new high and the so-called leadership does not, you have to ask where is the leadership?
Lately, the leadership has been metals (XME) and a bunch of small technology stocks. We all wanted the market to spread out from the Mag 7, but it has spread to speculative stocks, not to the majority of stocks (see the Summation Index).
I would also note that the last five days, the S&P has closed at pretty much the same price with the exception of yesterday. Is that the market resting before another push up, or is that distribution? I wish I knew. We got a little volatility today, but I think we’ll know a lot more in the next few days as we see if some of those down and out Mag 7 names can get a lift (like (AMZN) and (META) ).
I would love to get a proper correction, it just seems like we can’t seem to get one.
New Ideas
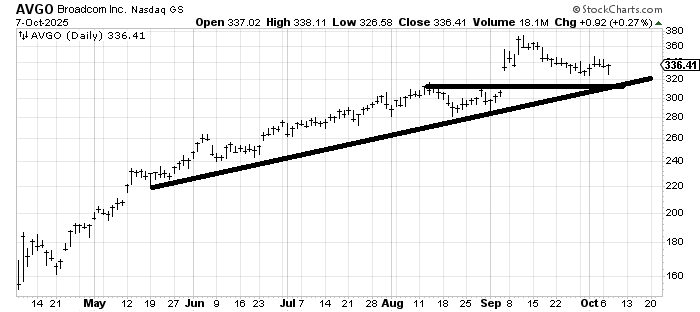
I was asked about Broadcom (AVGO) a few weeks ago, so I want to follow up. I would love to see it fill that gap in that 315-320 area since there is a lot of support there, but unless/until that level breaks, this looks like just a correction.
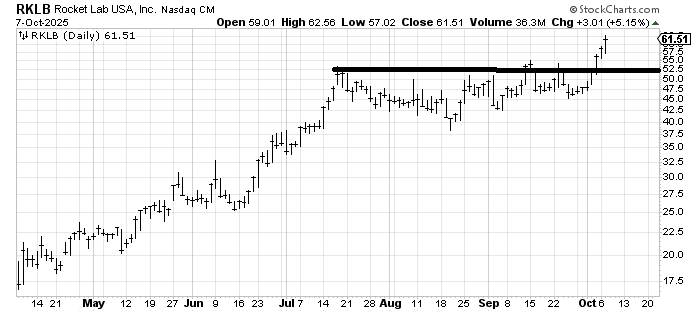
In late August, I recommended Rocket Lab (RKLB) , which took quite a while to get going, but it finally has. The measured target for this run is around 62-65.
Today’s Indicator
The McClellan Summation Index is discussed in full above.
Q&A/Reader’s Feedback
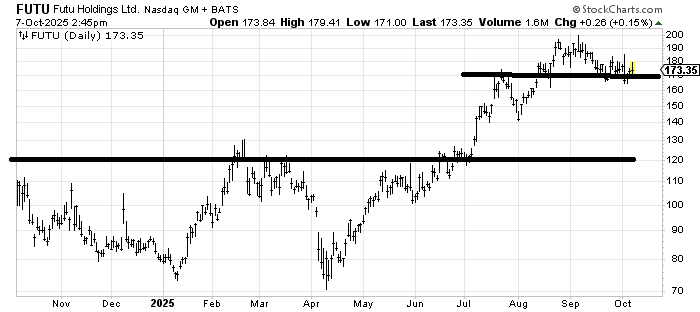
Futu Holdings (FUTU) has gotten sloppy (like many stocks). Notice it is trading where it was in July. The measured target was around 170, so it got there, corrected, and then spurted upwards, only to fall right back there. I would get concerned if it breaks that early October low; otherwise, maybe it just needs more sideways time having hit the target.
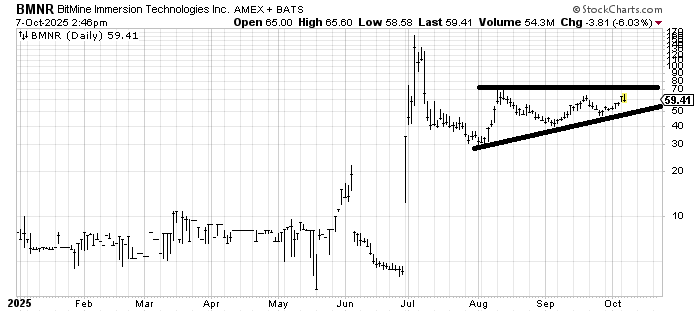
I am generally not a fan of Bitcoin and all the related crypto nonsense, but if asked, I will comment. Also, when I want to get involved in crypto, I tend to trade Coinbase (COIN) , which has been a good trading vehicle for us. With that as background, BitMine Immersion technologies (BMNR) looks like it was a SPAC, then it became a meme stock, and now it’s rather ordinary. Resistance is at 70-ish for now. I would however, question a crypto stock that couldn’t get over the September high when Bitcoin just made a new high.
(as a reminder, COIN filled that gap, as noted here Sunday, thus hitting a ‘next’ target).
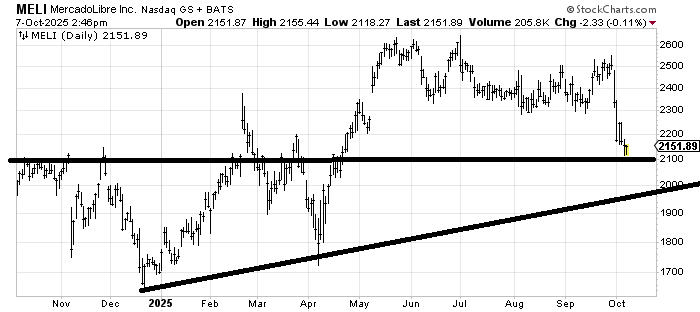
That break in MercadoLibre (MELI) has some support here at 2100, but the top measures to 2000, which is where that uptrend line comes in. Perhaps it holds here, but I’m inclined to think it bounces and comes down one more time. At 2000, I’d have a look at it.
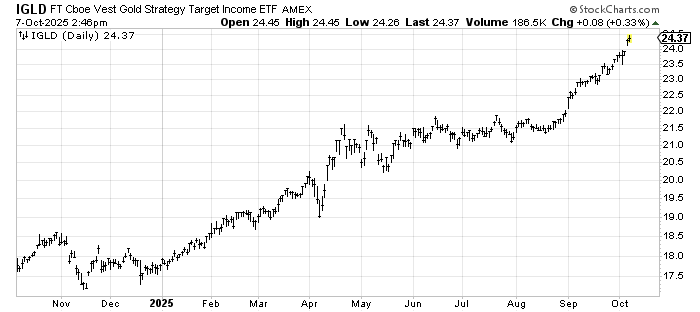
You can call it (GLD) or you can call it IGLD, it’s all the same chart, and my view won’t change. I think gold is fine; it has done nothing wrong, but I do not chase parabolic anything, be it stocks or commodities. Thus, I think it needs a correction.
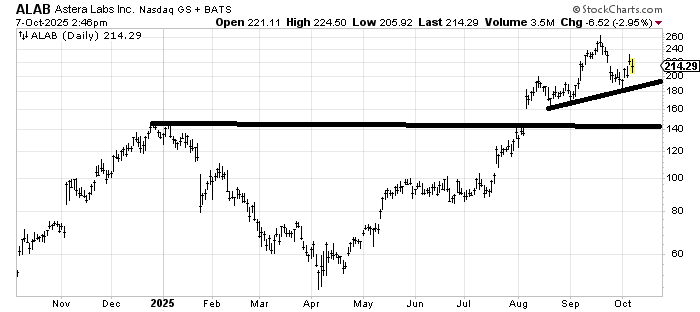
Astera Labs (ALAB) had a measured target around 220. It exceeded it but came right back down to it. So far, it has higher lows, so it hasn’t done anything wrong. If it breaks that short-term uptrend line, I’d get concerned. Mostly, it probably needs to develop a new pattern again.
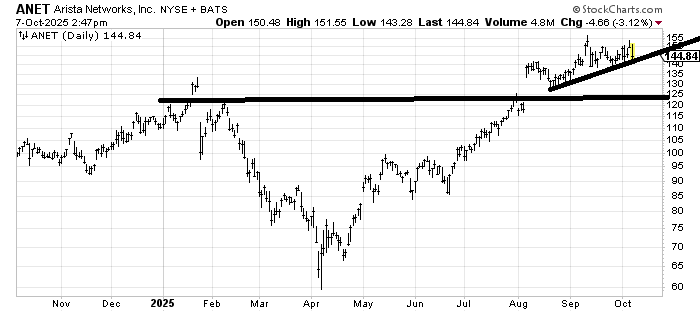
Arista Networks (ANET) has a measured target near 180, but here too is another (non-speculative?) name that hasn't done much in two months. I would prefer if it doesn’t break that uptrend line. It’s not the end of the world if it does, but it would measure back to the 125-130 area if it does.
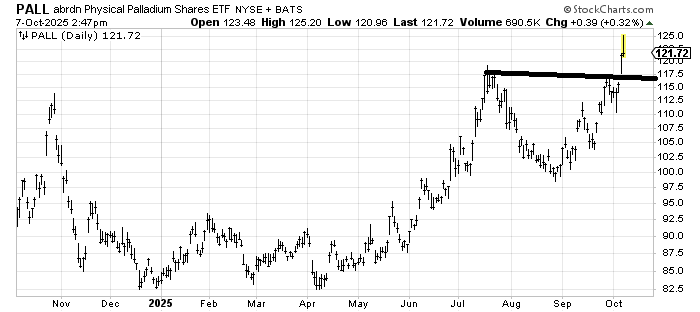
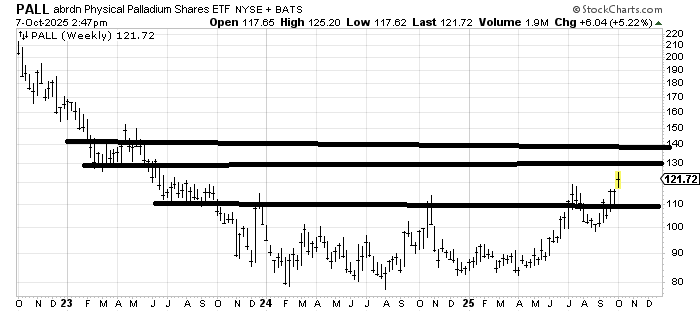
Short term I think (PALL) , an ETF to be long Palladium, is over-extended. If you don’t have patience for volatility or if you want to trade it (i.e., you bought it when I recommended it near 100 recently), then I’d take a little off the table here. But that weekly chart continues to look like a base that has a next measured target around 130-140. I will get longer-term concerned when/if the DSI gets to 90. It is currently 66.
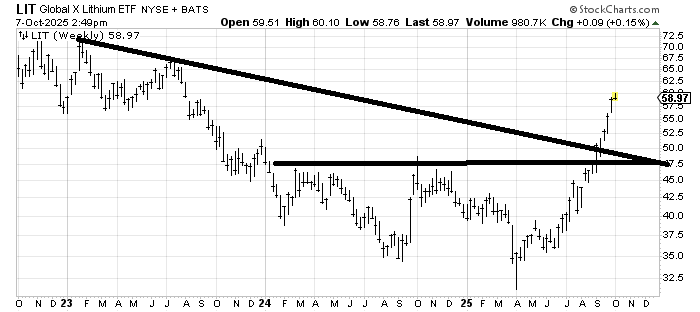
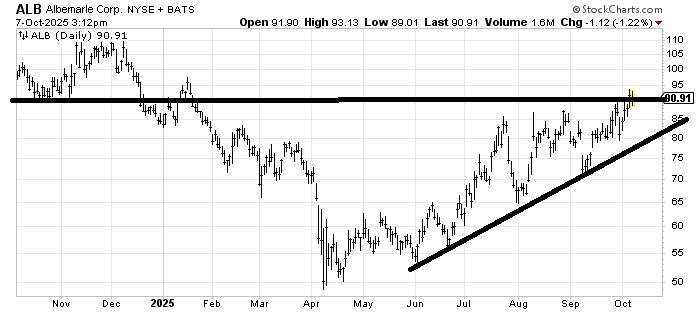
Albermarle (ALB) is trying to base so as long as it stays over 75, it should be fine. I have been using LIT, the ETF, to be long them. LIT is currently overextended on the weekly chart and in need of a dip.
Helene welcomes your questions about Top Stocks and her charting strategy and techniques. Please send an email directly to Helene with your questions. However, please remember that TheStreet.com Top Stocks is not intended to provide personalized investment advice. Email Helene here.
