A Golden Change in the Market
Let's look at the yellow metal as well as review some earlier picks this year.
You've reached your free article limit
You've read 0 of 1 free Pro articles.
The Market
This week has been marked by a minor change. Perhaps a major one.
The fact that gold and the metals and quantum stocks and uranium and basically all the hot stocks of the last six weeks have come back down to earth signals a change to me.
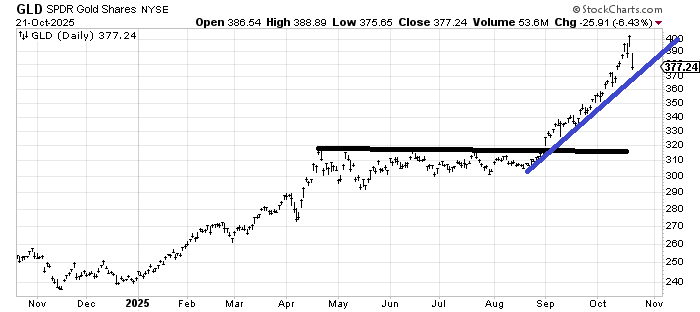
Let me answer a question I seem to be getting on a daily basis: I am not a buyer of gold/GLD. There is no particular price I would be a buyer of (GLD) either. Will it bounce off that very steep blue line (call it 365-370)? I think it is likely.
This run in GLD has been far more relentless than any of the other GLD rallies in 2025. Take a look at the February peak and notice how it went sideways for nearly a month before heading up again. However, more recently, that peak in April gave way to four to five months of sideways action. I even recommended GLD at 310 back in late August. Why? Because it had spent so much time basing and consolidating.
Now I believe GLD will have to correct an awful lot or set up another big base as it had heading into September. I did not know in April that 310 would be the price. The price is a result of the pattern. So, until there is a pattern in GLD, I am not a buyer. I believe there needs to be a big shakeout there. I’d be taking something off the table, but I have been saying that since GLD was 340-350.
Then there are the quantum stocks and the space stocks and uranium and nuclear, etc. They may find some friends again and rally, but parabolic stocks are never my cup of tea. Let them come down and form another base, and I’ll gladly look at them again. But not now.
So, all we got today was another bout of group rotation.
New Ideas
I am going to do a few follow-ups again.
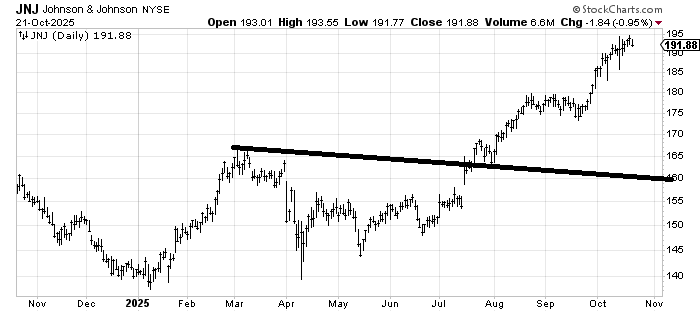
Last spring, I recommended Johnson and Johnson (JNJ) , and it has had a nice run. The stock has done nothing wrong, but there is a measured target in this 190-195 area. It’s not a bad idea to take a little off the table or at least anticipate a correction in the coming weeks.
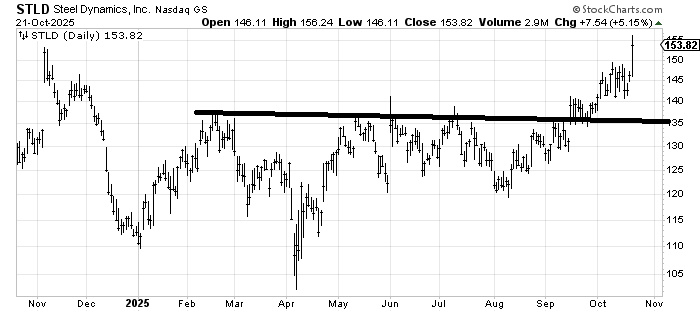
Last spring, I was asked about the steel stocks, and my favorite of the three we looked at was Steel Dynamics (STLD) , which, up until recently, had been a pretty poor choice. There is a next measured target in the 155-160 area.
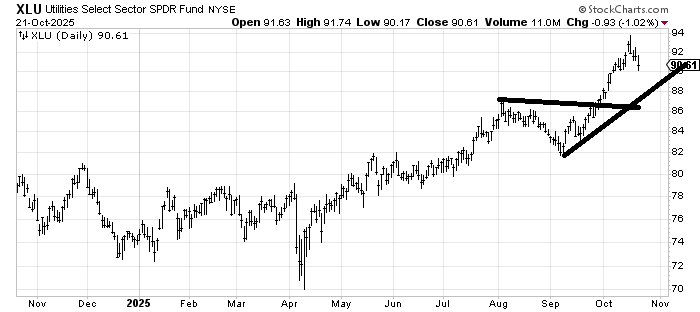
Last week, I said I thought the Utes were vulnerable, and now, along with the other hot trades over the last six weeks, the Utes have come down. Here, too, I need a pattern to set up for me to like them again. I am eyeing something down in the 86-88 area as the next spot, but that ought to be just a bounce. I will wait for the pattern again.
Today’s Indicator
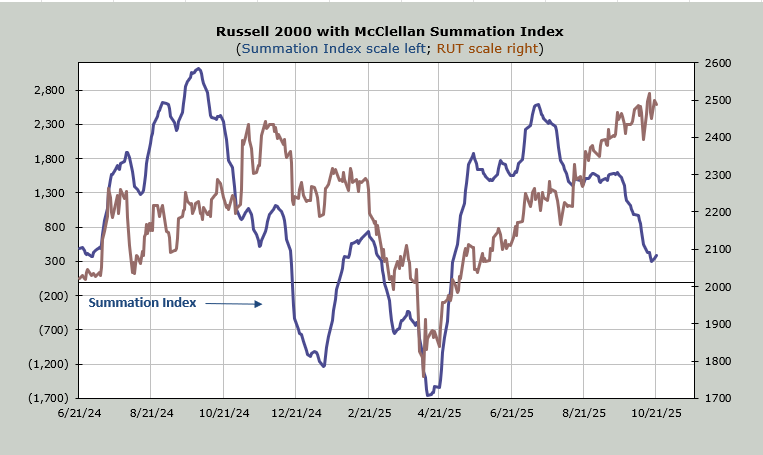
The McClellan Summation Index stopped going down! This is the first time in over a month. It won’t take much to turn it back down (a net differential of -900 advancers minus decliners on the NYSE), but this would be a welcome change if it sticks.
Q&A/Reader’s Feedback
Helene welcomes your questions about Top Stocks and her charting strategy and techniques. Please send an email directly to Helene with your questions. However, please remember that TheStreet.com Top Stocks is not intended to provide personalized investment advice. Email Helene here.
If I did not get to one of your names today, I will get to it tomorrow. The list is long—and I like that!
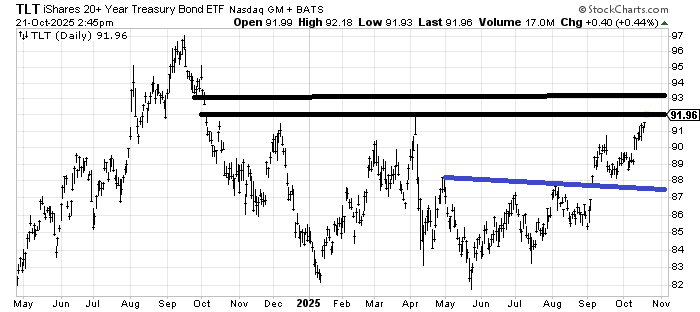
I was asked to update my view on (TLT) . It has not changed. That 92-93 area continues to be my target for the time being. That doesn’t make me bearish on it here. On the contrary, I still think bonds are okay I just think this is a resistance area and I cannot chase. There is a possibility that TLT makes it to 94 just to suck everyone back in because that pattern under the blue line (a head and shoulders pattern I drew in at the time) measures to 93-94. I would also point out that the DSI on bonds is in the low 80s, so here too, we see sentiment would get stretched if we got much over these targets.
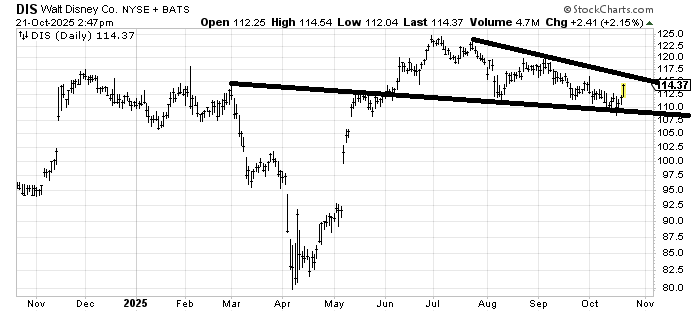
I am inclined to like Disney (DIS) , but I think it will take a lot to eat through resistance. In other words, I can see it getting to 117-118, then backing off again, then up to 120, then backing off again, and so on. So, you might need quite a bit of patience because remember, these group rotations are fits and starts.
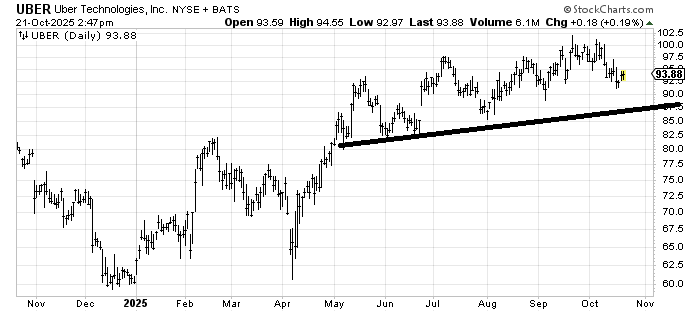
I liked Uber (UBER) for the longest time, and it also took forever for it to make its way to that target of 100, which it achieved about a month ago. Now I would say I have no strong view. I think it has a chance of coming down to tag that uptrend line, or it could just slosh back and forth for a while.
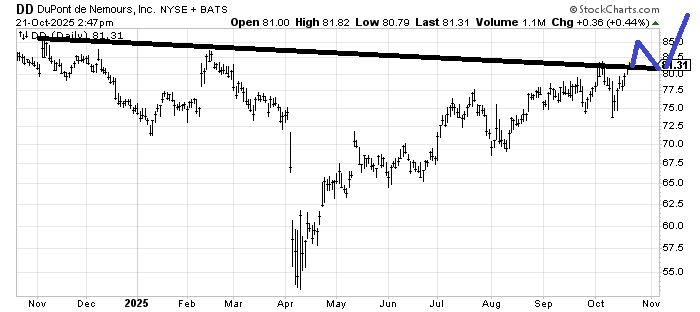
The chart of DuPont (DD) has me intrigued because if we step back, we might consider this a long base in the making. Short term, it is over-extended, so I don’t want to chase it, but I have drawn in blue what would make the chart buyable to me. That means crossing the line (it doesn’t have to go to 85, just cross the line enough to see it) and then pull back and hold that line (call it 80-81) if it can hold on that pullback, I’d be a buyer.
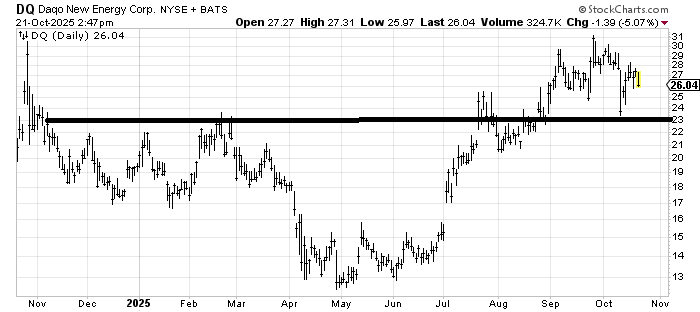
Daqo New Energy (DQ) is not a great chart. It broke out, had a nice run, and then went plop. If it comes back near 23 and can hold, I would take another look at it, but right here I’m inclined to stay away.
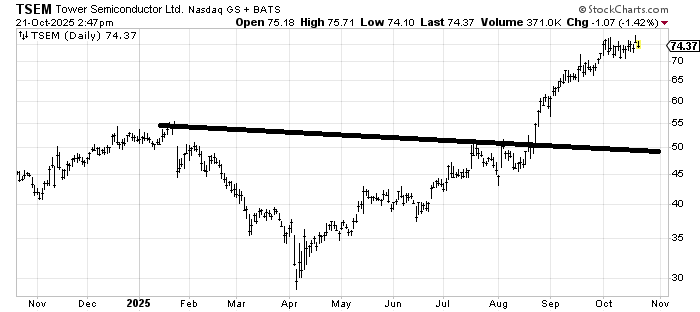
Tower Semiconductor (TSEM) hasn’t done anything wrong, but it has met its measured target. Now it needs to either set up a new pattern or spend a decent amount of time going sideways. I’d be inclined to sell some if it breaks 70.
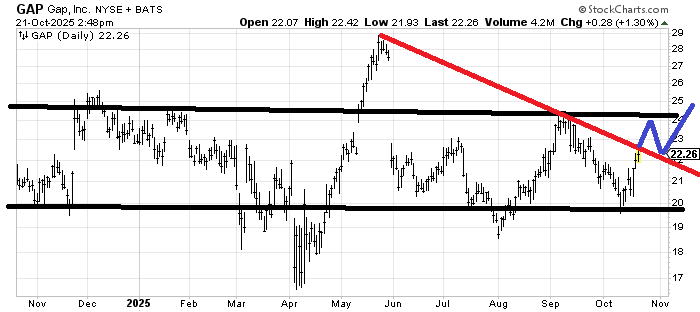
I keep staring at the chart of Gap (GPS) and that long sideways action, wondering if it is building a base or if it will simply continue to bounce back and forth. With the exception of April and May, the chart has been in a four-point trading range for a long time. I’d like to see it cross that red line and then come back and test it as I have drawn in blue. If it can map out like that, it would give me more confidence that it can actually break out. Otherwise, the trading range carries on.
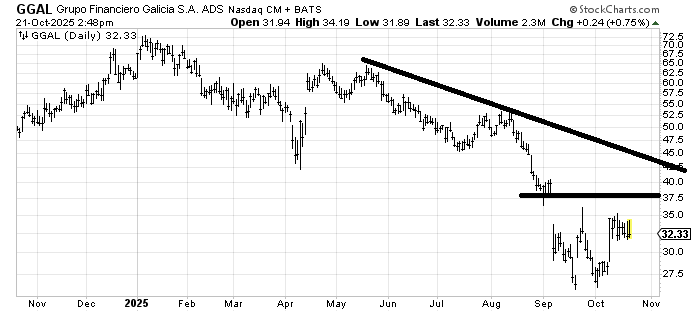
Grupo Financiero (GGAL) is trying to form a bottom, but I think that 37-40 area is going to be a decent roadblock for the time being. I’d like to see this go sideways for at least a few more weeks or months to give me confidence that it can actually eat through all that resistance it left overhead. It’s made some progress by forming that W in the last two months.
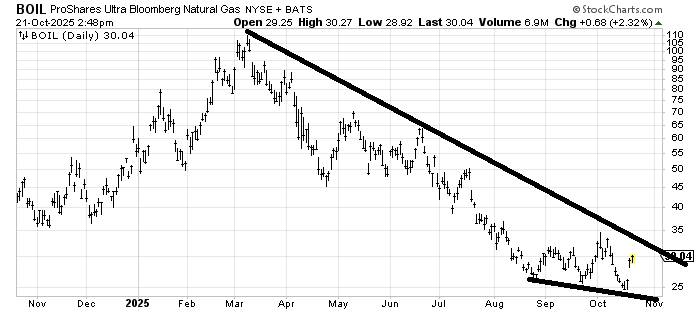
BOIL is an ETF to be long natural gas. I want to love the chart, but I think 35 is going to be difficult to get through. A few months of sideways in this 25-35 area would make the chart much more enticing to me. For now, I’d call it a trading stock. Conceptually, this ought to be a good area (energy)
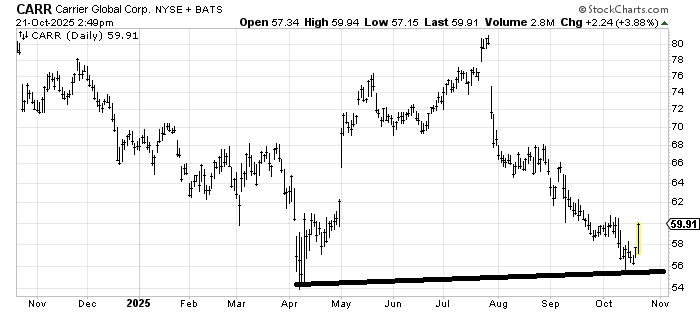
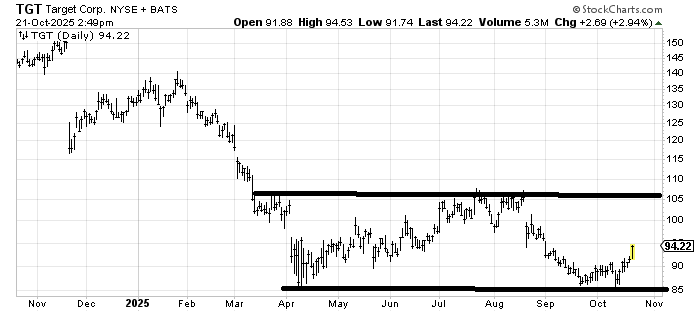
Carrier (CARR) is my kind of chart. It came all the way down to the April lows, held, and rallied. This is quite similar to the chart of Target (TGT) that I recommended a few weeks ago when it did the same.
Here’s the issue: I have no way of calculating a target yet. A pullback in the next few days toward 58.50-ish would form a tiny little head and shoulders bottom that would give a next target near 64.