A Dan Ives Clothing Line Is Not Something You'd See at a Bottom
The analyst has style, but is it one that should go mainstream? Plus, could Bullish be bearish?
You've reached your free article limit
You've read 0 of 1 free Pro articles.
The Market
We’ve all heard the stats. You know, the ones that say the market is the most top-heavy or heavily concentrated it has ever been, with something like 10 stocks accounting for 30%+ of the S&P.
Those who have been around long enough recognize some of the signs that all is not right with the market. The concentration in AI and crypto, the meme stocks coming alive again, the trading in penny stocks to name a few. Or we can go more anecdotal than that, such as a new company—a crypto company—is set to IPO this coming week, and its name is Bullish.
I can even note that well-known perma bull tech analyst Dan Ives, who is known for his brightly colored clothing, now has a deal with a clothing company where you, the average person, can buy his clothing line. These are not things that happen at market lows.
If we want something more statistical, we can see it in the charts of the indicators. The intermediate term reached an overbought condition around Memorial Day. The market went sideways and had another spurt upwards into early July (recall July 3rd was when we saw the DSI on the S&P get to 87).
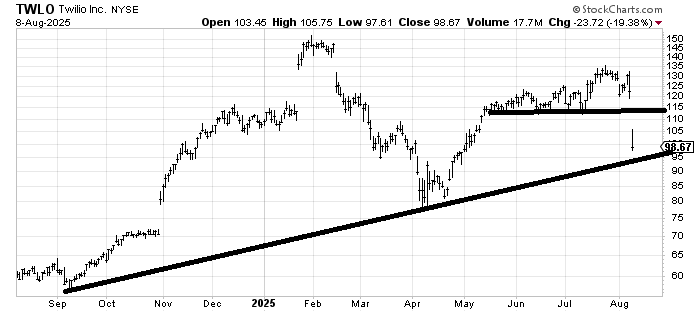
Breadth has begun to lag. The SOX has begun to underperform. The Banks, too. The number of stocks making new highs can’t get out of its own way. Down below, you will see the Hi-Lo Indicator for Nasdaq. You can see the turn down from that intermediate term high in late May (it heads down in early June), but then it revives itself. But now we see the turn down from early July has taken the indicator under the June low.
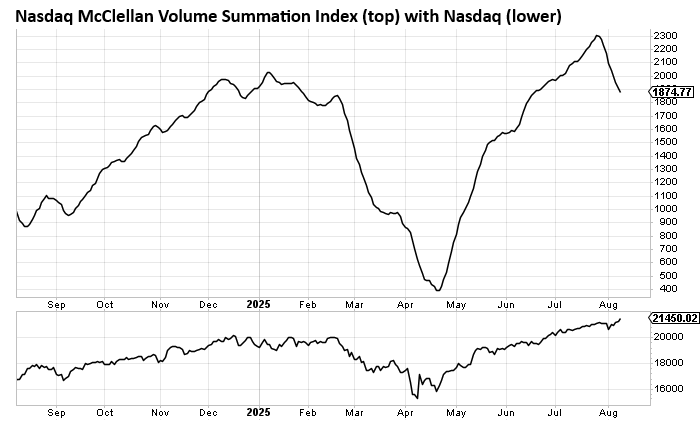
We see it in the Nasdaq McClellan Summation Index (using volume). It turned south two weeks ago, having barely taken a breather from the April low.
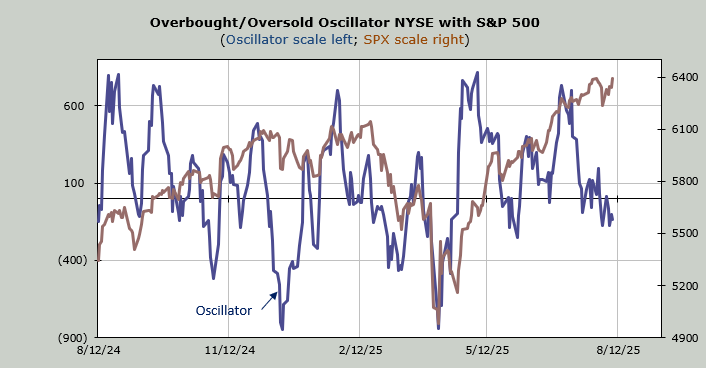
We see it in the Overbought/Oversold Oscillator, which sits below the zero line, having peaked in mid-May and made a lower high in early July. (more on this below)
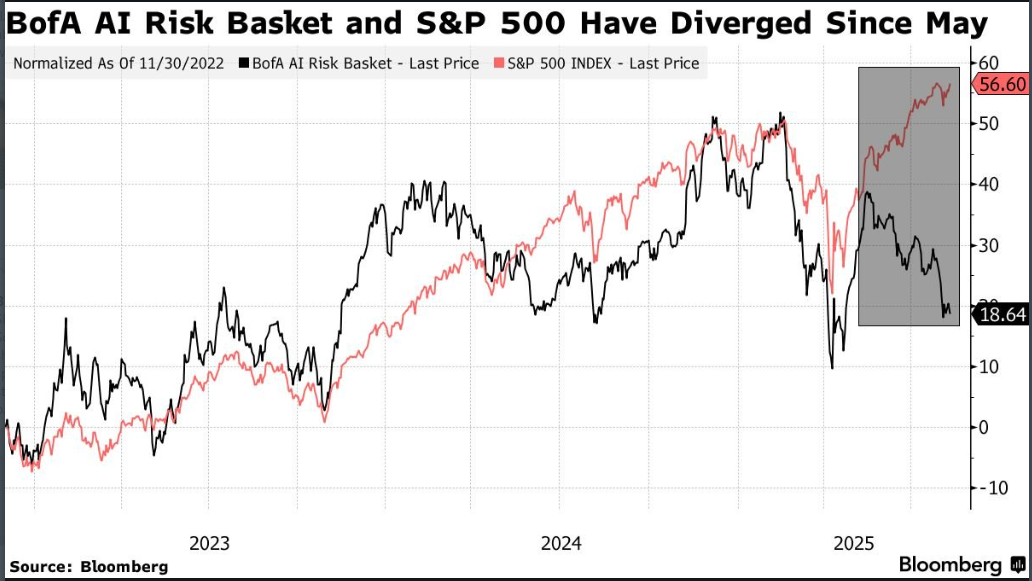
We see it in the gaps down during this recent earnings season. We see it in the fact that the DJIA hasn’t made a higher high. Nor have the Transports. But now I saw a chart that, in my opinion, puts it into a picture that is clear. With the caveat that this is not my chart and I do not know what the input is, I did just list how many of my indicators show the same thing, or something similar.
Bank of America has an AI Risk Basket of stocks. These are names they believe are at risk of struggling as AI takes hold. This chart shows the S&P (red) with this basket, and it highlights the divergence since May.
Yet because the market has been so weak underneath, Nasdaq’s breadth has now been red for nine of the last ten trading days. That’s the sort of thing we tend to see at lows; that’s the sort of thing that makes those stocks that are down so much oversold.
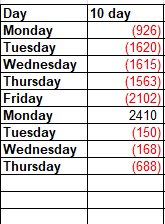
TRIN, an indicator that is an expression of breadth (advance/decline line) and volume (up/down) has been over 1.0 for eleven of the last twelve trading days. While this indicator is not as useful as it once was, a reading over 1.0 indicates more selling than buying. It is now back to where it was in early April. I think we can all agree this market does not feel oversold as it was in early April. Yet that is how much selling has taken place underneath the major indexes.
If we had sold off late last week, I’d think the market can easily rally this week, but now I feel as if we’re in a pickle. Do those that have been left out enjoy a rally, or is this selling under the surface now more systemic? Is it too ingrained? By that I mean bottom fishing in what is out of favor has not been terribly lucrative since early July. Can this short-term ‘oversoldness’ change that? That is the market’s dilemma this coming week.
New Ideas
Above, I note how so many down-and-outers can’t seem to lift themselves. But I also want to point out that back in the May/June timeframe, I highlighted a few stocks that we should keep our eyes on because they were showing some signs of being left out.
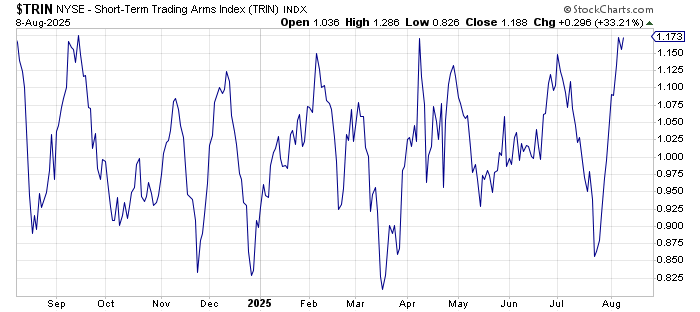
One was Walmart WMT, which sat there for nearly four months before it finally felt better, and I recommended it last week. It has since perked up. But another was Twilio TWLO, which kept threatening to break and couldn’t. Perhaps that rally in July just ran in all the shorts because Friday the stock plunged 20%, blowing right through that support. About the only good news I can share is it has some support around 95.
It's possible stocks like this are in that Bank of America basket I discuss above.
Today’s Indicator
The Hi-Lo Indicator is discussed above.
Q&A/Reader’s Feedback
Helene welcomes your questions about Top Stocks and her charting strategy and techniques. Please send an email directly to Helene with your questions. However, please remember that TheStreet.com Top Stocks is not intended to provide personalized investment advice. Email Helene here.
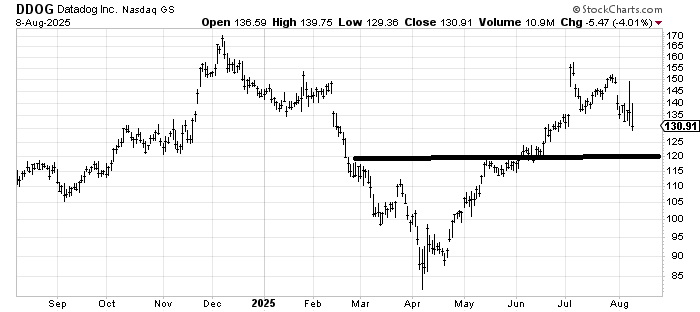
Datadog DDOG had a rally on Thursday that filled the gap left from the late July drop. It’s got some support back around 120. Perhaps the only thing it has going for it is that it has been added to the S&P, so maybe it gets dragged along, but lately that hasn’t been much help.
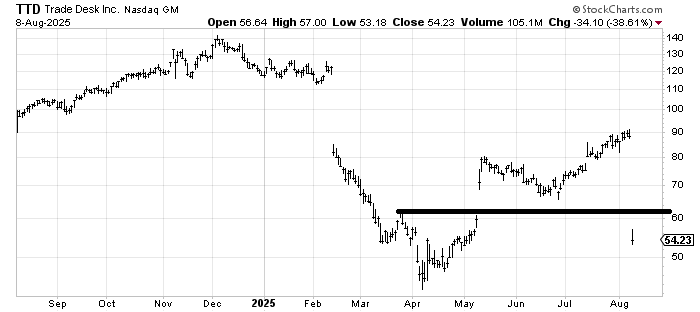
The Trade Desk TTD is another stock like Twilio that just gapped down right under support. This time it left an island overhead (that whole period of trading from May until Friday’s gap). I would use the three-day rule here and look for a bounce around the third day after the gap down. But it now looks like a broken stock that should be sold on a rally in the 60-65 area
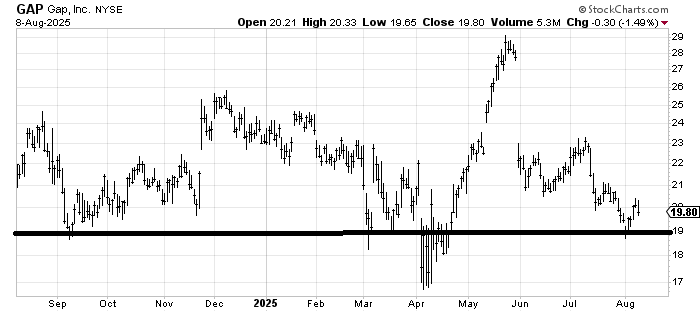
Gap GAP is desperately trying to hold and build a base in this 19 area. The stock has a yield over 3% now! I am tempted to bottom fish it on a pullback near 19 using a stop not far below that, but in the big picture, the chart mostly looks sideways, call it 19-23.
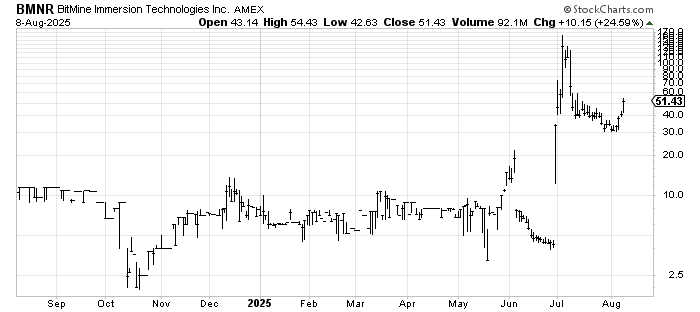
I know nothing about Bitmine Immersion Technologies BMNR, but if I had to guess, it was a SPAC at some point. I am not a fan of chasing a stock that has gone from 30 to 50 in three days, so I will just say that as long as it stays over 40, it gets the benefit of the doubt.
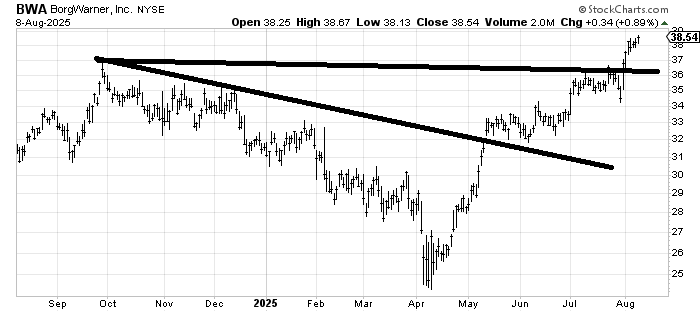
I was reminded that over a year ago, I recommended BorgWarner BWA and was asked for a target. There is a target in the 40-42 area.
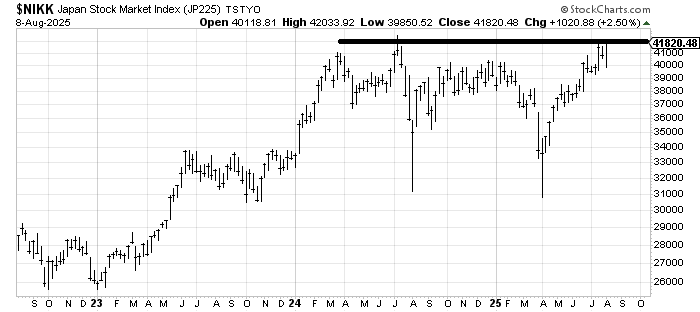
I was asked to look at a weekly, three-year chart of the Nikkei. Not only does it have resistance here in this 41,000 area, but if I took the chart back to 1989-1990, I can tell you the Nikkei bubble burst when it was just shy of 40,000, so this area is quite a big deal. I am not good at chasing what is up already, so I will just note that there is a next target around 44,000, should it get through here. The daily chart looks a bit over-extended.