A Big Rally, But How Much More Upside Can We Expect From It?
Without that whoosh I've been looking for, it's hard to call this the beginning of a new uptrend.
You've reached your free article limit
You've read 0 of 1 free Pro articles.
 NYSE traders
The Market
Note: I am taking a few days off to visit my mother for Passover. Wishing everyone a Happy Passover and a Happy Easter. The next edition will be Monday evening, April 6th.
Well, we clearly did not get the whoosh I so hoped for. But we were oversold, and as I have noted, folks were so very hedged up, and we can see the result in today’s rally. And notice that it did show up in Nasdaq, as it should have.
Breadth was good, but it was not great. In fact, breadth was much better on March 23rd when the S&P was up 74 points on the day. Upside volume clocked in at a very disappointing 77%.
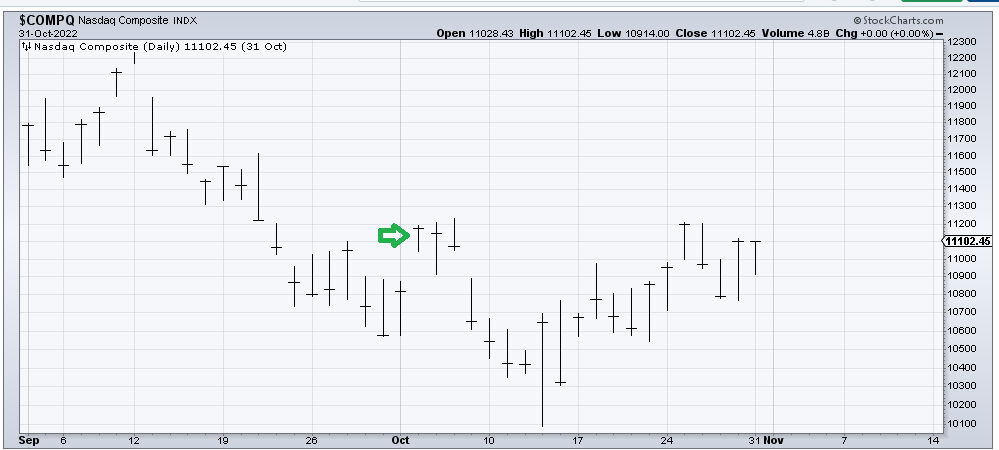
But as I said, it’s Nasdaq that I have been eyeing at the oversold area, and there we saw upside volume at 87%. I was curious, the last time it had such a high reading and impressively, that was October 4, 2022, so I took a look.
The bad news is that within three days, we gave it all back. The good news is that next leg down led to a terrific low.
Then there is the sentiment. I see many are hesitant to embrace the rally. But then there is the ISEE call/put ratio, which finally---on an up day!—came in under 1.00 at .90. That is the lowest reading since April 4th last year. That showed up on a down day (arrow) as it typically does, and a few days later, we had a low.
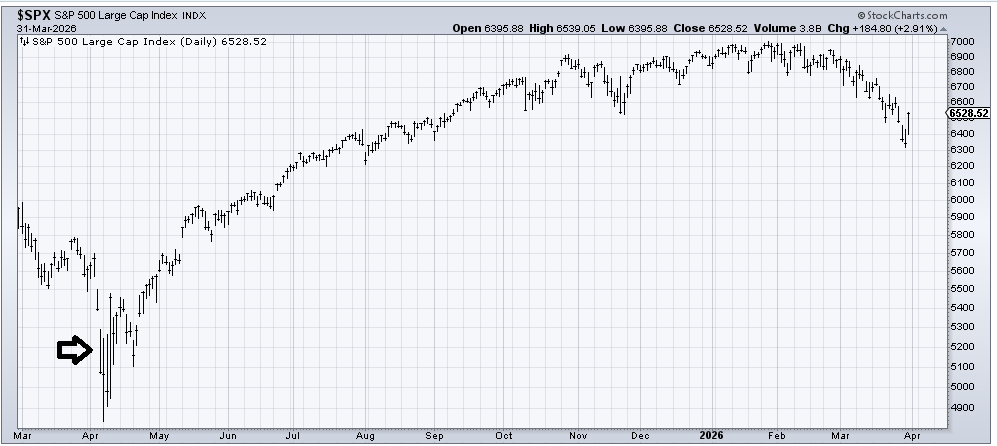
The last time we had a reading under 1.0 after a low was in June of 2024. But mostly these sorts of readings have not marked the exact low, but somewhere near it.
Mostly, this looks like an oversold rally to me. And with the 21-day moving average of the ETF put/call ratio now higher than April of last year, there is/was quite a bit of hedging to unwind on the last day of the quarter.
New Ideas
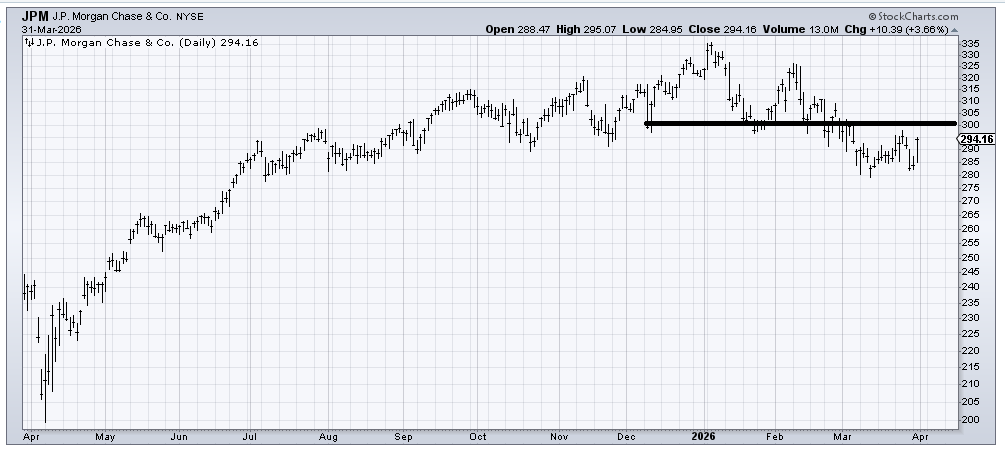
Here’s what I would watch in the coming days. If these stocks cannot overcome the resistance noted, then we are likely to see some more downside.
Can JP Morgan (JPM) get over 300?
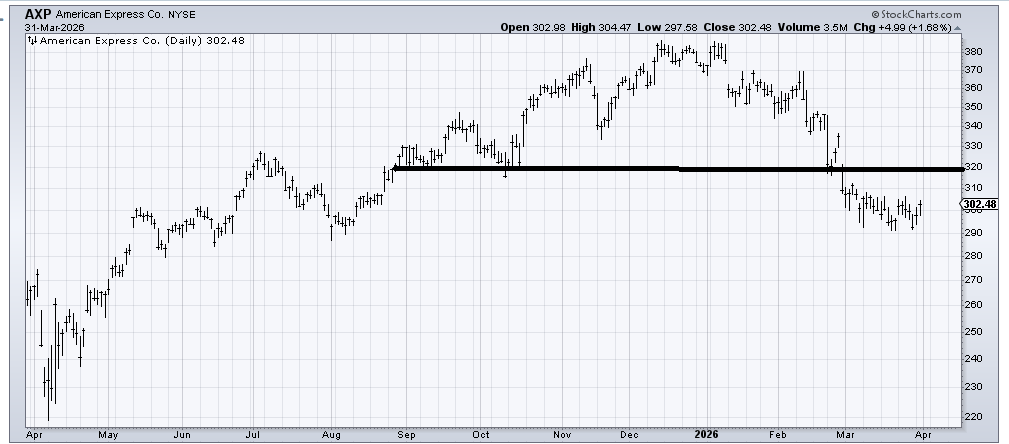
I have been a fan of American Express (AXP) for a couple of weeks now, and it hasn’t done anything. Can it get over 310 (the first hurdle) and then to 320 (serious resistance)?
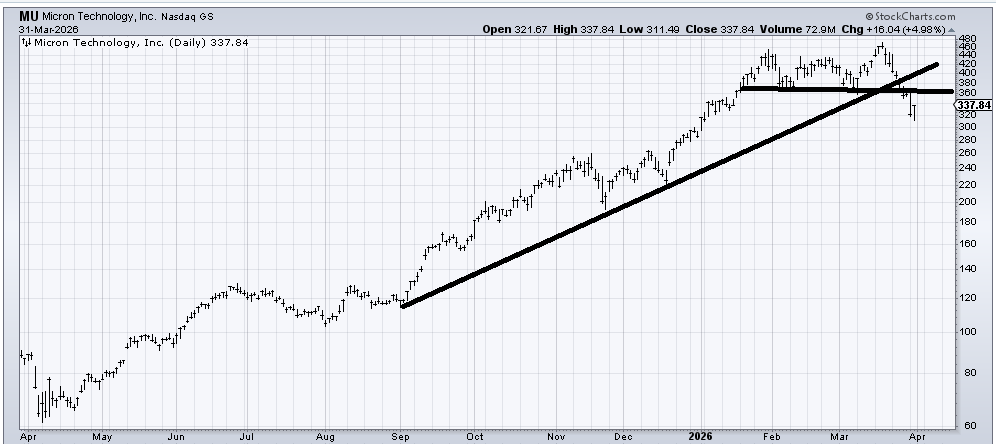
Can Micron (MU) get back over 360, or does it stop there, or before it?
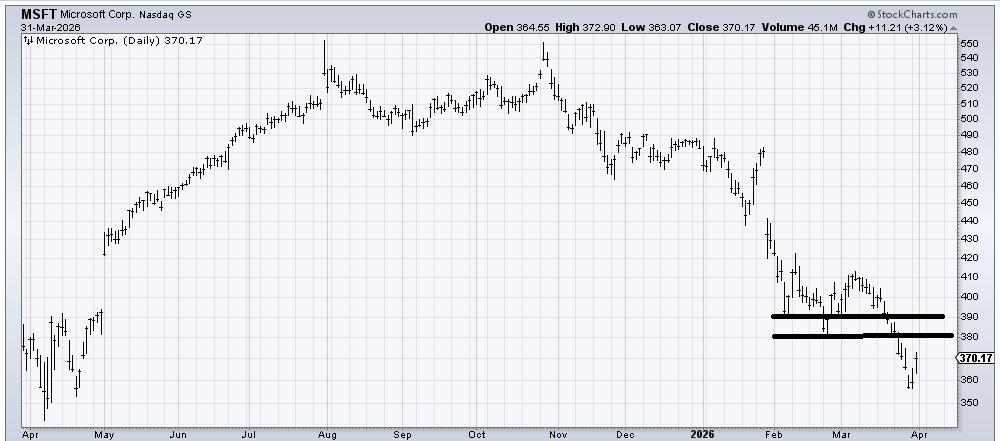
Finally, I recommended Microsoft (MSFT) last night, and it did well today, but can it get over 380?
Today’s Indicator
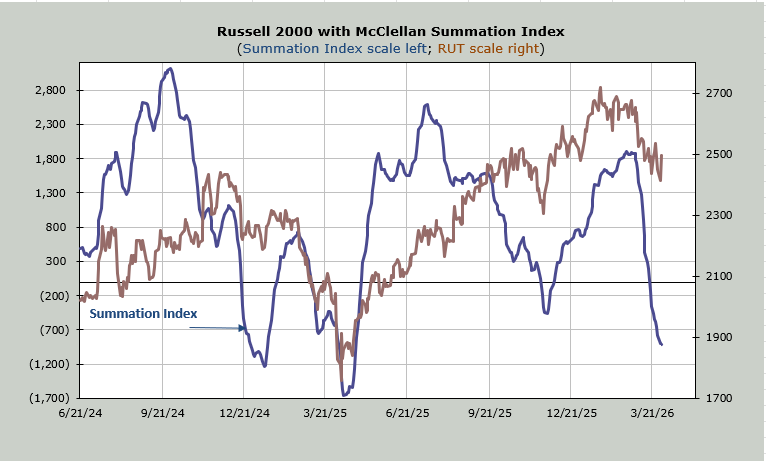
The McClellan Summation Index is still heading down, but it won’t take much to halt the decline. A net differential of +300 or more will do it.
Q&A/Reader’s Feedback
Helene welcomes your questions about Top Stocks and her charting strategy and techniques. Please send an email directly to Helene with your questions. However, please remember that TheStreet.com Top Stocks is not intended to provide personalized investment advice. Email Helene here.
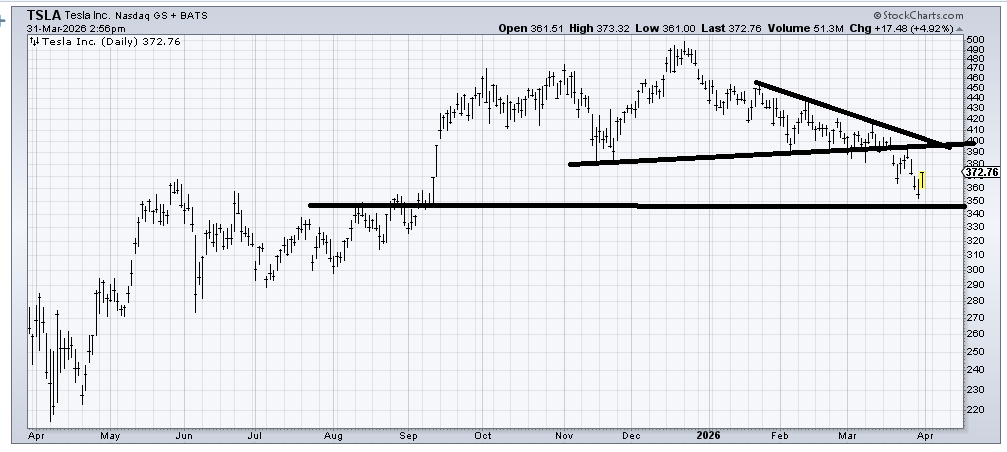
When we looked at Tesla (TSLA) last week, I said if it can recapture 400, then the chart would be okay. I would say the same thing this week.
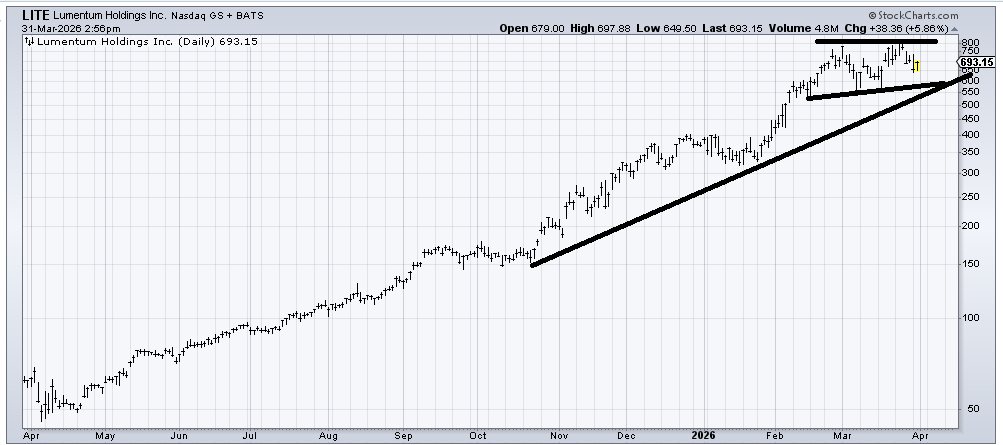
When we looked at Lumentum (LITE) last week, I said it was in a trading range, and it could move to the lower line. The chart hasn’t done anything wrong. I would respect a breakout in either direction.
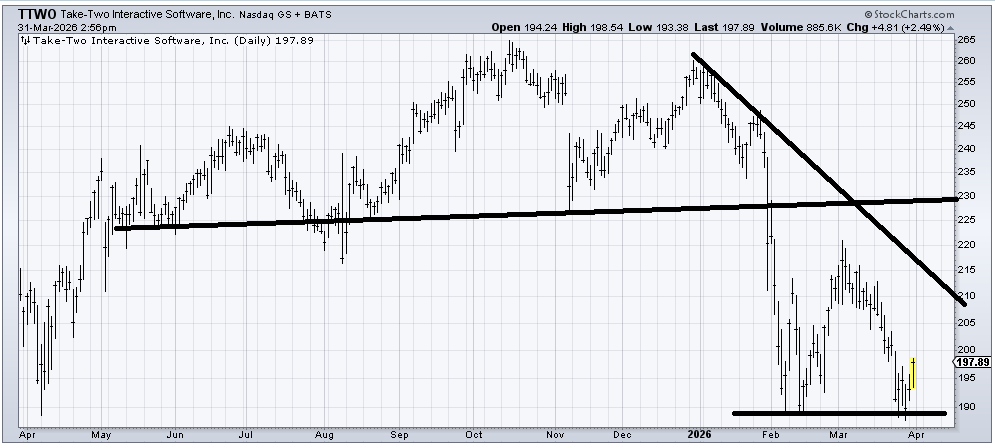
Take Two Interactive (TTWO) came down to support, which was also a measured target, and now it has formed a W. As long as it stays over 190, it ought to start some base building.
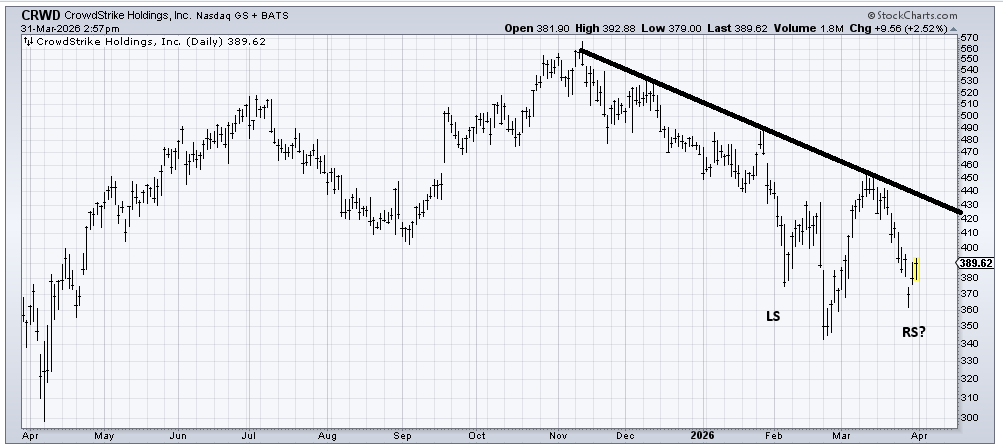
CrowdStrike (CRWD) has a funky head and shoulders bottom it’s working on. It is funky because the right shoulder is lower than the left one. But the pattern is there.
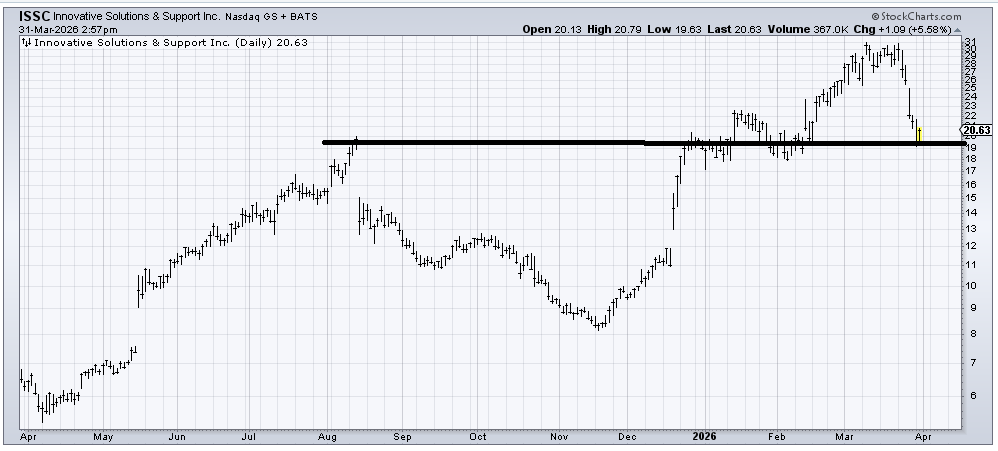
Innovative Solutions & Support (ISSC) has come down to support and should rally. If this rally cannot get up and over 23, I would get concerned. Otherwise, resistance is around 25-26.
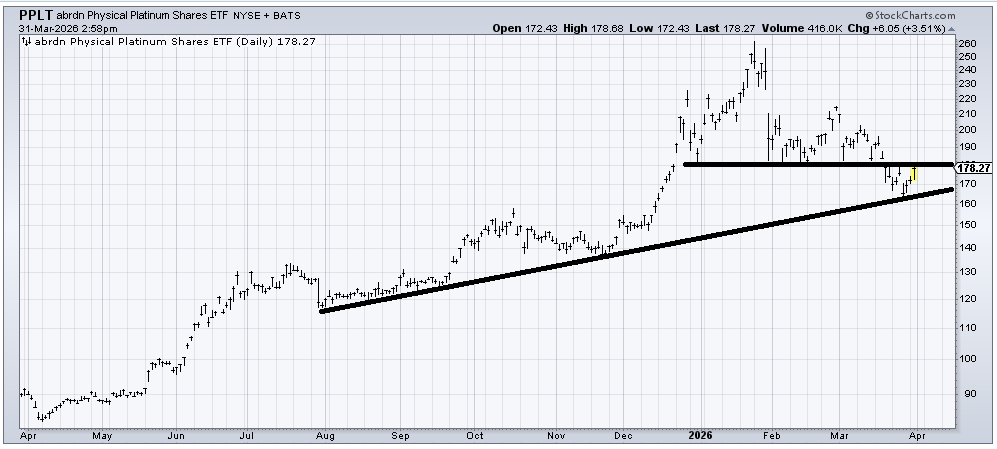
(PPLT) , an ETF to be long Platinum, looks trapped between support and resistance (160-180). There is an awful lot of resistance to chew through, even if it can recapture 180, so I would just keep a stop under 160.
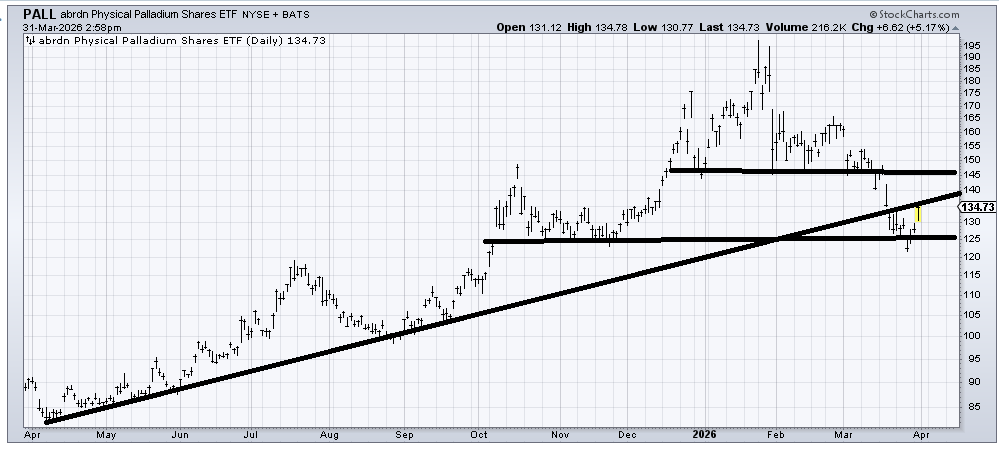
If (PALL) , an ETF to be long Palladium, can get back to 145, I’d be inclined to take profits.
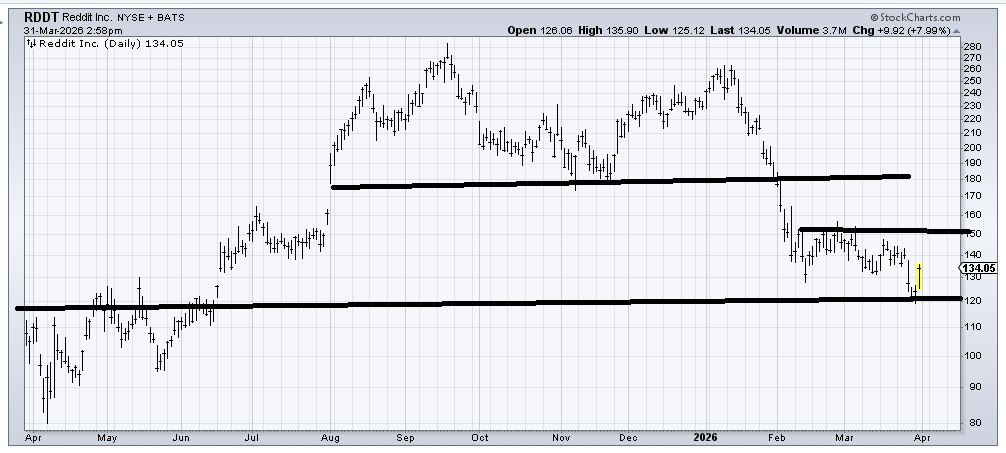
Reddit (RDDT) is oversold enough to bounce into that 140-150 area. Then I would want to re-assess it.
Related: Chart of the Day: The Last Stand for Google Is Approaching
