A Bad Case of the Monday.coms
As this Israeli name sinks after earnings, let's check the chart and see if it's worth bottom fishing.
You've reached your free article limit
You've read 0 of 1 free Pro articles.
Tel Aviv-headquartered, cloud-based software platform provider Monday.com this morning released its second quarter financial results. The results were solid. The guidance was OK, if not better. Yet, the stock was beaten like a rented mule ahead of the opening bell in New York.
In full disclosure, before I knew that I would be writing this piece, I did grab a few shares early this morning. I have frozen that currently very small position where it is until after this piece goes public and hits publication. So, is Monday.com a bargain at discounted prices, or still overvalued? Let's explore.
For the three month period ended June 30, Monday posted an adjusted earnings per share of $1.09 (GAAP EPS: $0.03) on revenue of $299.014 million. The top line print beat Wall Street by more than $5 million and was good enough for year-over-year growth of 26.6%. Yes, this is a deceleration from the mid-30% pace of growth in 2024, but this is not a surprise and growth is projected to stabilize in the mid-20% area going forward. That adjusted bottom-line number crushed Wall Street's expectations and compares well to the $0.94 posted for the same period a year ago. The difference between the company's unadjusted and adjusted results was largely due to $56.645 million in share based compensation expense.
Operations
Revenue increased 26.6% to $299.014 million, the cost of that revenue increased 31.2% to $31.173 million. That left a gross profit of $267.841 million (+26.1%) as gross margin dropped from 89.9% to 89.5%. Total operating expenses amounted to $279.392 million (+32.7%), leaving a GAAP operating income / loss of $11.551 million, down from $1.794 million as unadjusted operating margin dropped from 1% to -4%. But once adjusted, operating income printed at $45.1 million (+17.5%) as adjusted operating margin dropped far less precipitously from 16% to 15%.
Once accounting for interest, other income & expenses and taxes, GAAP net income printed at $1.573 million, down from $14.315 million. This works out to a fully diluted unadjusted EPS of $0.03, down from the year ago comp of $0.27. Once adjusted, net income landed at $58.296 million (+18.2%). This works out to a fully diluted $1.09 per share up from $0.94.
The CEOs
Co-CEOs and co-founders Roy Mann and Eran Zinman released a joint statement with the press release... “We continue to see evidence that our commitment to AI innovation is delivering real value for customers, and we're proud to be leading a new era of work execution. By taking the platform’s flexibility to the next level, our new AI capabilities address core challenges across all our product areas and allow users to focus on their most critical strategic priorities.”
Guidance
For the current quarter, Monday projected total revenue of $311 million to $313 million, with Wall Street looking for something close to $313 million. That would be a slight miss, but still be good for growth of 24% to 25%, which is just about what Wall Street is looking for. Adjusted operating income is seen at $34 million to $36 million, on an adjusted operating margin of 11% to 12%. This would be down from 15% on a sequential basis and is somewhat disappointing.
For the full year, total revenue is seen at $1.224 billion to $1.229 billion. This is an increase from previously issued guidance of $1.22 billion to $1.226 billion and above the $1.22 billion that Wall Street had in mind. The company sees a full-year adjusted operating margin of 13% and full-year free cash flow of $320 million to $326 million on a free cash flow margin of 26% to 27%. I found that encouraging.
Fundamentals
For the quarter reported, Monday generated operating cash flow of $66.837 million. Out of that came capital spending of $5.884 million and costs of $924,000 related to capitalized software development. Add back cash spent on the expansion of the company's corporate headquarters and the company was left with free cash flow of $64.093 million (+26.1%) as free cash flow margin dropped from 22% to 21%.
Glancing at the balance sheet, we see that the company ended the period with a cash position of $1.651 billion and current assets of $1.774 billion. Current liabilities add up to $672.91 million, which does not include any short-term debt, but does include deferred revenue (which is not a true financial obligation) of $402.794 million. This puts the firm's headline current ratio at quite muscular 2.64. Once adjusted for those deferred revenues, this ratio rises all the way to an incredibly strong 6.57.
Total assets amount to $1.964 billion. Total liabilities less equity comes to $771.593 million, which includes no long-term debt, but does include some additional deferred revenue. No debt at all on these books. This is one super high-quality balance sheet.
My Thoughts
Monday.com came in trading at 65-times forward looking earnings, so the stock was expensive. That was as true on Friday as it is this morning. Sales growth is decelerating, but are not weak. Margins are under pressure, but that is largely a function of stock-based compensation. That's easily correctable should there be a will to do so. Cash flows are excellent and the balance sheet is fortress-like. Guidance is the problem this morning. The current quarter looks so-so, but the full year is still looking fairly strong. I'm in it for a trade this morning. Let's take a look:
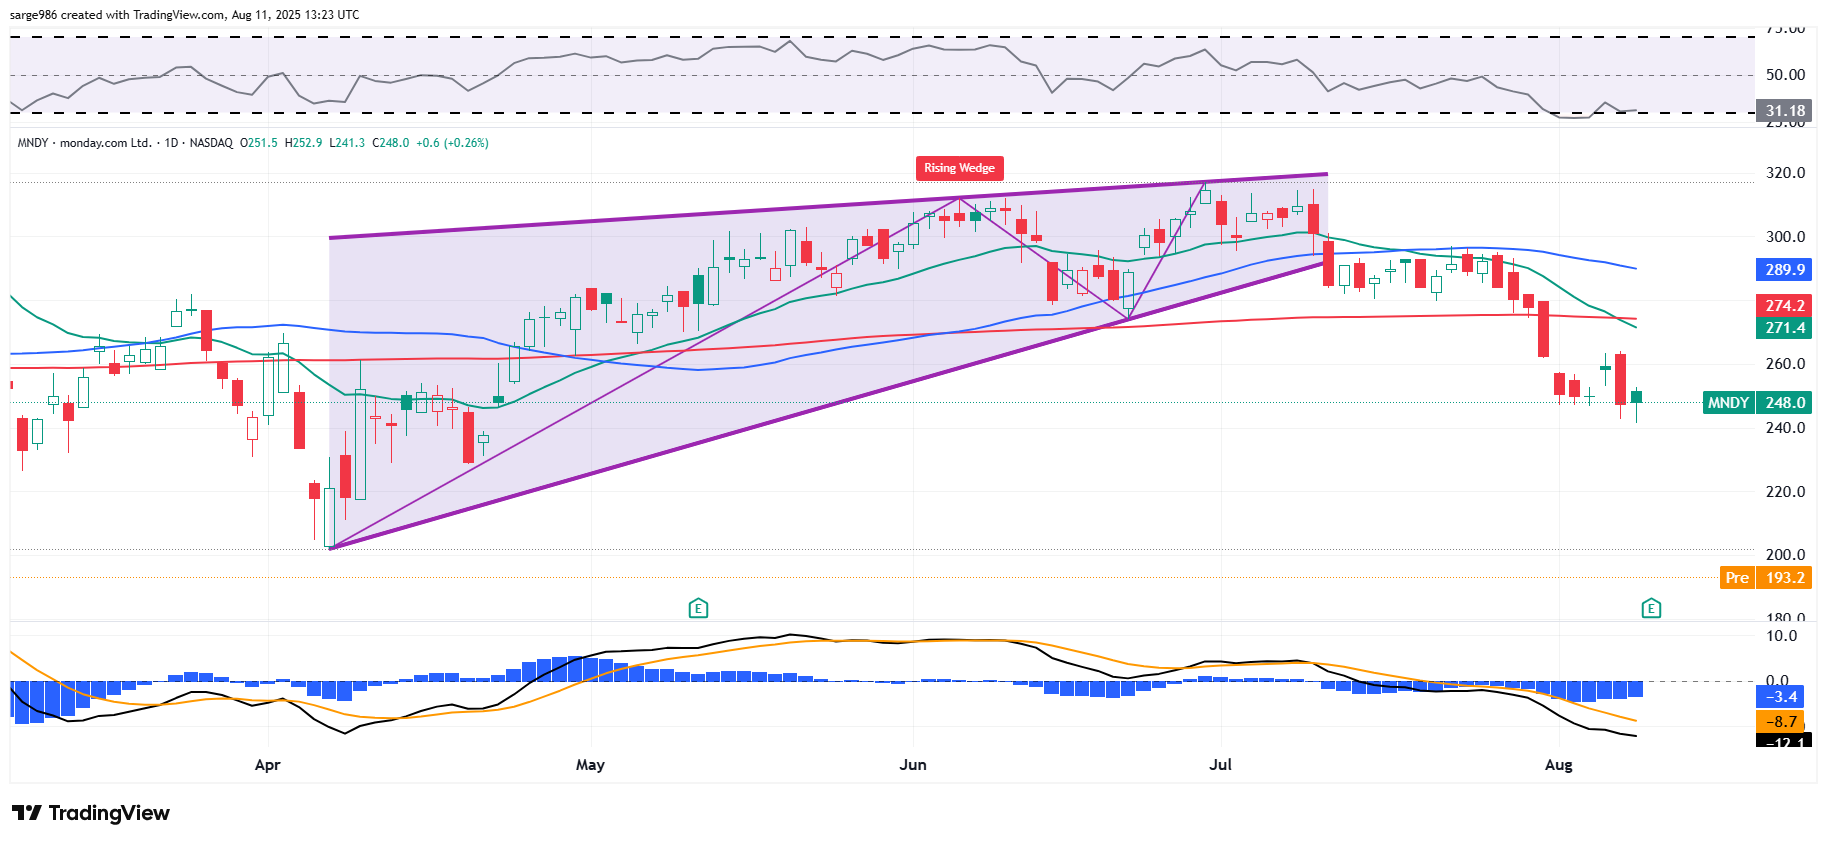
Readers will see that MNDY broke down from a Rising Wedge pattern of bearish reversal back in July. The selloff was accelerated by a 21-day exponential moving average that crossed below the stick's 50-day simple moving average in July and a 200-day SMA in August. In addition, institutional managers were forced to reduce long-term exposure when the stock lost its 200-day SMA itself. This morning, the stock will seek support as the community of analysts takes actions that will likely increase algorithmic volatility. Both the stock's reading for Relative Strength and it's daily Moving Average Convergence Divergence are in awful shape and look to be technically oversold. Let's zoom out:
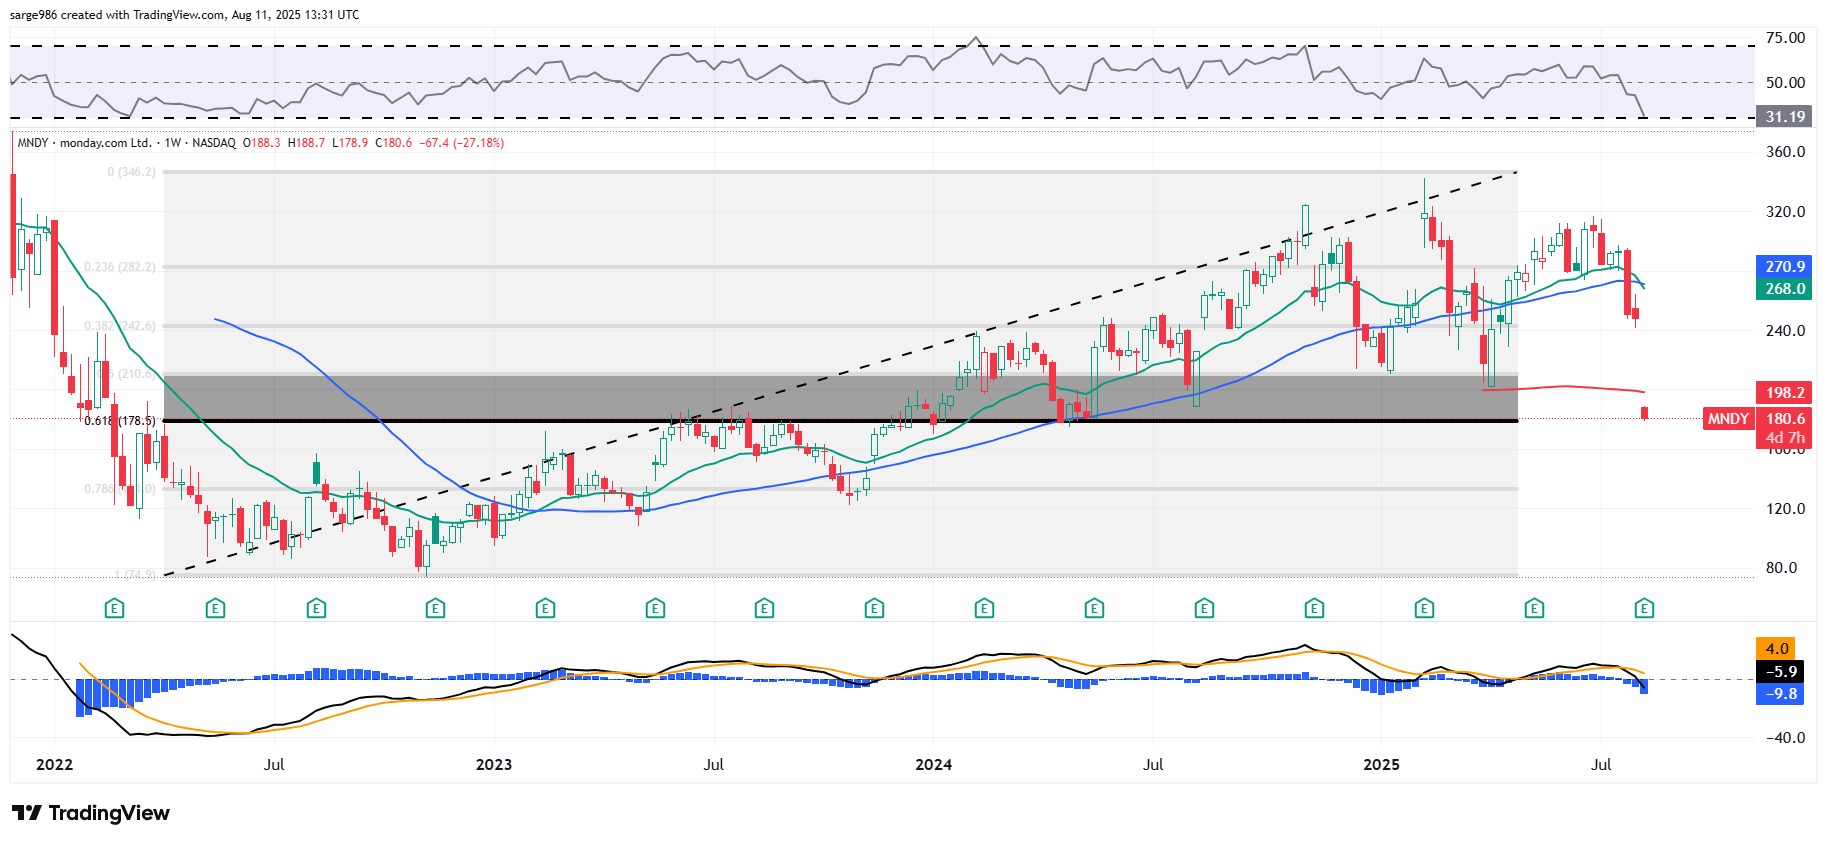
Going to the weekly chart, readers will see the stick struggling to hold the 61.8% Fibonacci retracement level of the November 2022 through early 2025 rally. This level, right around $178 is the key. That line cracks? The $120 area would not be unrealistic. That line holds? Well, then there is a huge unfilled gap that in all likelihood (no guarantees) will fill at some point. Do I think it's OK to bottom-fish for a trade? Yes. As long as the trader / investor understands the risk, understands that catching a falling knife is speculative and obeys their own risk management protocols such as my 8% rule. As with The Trade Desk TTD last Friday, we understand the game we play when we play.
At the time of publication, Guilfoyle was long MNDY, TTD equity.
