3 Stocks to Short: These Pullbacks Could Just Be the Start
These three names have seen some solidly bearish action recently and further downside appears to be ahead.
You've reached your free article limit
You've read 0 of 1 free Pro articles.
Let's check three stocks that appear technically bearish and ready to short.
While we will not weigh in with fundamental analysis on these issues, we will pop the hood for a look at the charts.
Let's dig in.
1. Housing Story Remains Bearish with Lennar
When a group like the housing sector is bearish there are ripple effects for the economy. Homeownership is a big business in this country and personal wealth skyrockets with it. Not many places in the country have property that goes down.
But homebuilding is different, and as the Lennar (LEN) chart shows, there is some difficulty when the trend is bearish.
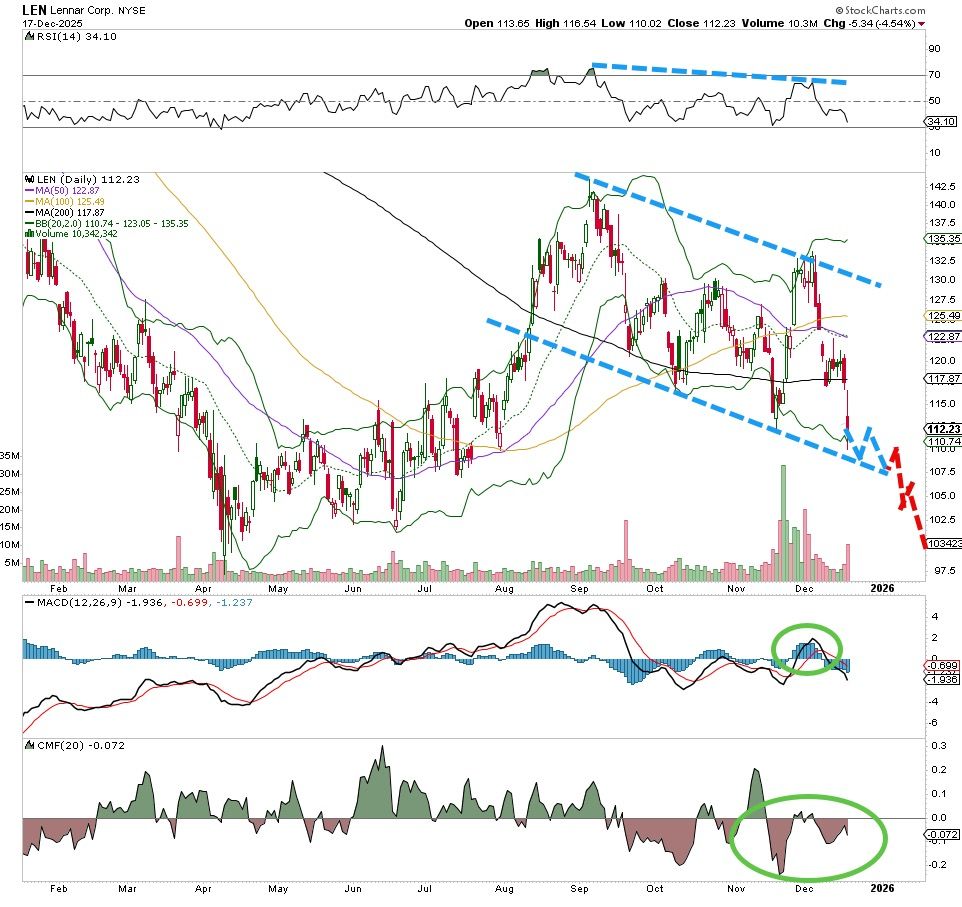
That is certainly the case here as the chart bears witness, MACD is now on a double sell signal, the stock just fell through a downtrend channel, you can't get more much more bearish than that. April lows are in sight, that would be a first target here for a short, let's target $97.50 and then perhaps a bit lower after that, put a stop in at $112 just in case.
2. Broadcom Earnings Were Good, But Not Good Enough
This stock Broadcom (AVGO) has been on a remarkable run for months, but eventually the heavy buying was going to catch up to it. Money flow is bearish here and the MACD just turned lower for a sell signal, and with breaking the 100-day moving average (top pane) there is now a layer of support sitting much lower, call it the $285 area at the 200-day moving average.
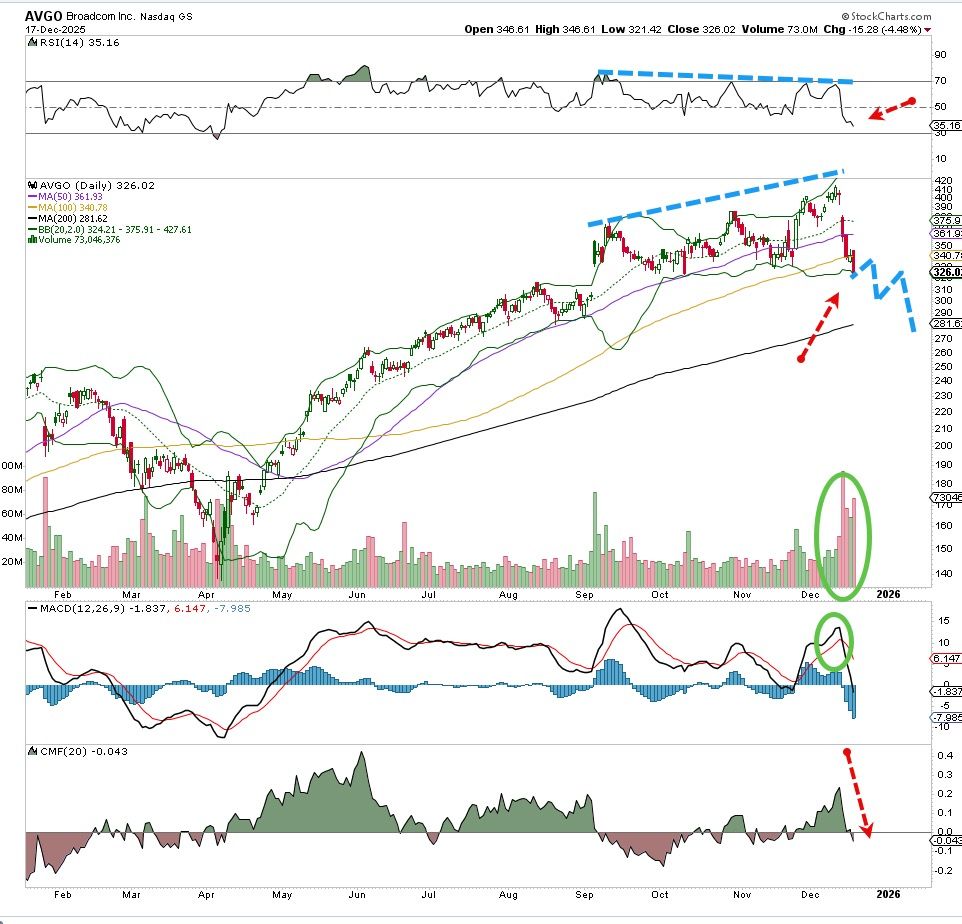
It might be tough to believe this stock could be headed there but that was the launch point in April, and that might work once again. For now, the path of least resistance is down, we'll target thee $285 level, put in a stop at $340 just in case.
3. Intel's Best Days May Be Over
A huge fall for Intel (INTC) over the last few days, some would say it was just to the lower end of a support zone but that intense selling volume is telling us something different. Money flow has really slowed down, the MACD on a fresh sell signal and the RSI at the top is pushing lower.
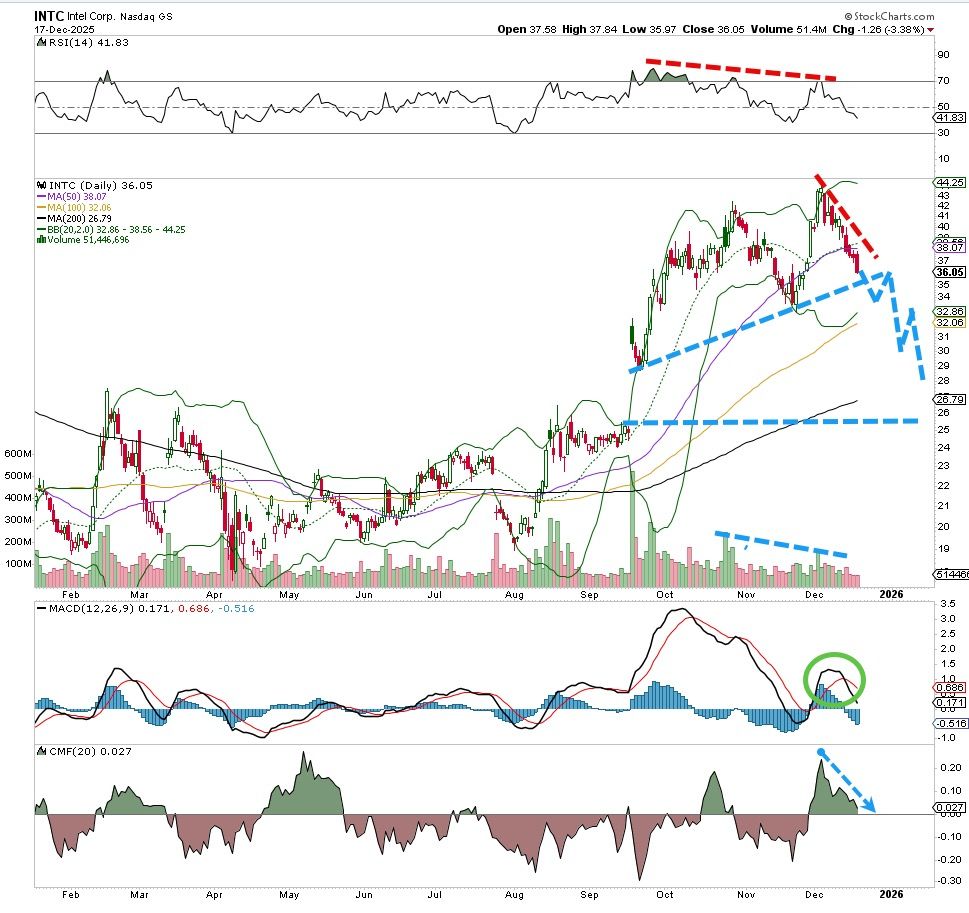
There is a big gap to fill much lower than current levels, around the $28.50 level, let's target that spot first, and then down to the $25 area. Put in a stop though at $42 just in case, but this chart is showing bearish qualities.
