3 Key Things to Watch in the Market as CPI Lands
Here's what to keep an eye on as the inflation report arrives. Plus, why Nvidia is not my kind of chart, and looks at Berkshire, Broadcom, Bitcoin, CrowdStrike and more.
You've reached your free article limit
You've read 0 of 1 free Pro articles.
The Market
The selling dries up — heck it barely arrives. But the buying has been lethargic as well. Most of the major indexes — including the Russell 2000 — are the same price they were on July 3.
Are we just working off the too-bullish sentiment and the overbought condition by churning? So far it seems that way. But did anything change after Monday, indicator-wise?
Well breadth was flat Monday, which when you consider the Russell was up 13 points is not what I would have expected. Mostly, though, what changed is the McClellan Summation Index has stalled. It has not turned down. A good breadth day Tuesday would give it some renewed strength. But that’s something to watch.
And here’s something else to note: the SOX closed red. Oh gosh, I know it is barely down but it has been the leader and it actually closed red for the second straight day. That is not a big deal except it is the first time since mid-May it has done that.
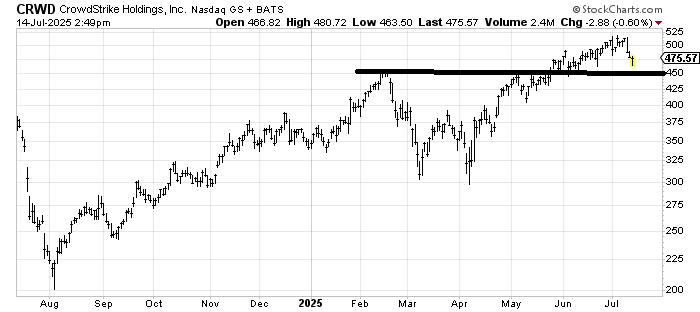
Last week they sold the software stocks (Monday they got saved, of course I thought they should have bounced Friday). Now let’s see if they decide to do a little selling in the semis. Because that would be a change.
Also, there was a minor uptick in stocks making new lows Monday. It was the highest number since June 30, but the number itself is not large (NYSE 23 new lows and Nasdaq 78 new lows). It’s just that the new highs are not increasing either.
Anyway, Tuesday we get the CPI so let’s see if that can shake things up.
New Ideas
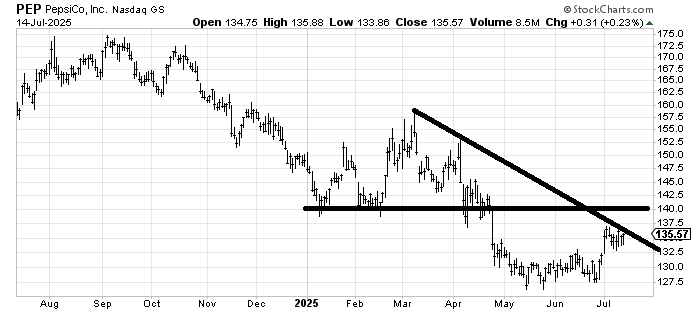
I am still a fan of PepsiCo PEP as it looks like it is forming a cup and handle down here. But be aware that earnings are out on Thursday and I do hate to "play" earnings.
Another chart I still like is 3M MMM, but it too has earnings at the end of this week.
Finally, I reviewed iShares Bitcoin Trust ETF IBIT last time so I feel I need to report that the DSI for BTC is now 83. Another up day and it will get into the danger zone.
Today’s Indicator
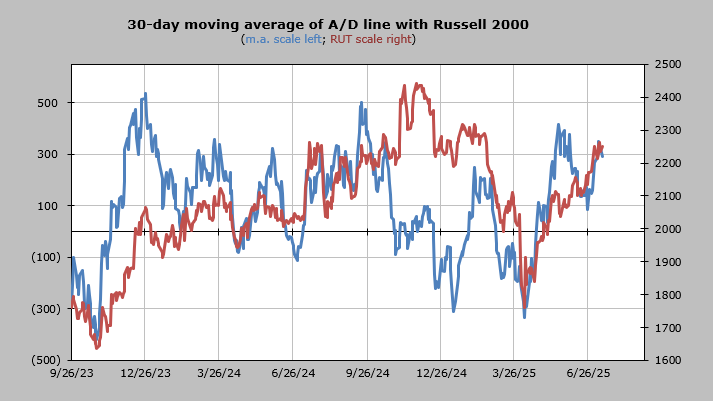
The 30-day moving average of the advance/decline line is overbought.
Q&A/Reader’s Feedback
Helene welcomes your questions about Top Stocks and her charting strategy and techniques. Please send an email directly to Helene with your questions. However, please remember that TheStreet.com Top Stocks is not intended to provide personalized investment advice. Email Helene here.
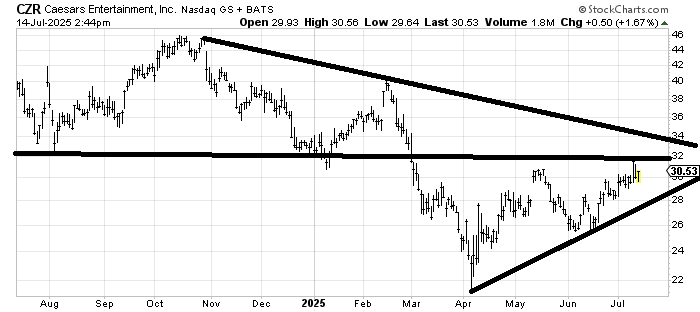
Caesars Entertainment CZR is trying to bottom but the resistance at $32-34 is a short-term problem. Basically I think you need some patience on this one because eating through that resistance will take time.
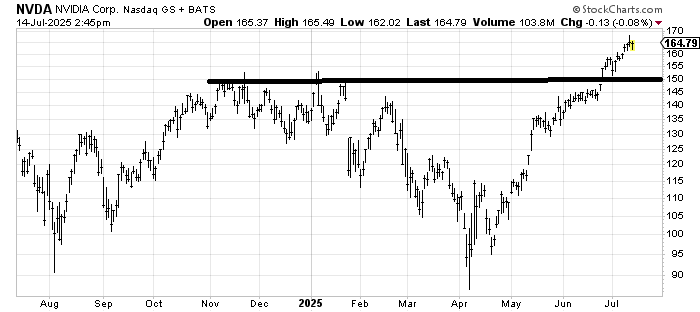
Nvidia NVDA is not my kind of chart. I guess we can call that a breakout over $150 but it’s more like it just creeps upward with little life. I have a next measured target near $170. Quite frankly a pullback all the way to $150 would make it a better chart to me.
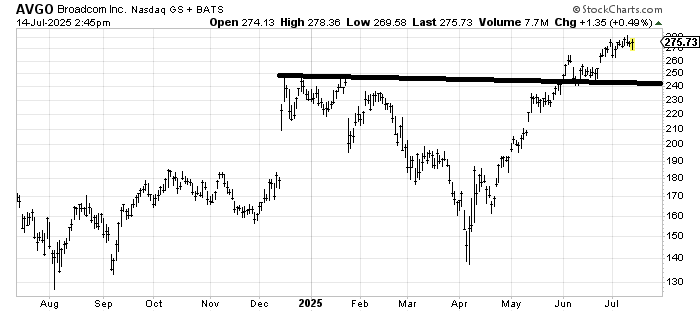
Broadcom AVGO has a bit more life than Nvidia but both have stalled out for two weeks now. A whoosh down to 260-ish would shake things out and improve the chart. Longer term, there is a measured target around $340.
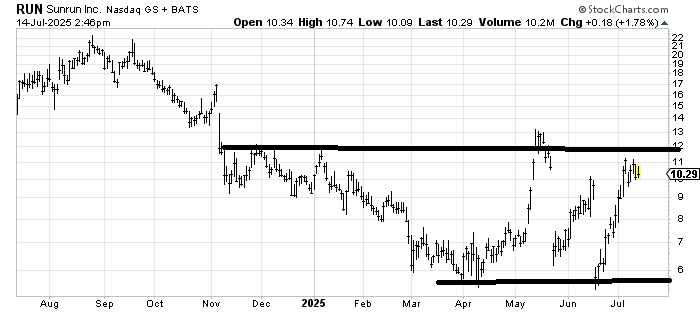
Sunrun RUN has so many gaps it’s hard to trust any move up. I suppose it is trying to base, but with this chart chasing momentum has been a losing strategy. Maybe a pullback to $7 would make it better. Or a gap up over $13 that holds.
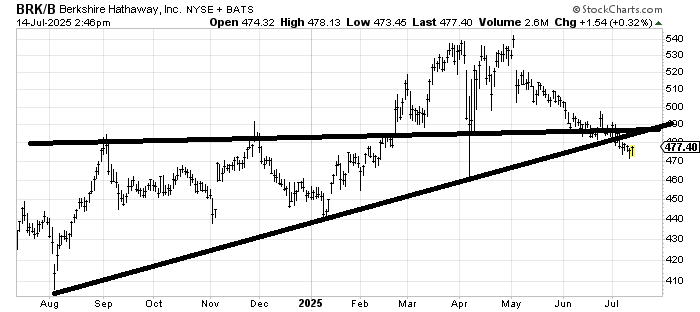
I thought Berkshire Hathaway BRK.B would hold and rally from that $480-490 area and it slipped right through it. But I still think it should rally. Only now that it has bounced off $470 let me say that a rally that is pathetic that then breaks $470 would have me concerned.
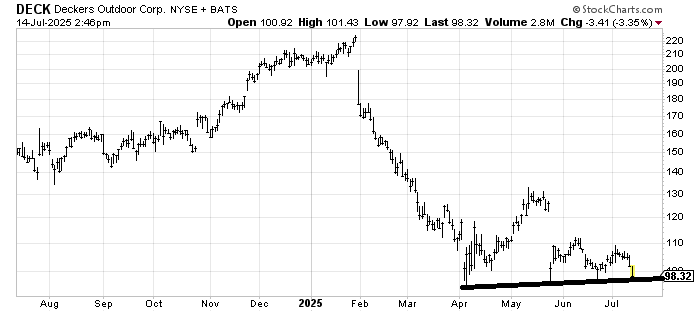
I recall we looked at Deckers DECK when it came down in May and I thought it should bounce. My reasoning is that the first test of a spike low tends to hold but the third or fourth is not as easy to figure. I don’t like the chart but if you want to take a stab, your stop is pretty darn close ($96-ish) to know you are wrong.
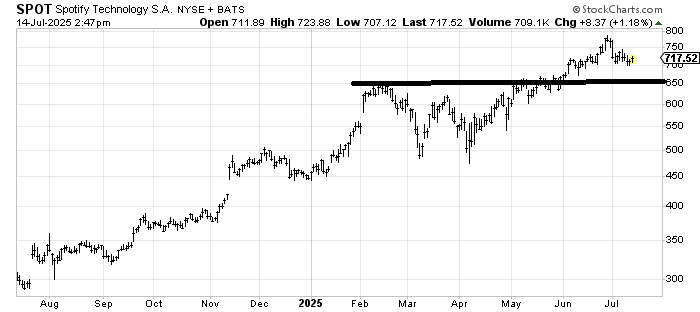
Spotify SPOT is similar to many of the charts we’ve looked at in the software area lately. It has come down to support. It’s not rallying well from support but it is not breaking either. I would love to see a whoosh to that line around $650. This stock seems to do well after a whoosh.
CrowdStrike CRWD is doing what I am asking of all those stocks above: coming down to test the breakout. Was Monday enough or does it need to tag $450? It’s short-term oversold. If it can do some work now without breaking $450, then it would improve the chart. A break under $450-ish is bearish.
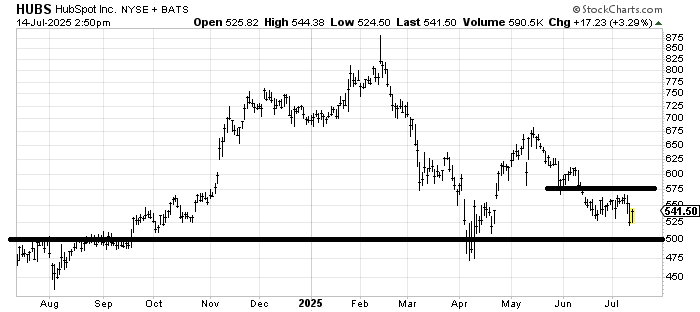
Finally a tech stock that is down and out! HubSpot HUBS looks awful because it is down 20% since May. But I wonder if it is bottoming in this $500-525 area. A move over $575 would be a good start at saying yes.