2 Big Questions for the Week Ahead
Here's where my focus lies now that the speculative trade has cooled. Plus, a close look at Meta, the Nasdaq, the IWM, Salesforce, Axon and more!
You've reached your free article limit
You've read 0 of 1 free Pro articles.
The Market
The metal fever broke. So did the fever in the quantum stocks and Utes. And the crypto stuff. Basically it seems like the low quality/speculative trade fever (well, Utes are not low quality!) broke late last week.
We discussed the Utes on Tuesday evening. You already know where I stand on the metals and the speculative names such as quantum, but I have two questions for the week ahead.
First, last week I began my Sunday missive noting the financials were key. The big banks held up relatively well but the regionals collapsed on Thursday. Friday they got saved a bit so once again my eyes are on the financials to see if Friday’s rebound was a small respite or something more. My inclination is there is still work to be done (i.e., I do not expect a rebound that screams upward).
So that’s question one.
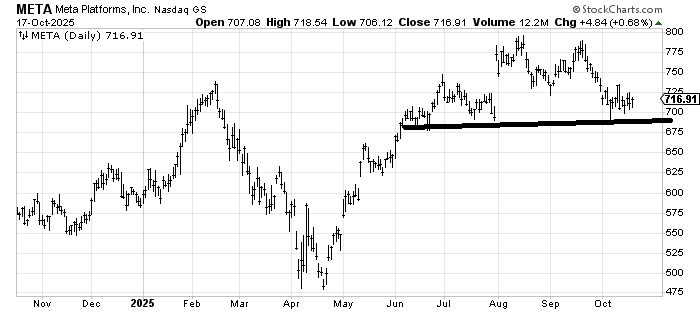
Question two is if the rotation out of all of these speculative names finds a rotation into the Mag 7-type names now. For example, thus far Meta (META) has been holding that $700 area that I have highlighted several times in the last week or so, but can it now get itself up and over that $725-730 area? Because if it can’t then I fear it sets it up to break down on the next trip lower.
Stocks usually have two paths they take when they get to support. They break and bounce well or they break and bounce and mill around. The former is bullish. The latter is not. The latter tends to mean it’s just gathering steam to break.
Away from that I can offer a few short-term bullish items for the week. We’re a little oversold (short term). A down day on Monday would get us to a slightly better oversold condition. The VIX made a higher high and reversed downward by quite a bit on Friday.
And lastly, the equity put/call ratio zipped right up to 0.72, the highest since August 28 (when it was 0.75). The ensuing two days saw some more downside and then we rallied.
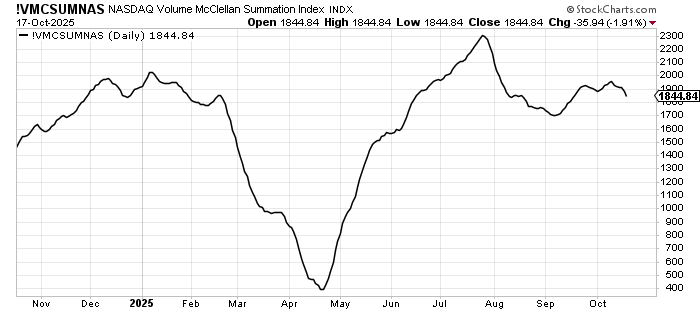
But otherwise the indicators haven’t changed. Breadth is still mediocre to poor. Heck, even the Nasdaq’s net volume was negative on Friday. To show you how rare that is, it is the first consecutive red days for Naz volume in two months. It is also the first time in months that the Nasdaq itself was green and net volume was negative.
I chalk that up to the speculative fever breaking. You see the Nasdaq McClellan Summation Index (using volume) is heading down. It needs a net differential of +7.5 billion shares (up minus down) to halt the decline. That is what makes it slightly oversold, but also what makes the divergence still with us.
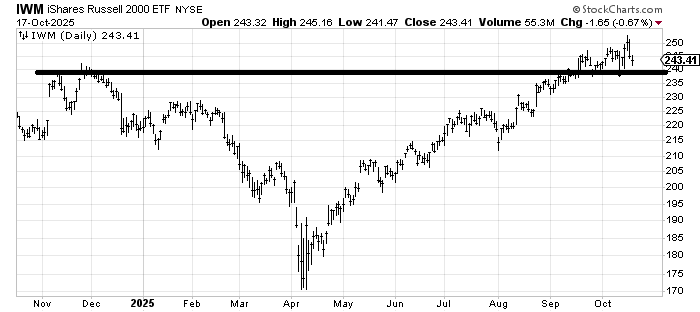
Finally, I’ve got my eye on that $240 area on the iShares Russell 2000 ETF (IWM) because that level has held for the last month. Breaking it shows a change and could make folks rethink that view that IWM has broken out.
New Ideas
I’m going to do some follow-ups today.
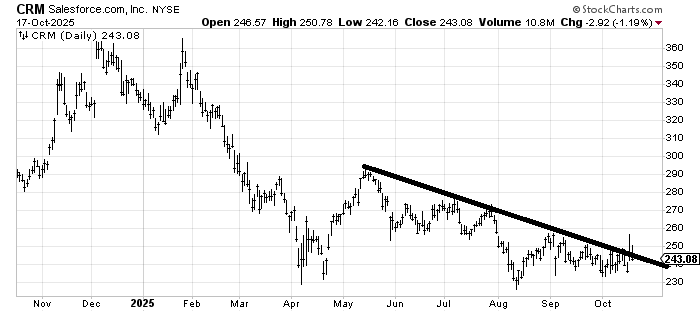
Salesforce (CRM) crossed over that $250 area (downtrend line) but could not hold it. If the stock cannot rally this week I will give up on it.
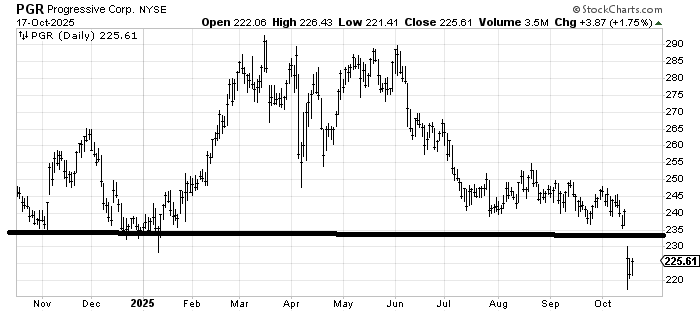
I was really convinced Progressive (PGR) was making a bottom, but that gap down late last week proved me dead wrong. I will have to be a seller on a rally now.
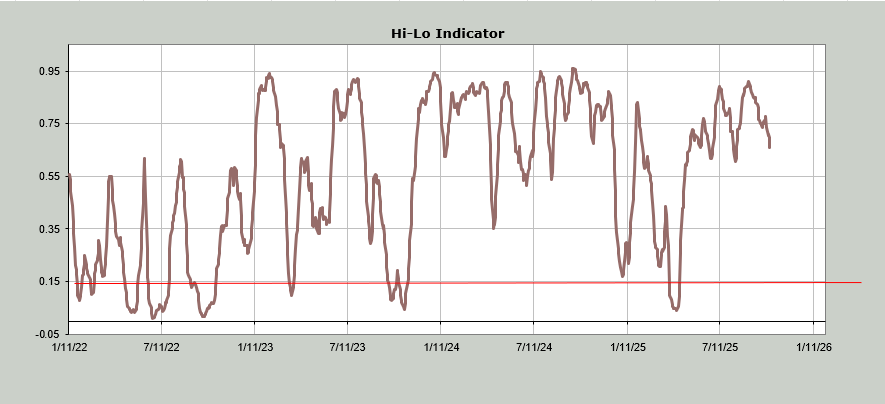
Today’s Indicator
The Hi-Lo Indicator is heading down.
Q&A/Reader’s Feedback
Helene welcomes your questions about Top Stocks and her charting strategy and techniques. Please send an email directly to Helene with your questions. However, please remember that TheStreet.com Top Stocks is not intended to provide personalized investment advice. Email Helene here.
Due to my day off I might have missed some requests. If your request doesn’t show up here, please send me another note.
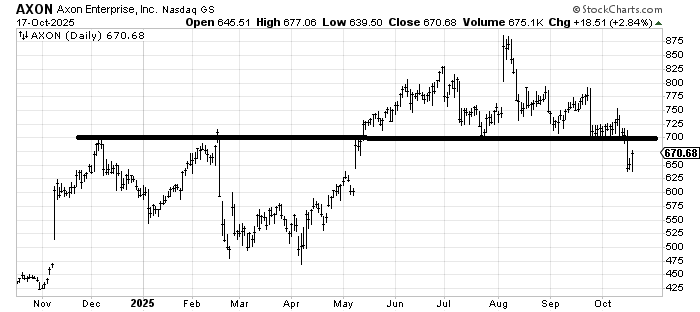
I thought Axon Enterprise (AXON) would hold that $700 area and rally. But do you see how it rallied, but poorly? That’s what I am describing when we look at t he Meta chart above: a poor rally is just a weigh station, a reprieve.
Now AXON leaves behind a head-and-shoulders top that measures to the April lows, which might be too far since there is that gap around $575-600. If it cannot recapture $700 this week I’d be a seller.
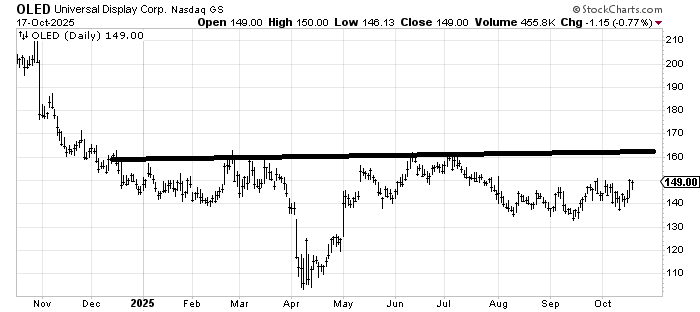
I liked the chart of Universal Display (OLED) months ago because of that base and it just can’t seem to get going. Yet I still see a base. Over $150 and I think it should get to $160 easily, but we’ll have to see if $160 stops it in its tracks one more time.
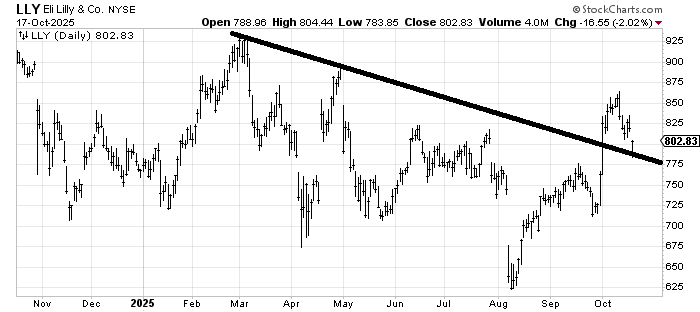
Eli Lilly (LLY) bounced off support. There are always two steps: bouncing from support and then if the stock rallies or sits there (see the Meta discussion). Now the test is if LLY can get up over what is now resistance in that $825-850 area.
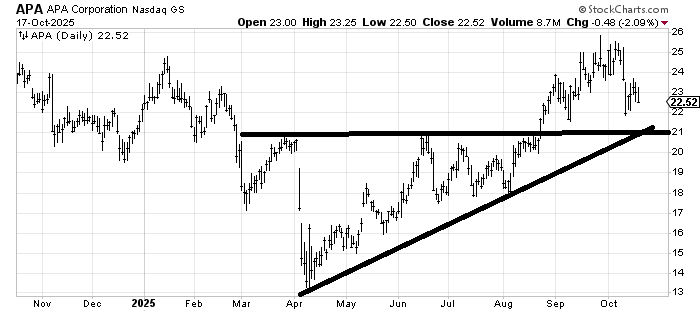
A few months ago I was asked about APA Corp. (APA) and I thought it should bounce off $21. It got to $21.50 and bounced pretty good, but then it died and is now looking like a potential head-and-shoulders top. There is still support at $21 but I’m not so sure it’s buyable down there anymore.