Why We Track Company and Industry Backlog and RPO Figures
What we see in these figures is a leading indicator of revenue and earnings.
You've reached your free article limit
You've read 0 of 1 free Pro articles.
When we examine a company’s quarterly results, there are a number of line items across its financial statements that we examine.
Most tend to focus on the higher-level items that include revenue, operating profit and EPS, but we like to go a bit deeper, assessing quarter-to-quarter movement and outlook for the company’s reported business segments. When companies report them, we also like to track developments for either their backlog or remaining performance obligation levels.
Before we go any further, let’s be sure to define those two terms:
Backlog: orders received but not yet fulfilled.
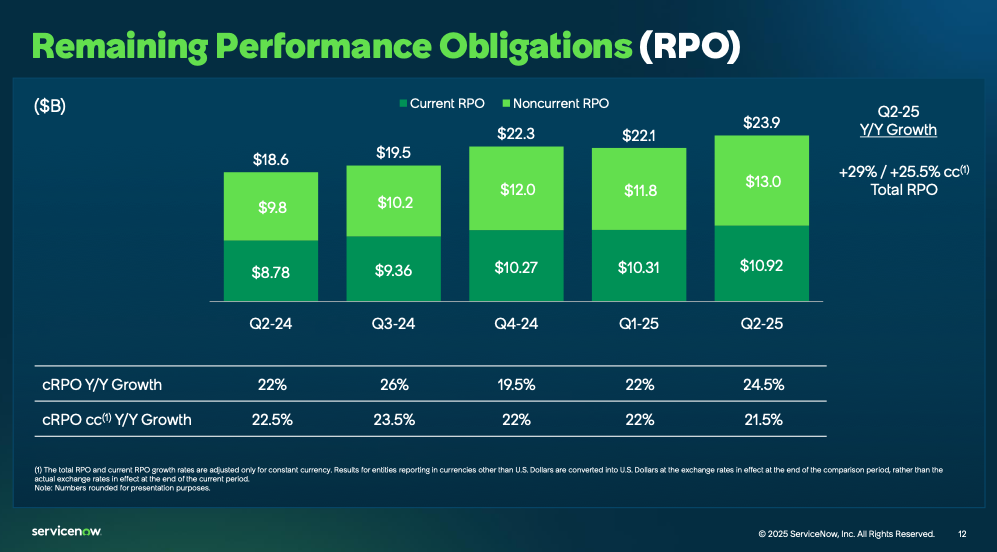
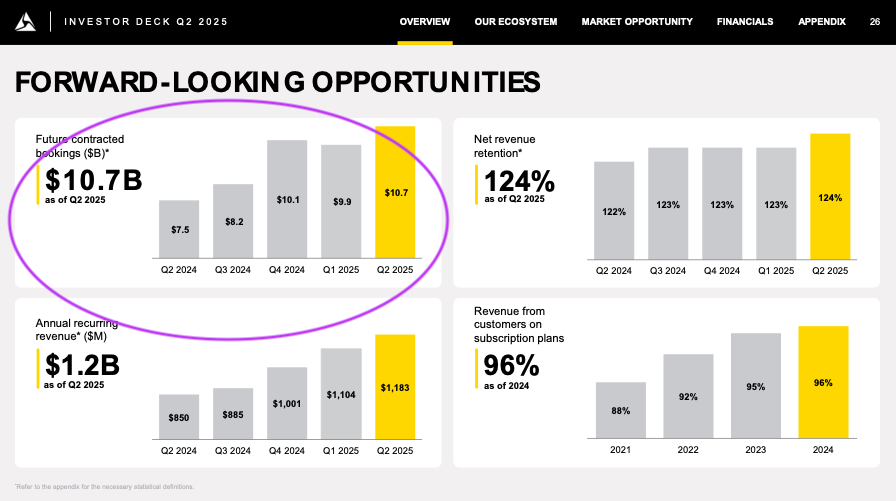
Remaining performance obligations (RPO): contracted revenue not yet recognized under accounting rules.
While it can be helpful to examine them on a year-over-year basis, we tend to look at them on a sequential or quarter-to-quarter basis because they provide visibility into the company’s revenue pipeline.
Rising backlog and RPO levels support a rising revenue stream, while falling figures for those metrics indicate slowing or falling revenue ahead. Where it can become tricky is when we see a backlog or RPO levels little changed in one quarter compared to the prior one. This can occur for a few reasons, including pending product introductions, and because of that, our preference is to have two quarters of data to determine if a trend of higher or lower revenue is unfolding. If we see backlog and RPO growth stagnating, it can be a signal that the same is likely for forthcoming revenue and earnings.
That is why we pay close attention to those figures when companies like ServiceNow NOW, Axon AXON and the like report their quarterly results. Fortunately, as you can see in the charts below, both have rising RPO levels:
In addition to examining these figures for individual companies, we do the same for industry data as well when it is published by an industry trade association or other third party. For example, ACT Research publishes monthly backlog levels for the medium and heavy-duty truck industry, while the Railway Supply Institute (RSI) American Railway Car Institute Committee (ARCI) publishes quarterly railcar backlog levels.
Similar to our comments about rising and falling backlog or RPO levels for individual companies, industry-level figures and their trends reveal a larger picture and can signal when a basket of stocks may be coming into or going out of favor. The examples we provided for the truck and railcar sectors would be of keen interest to investors in companies like Paccar PCAR and Daimler Truck DTRUY or Greenbrier GBX, Trinity Industries TRN and FreightCar America RAIL.
More Pro Portfolio
- New TJX Price Target After Reminder of Tariff Protections
- We're Calling This Ad Name Up to the Bullpen, With a Caveat
- Weekly Roundup: Weekly Roundup: Portfolio Advances as Powell Leaves Rate Cut Door Open
At the time of publication, TheStreet Pro Portfolio was long NOW and AXON.
