Weekly Roundup: Treading Carefully Among the Knowns and Unknowns
For the market to move sustainably higher, we will likely need to see a successful test of recent lows. Here's what we're focused on as we near the end of the first quarter.
You've reached your free article limit
You've read 0 of 1 free Pro articles.
It was a mixed week for the stock market, but in the end, a late push higher on Friday led the S&P 500 and the Nasdaq Composite to finish up week over week. While only a modest increase for the Nasdaq Composite, it snapped a multi-week streak of declines. Despite that modest progress, the relative strength index (RSI) levels for both market barometers moved higher leaving them a further distance from being oversold. To us, that means the near-term opportunities aren’t as robust, especially since we’ve seen little movement in S&P 500 consensus EPS forecasts for the June quarter.
Even Nvidia NVDA CEO Jensen Huang’s GTC 2025 keynote failed to get Wall Street excited. We thought it was more reaffirming than something that knocked your socks off. Granted Fed Chair Powell had some initially soothing words for the market, but when we puzzled through his presser comments and the Fed’s updated set of projections, our conclusion was that upcoming data will tell us how many rate cuts we’re likely to get this year. We continue to see the June Fed policy meeting as the one to focus on.
In last week’s Roundup, we laid out our concerns for that, and what we saw this week, including quarterly results and guidance from several companies, including FedEx (FDX), Nike (NKE), and Accenture (ACN), reaffirmed those. We’ll continue to monitor those quarterly consensus expectations, and they could move a bit more as Wall Street publishes updated EPS figures for those three companies and the few others that reported this week.
Because we are closing in on the end of the quarter, over the next few weeks we will be watching for company earnings pre-announcements. While do not expect across-the-board pre-announcements, signs of consumer belt-tightening, inflation pressures, and business uncertainty are a recipe for potential revenue shortfalls and margin pressures. As we saw when Nvidia NVDA recently reported, despite guiding revenue higher, margin pressures did not go unnoticed by Wall Street. And Nvidia wasn’t the only one.
At the same time, to move sustainably higher, we will likely need to see the market successfully test its recent lows. Potential catalysts for that include next week’s Flash March PMI data, negative earnings pre-announcements, and the start of both March-quarter economic data and Trump reciprocal tariffs. Recognizing these known knowns and understanding there could be one or two unknown unknowns that appear, we will continue to tread carefully, playing chess not checkers with the market. That means picking our spots carefully while hunting for more new blood in the Bullpen.
Catching Up on the Portfolio This Week
For most of the week, the TheStreet Pro Portfolio’s performance closed the gap between it and the S&P 500 even further compared to last week and the week before. However, Friday’s program loss by Lockheed Martin LMT to Boeing (BA) weighed on LMT shares heavily. We gave our take on this, including why even though it was a disappointment it would be wrong to think Lockheed is down and out.
During the week, we scooped up additional shares of Marvell Technology MRVL at $68.20 following supportive comments from Corning (GLW) and Nvidia’s GTC 2025 event, including CEO Jensen Huang’s keynote. Later in the week, we used the upward move in Mastercard MA shares to begin unwinding that position given growing concerns for consumer spending prospects. We also downgraded Mastercard to a Four rating and plan to reduce the position further should the shares rebound closer to $545 or more signs point to consumer spending declining faster than expected.
If you missed our comments about Google’s GOOGL announced acquisition of cybersecurity firm Wiz, Inc. for $32 billion, you can find them here. After initiating Palantir PLTR to the portfolio at $79.11, this week we added TJX Companies TJX to the Bullpen. We made that move because we like the company’s positioning with emerging consumer preferences, but we’ll want to have a better sense of tariffs and their impact before we make any move.
Closing out the week, our cash position is ~7% of the portfolio’s assets but given our concerns about prospects for June-quarter guidance comments as part of the upcoming March-quarter earnings season, we wouldn’t mind having some additional cash on hand. Should the opportunity emerge, we may be inclined to take it, be it with MA shares or another position or two in the portfolio. Near-term we’ll also continue to remain owners of the inverse ETF positions.
Now let’s see what Wall Street had to say this week about the portfolio’s holdings:
Evercore ISI lifted its Apple AAPL price target to $275 from $260 as it sees the company “positioned to sustain mid-single digit sales and low-to-mid teens free cash flow and EPS growth over the next several years with less volatility."
Stifel lowered its price target on Costco COST to $1,035 from $1,075 but kept its Buy rating on the shares. The firm's survey work shows U.S. consumer spending intentions remain positive, though they worsened sequentially in March and February relative to January levels. The same survey findings continue to favor Costco over other retailers.
Scotiabank initiated coverage of Microsoft MSFT with an Outperform rating and a $470 price target. The firm cites the company's "position as a leading horseman of the AI revolution," which it thinks will drive sustainable fundamental growth and account for nearly 60% of incremental revenue in FY 27.
Tigress Financial lifted its MSFT target to $595 from $550 as it has become incrementally bullish on Microsoft’s AI development and integration prospects.
Truist reiterated its $205 price target for Nvidia shares but grumbled it would have liked more details on customer build plans.
JPMorgan upped its rating on Vulcan Materials VMC to Overweight from Neutral with a $285 price target.
This Week's Portfolio Videos
We cover a lot of ground during the week in our Daily Rundowns. If you happened to miss one or more of them, here are some helpful links:
Monday, March 17: This New AI Report Could Shape Nvidia Keynote
Tuesday, March 18: Previewing Nvidia, Jensen Huang's Focus for GTC 2025
Wednesday, March 19: Why the Fed’s June Meeting Will Be the One That Really Matters
Thursday, March 20: Keep Your Eyes on This Holding as More Consumer Companies Report
Other videos from this week include:
TheStreet: Tesla's March deliveries could trigger further drop in the stock
TheStreet: What to expect from the Fed moving forward
Schwab Network: Fighting 'Uncertainty' in the Market, Fed's Rate Cut Picture
Cheddar: How Jerome Powell's Fed Decision Can Help Those Anxious About the Market
Key Global Economic Readings
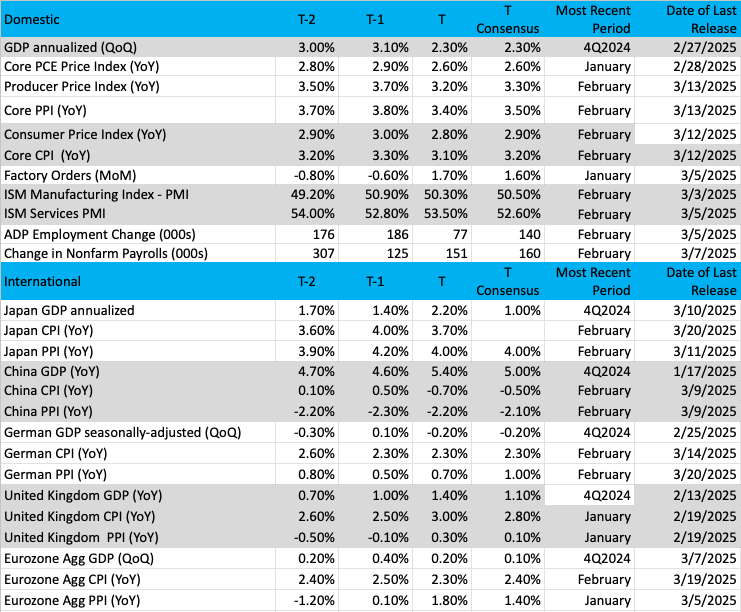
(Note: T is the most recent period, T-1 is the prior period's reading and T-2 is two periods back, the intent being to illustrate any trends)
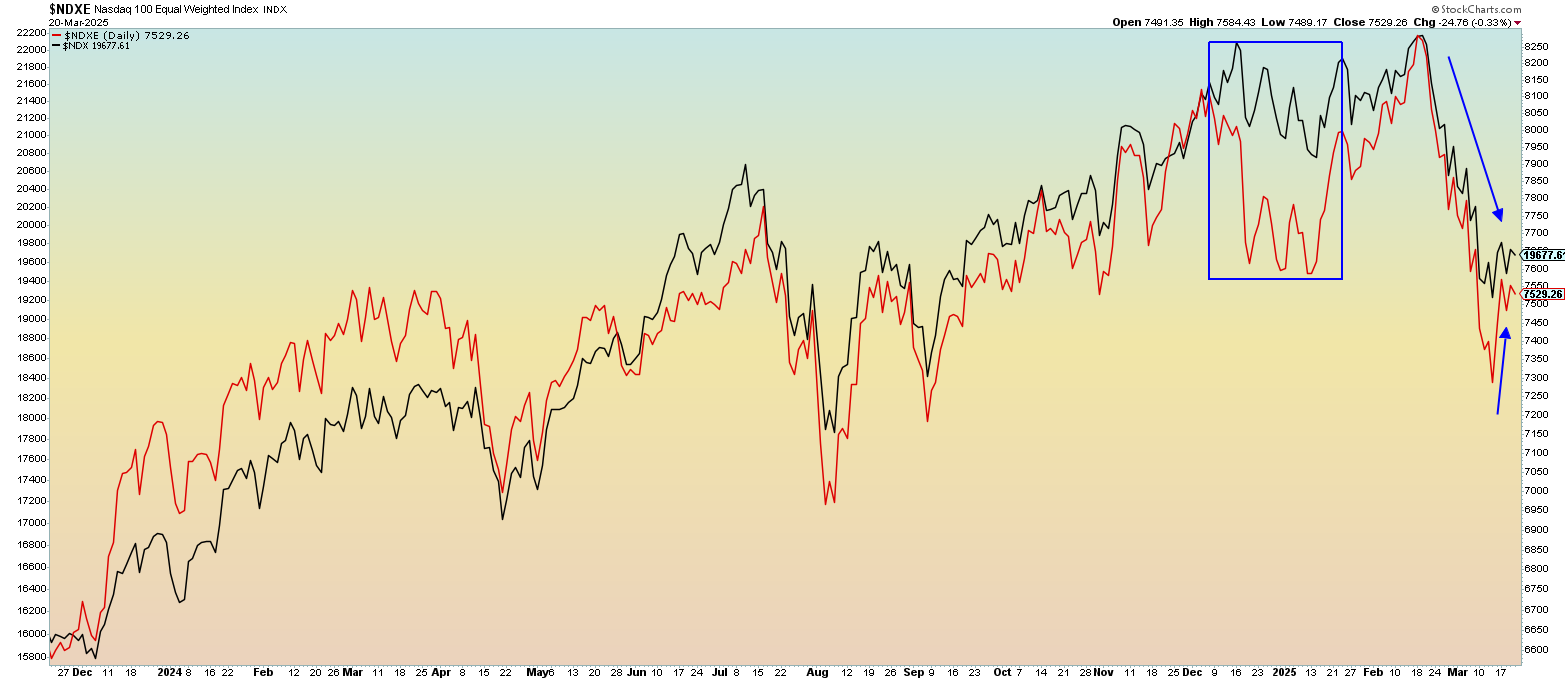
Chart of the Week: The Nasdaq 100
With all the publicity that the Magnificent Seven receives daily, we wondered just how much influence these names have on the Nasdaq 100 and the stock market in general. Separating the Nasdaq 100 (NDX) and the equal-weighted Nasdaq 100 (NDXE) shows quite a different picture today than it did last year. The chart tells us the influence is significant from this group, and they are causing the rest of the market to falter.
Let’s review what equal weight is all about. The NDXE is an index that weights every member of the Nasdaq 100 with an equal contribution regardless of market cap. So, Apple gets one vote but so does Uber, which pales in comparison to market capitalization. The reason we compare NDX with equal weight is to measure if the entire index is moving together or if the heavyweights are doing all the lifting.
The Mag 7 makes up nearly 14 trillion dollars of market cap (as of 2024), about 30% of the S&P 500, but 50% of the Nasdaq 100! That is truly remarkable that with every move by the Nasdaq 100 half of it can be explained by the Mag 7 (in relative terms).
There have been times when the equal weight performed much better for a sustained period of time. Check out the early part of 2024, the red line is significantly above the black line.
Whew! OK, so back to the chart. The black line is the Nasdaq 100, and the red line is the NDXE. We saw severe underperformance by the equal-weight index late in 2024 and early 2025 but the tables turned. Sure, the NDXE is down but on a relative basis, but it is doing somewhat better than the NDX. For 2025, the NDXE is barely down 1%, and the NDX is off by better than 6.2%. That is a meaningful difference and is explained by better performance from the other 93 names in the Nasdaq 100 (on a relative basis).
No question that the influence of the Mag 7 can spread to other indexes and markets, but if the lack of performance from this group continues, look for the continued exodus of funds from these companies to continue in the months ahead, as fund managers flock to where money can be made. The best days of the Mag 7 may be behind them.
Other charts we shared with you this week were:
Monday, March 17: S&P 500 - Now for the Follow Through
Monday, March 17: Microsoft (MSFT) - Here's What Microsoft Needs to Make a Move
Tuesday, March 18: United Rentals (URI) - Can United Rentals Get a Lift?
Wednesday, March 19: TJX Cos. (TJX) - Checking In on an 'Old Friend'
Thursday, March 20: Alphabet (GOOGL) - Alphabet Still Not Making the Grade
The Week Ahead
We are on the road to closing out March and the first quarter and as we look at next week’s calendar one of the more important data points we’ll be focusing on is Monday’s Flash March PMI data from S&P Global. It’s the first hard look at the economy during the month, and what it says about inflation as well as job creation and new order demand will tell us quite a bit about the vector and velocity of the economy. It should also help settle the difference between the Atlanta Fed’s GDPNow model calling for -1.8% GDP for the March 2025 quarter vs. the 3.0% figure furnished by the New York Fed’s Nowcast model.
We will also get the February figures for Personal Income & Spending and the PCE Price Index. However, we view the PCE data as somewhat dated given the timing of the March Flash PMI data on Monday and the February PCE Price Index data on Friday. When we look through the February Personal Spending data, the various line items it contains should give us a more granular look at consumer spending than the February Retail Sales report.
In between those bookending economic reports, we’ll also be keeping an eye out for updates to the GDPNow and other models published by the Atlanta Fed and other Federal Reserve banks.
Here's a closer look at the economic data coming at us next week:
U.S.
Monday, March 24
· S&P Global Flash PMI – March (9:45 AM ET)
Tuesday, March 25
· FHFA Housing Price Index – January (9:00 AM ET)
· S&P Case-Shiller Home Price Index – January (9:00 AM ET)
· Consumer Confidence – March (10:00 AM ET)
· New Home Sales – February (10:00 AM ET)
Wednesday, March 26
· MBA Mortgage Applications Index – Weekly (7:00 AM ET)
· Durable Goods Orders – February (8:30 AM ET)
· EIA Crude Oil Inventories – Weekly (10:30 AM ET)
Thursday, March 27
· Initial & Continuing Jobless Claims – Weekly (8:30 AM ET)
· International Trade & Inventories (Advance) – February (8:30 AM ET)
· GDP – 4Q 2024 (3rd estimate) – 8:30 AM ET
· Pending Home Sales – February (10:00 AM ET)
· EIA Natural Gas Inventories – Weekly (10:30 AM ET)
Friday, March 28
· Personal Income & Spending, PCE Price Index – February (8:30 AM ET)
· University of Michigan Consumer Sentiment Index (Final) – March (10:00 AM ET)
International
Monday, March 24
· Japan: Jibun Bank Flash PMI - March
· Eurozone: HCOB Flash PMI - March
· UK: S&P Global Flash PMI - March
Tuesday, March 25
· Eurozone: New Car Registrations – February
· Germany: Ifo Business Climate - March
Wednesday, March 26
· UK: Inflation Rate - February
Thursday, March 27
· China: Industrial Profits – February
· Eurozone: Loans to Companies, Households – February· European Commission Forecasts
Friday, March 28
· Japan: Housing Starts – February
· UK: Retail Sales – February
· Eurozone: Economic Sentiment, Consumer Confidence - March
Despite President Trump saying on Friday that there will be some flexibility with his April 2 reciprocal tariff plan, as companies start closing their books for the first quarter, we’ll be watching for earnings pre-announcements next week and the following one. In our prior Weekly Roundup, we laid out why we suspect the S&P 500 consensus EPS growth expectations for Q2 2025 were aggressive. And after what we saw this week from Nike (NKE), FedEx (FDX), and Accenture (ACN), we continue to think that is the case.
As we keep an eye out for any pre-announcements, we will be interested in the investment banking discussion that will be a part of Jefferies’s (JEF) earnings next week. With that in mind, we’ll also closely follow the developments of CoreWeave’s (CRWV) expected IPO pricing next Thursday. Late this week, reports indicated orders have been placed for all the available shares. With several days to go in the roadshow, this suggests the offering could price above the targeted $47-$55 range. A successful pricing and follow-on performance would be a shot in the arm for the larger IPO market as well as for our shares of Morgan Stanley MS, one of the book-runners on the deal.
Here's a closer look at the earnings reports coming at us next week:
Monday, March 24
· Close: KB Home (KBH)
Tuesday, March 25
· Open: Canadian Solar (CSIQ), McCormick (MKC)
· Close: GameStop (GME)
Wednesday, March 26
· Open: Chewy (CHWY), Cintas (CTAS), Dollar Tree (DLTR), Paychex (PAYX)
· Close: Jefferies (JEF), Petco Health and Wellness (WOOF)
Thursday, March 27
· Open: Winnebago (WGO)
· Close: lululemon (LULU)
Portfolio Investor Resource Guide
· Economic Data: Here's a List of Links to the Key Economic Data We Closely Watch
· Investing Terminology: 16 Key Terms Club Members Should Know
· 10-Ks: Want to Know About a Stock? Read the Company's Reports
· 10-Qs: Unlock the Numbers and Key Information Behind Your Stock With the 10-Q
· Income Statement: Our Cheat Sheet to Understanding This Financial Document
· Balance Sheet, Cash Flow Statements, and Dividends: How to Know If a Company Is Off-Kilter? Read Its Balance Sheet
· Valuation Metrics: Everyone Wants a Value. Here's How Investors Can Find
· Thematic Investing 101 Webinar
The Portfolio Ratings System
1 - Buy Now (BN): Stocks that look compelling to buy right now.
2 - Stockpile (SP): Positions we would add to on pullbacks or a successful test of technical support levels.
3 - Holding Pattern (HP): Stocks we are holding as we wait for a fresh catalyst to make our next move.
4 - Sell (S): Positions we intend to exit.
