Weekly Roundup: Stocks Sharply Rebound, but Are We Out of the Woods Yet?
TheStreet Pro Portfolio made great strides this week, with multiple double-digit gainers.
You've reached your free article limit
You've read 0 of 1 free Pro articles.
The stock market tallied its best performance in the last several weeks, with all the major market indexes moving higher. Leading the way was the Nasdaq Composite with a more than 6% gain followed by the S&P 500’s more than 4% move higher. Recognizing the way those two indexes are constructed and the meaningful weightings of Apple AAPL, Microsoft MSFT, Nvidia NVDA, Amazon AMZN, Alphabet GOOGL, and Meta META, explains why TheStreet Pro Portfolio also had such a strong showing. As we’ll discuss below, the portfolio also benefited from outsized performance in several other holdings this week as well.
That’s the good news.
The less good news is the stock market is still in the red year-to-date and even though the portfolio narrowed its gap to the S&P 500, it, too, is still in the red so far this year. However, when we review recent data, including earnings reports and conference calls this week from portfolio holdings and others that touch them, our view is that we remain well positioned for what lies ahead. By that, we mean areas of the economy and the market where businesses, consumers, and other entities will continue to spend and invest.
We will continue to connect the dots as corporate earnings season accelerates further next week. But we will also be updating our take on the economy as April data starts to get published. At the same time, we will be listening for meaningful progress on trade deals, not just lip service. With one eye on those changes, the other will continue to watch technical levels for both the S&P 500 and the Nasdaq Composite. Both face potential resistance levels with their 50-day moving averages, about 2% higher than where they closed this week.
While we enjoyed the market rebound this week, we recognize that we are not out of the woods just yet and don’t want to be lulled into a false sense of security. We’ll continue to walk the prudent path with the portfolio, and as active investors continually update our thinking as new data is available.
Be sure to catch our "Signals" Alert saturday as it is chock full of insightful data points for the portfolio and its holdings. And if you haven’t consumed this week’s Stocks & Markets Podcast with Freedom Capital’s Jay Woods, we highly recommend that you do.
Have a great weekend, and we’ll see you bright and early on Monday!
Catching Up on the Portfolio This Week
The strong move in the S&P 500 and Nasdaq Composite this week permeated throughout TheStreet Pro Portfolio, which narrowed the gap between its year-to-date results and that for the S&P 500. While both are still down for the year, we are encouraged by the number of confirming data points collected over the week as it relates to the portfolio’s holdings. Double-digit outperformers for the week included ServiceNow NOW, Palantir PLTR, Marvell Technology MRVL, and Universal Display OLED. Other standout positions included Amazon AMZN, Dutch Bros BROS, Meta META, Nvidia NVDA, and Qualcomm QCOM.
We didn't make any trades in the portfolio this week, but the market rebound meant the actions we took in the last few weeks to scoop up more shares of Apple AAPL, Elastic ESTC, Marvell, Meta, Universal Display, and Qualcomm, were nicely timed. The benefit of those moves, along with favorable data points furnished by SAP SE SAP, LG Display LPL, Amazon, Nvidia and others, as well as solid earnings and guidance from ServiceNo, United Rentals URI, and Alphabet GOOGL propelled the portfolio higher this week.
Even though we did not do any buying or selling this week, we did make a few price target adjustments following quarterly results from ServiceNow, United Rentals, and Alphabet. We nudged targets on each of those names lower as we imbue them with a more conservative outlook for the market and S&P 500 EPS growth prospects in the coming quarters. We’ll continue to revisit those prospects based on several factors, including the speed of the economy, consumer spending, business investment prospects, and the duration of tariffs.
In Friday’s Daily Rundown video, we discussed some of the above, but also the impact tariffs, inflation pressures, and slowing consumer spending are having on certain sectors. As more companies report, we are likely to see further adjustments to consensus EPS expectations (see The Week Ahead below for more detailed thoughts on this topic).
For that reason, as well as the potential for markets to become overly excited about trade deal prospects, we’ll remain owners of our inverse ETFs for now. We will continue to evaluate their role in the portfolio and recognize at some point they will either be converted into cash or as a source of funds for a new or existing position. How soon that happens will be determined by what we learn in the coming days.
Now let’s see what Wall Street had to say about the portfolio’s holdings over the last few days:
Oppenheimer lifted its Alphabet target to $200 from $185 as did Citi and BofA while Piper Sandler and KeyBanc both lifted theirs to $195 from $185. Meanwhile, Susquehanna trimmed its target to $220 from $225.
Telsey Advisory reduced its Amazon price target to $235 from $275 but reiterated its Outperform rating. The firm believes Amazon should continue to gain profitable market share by leveraging its Prime member base, small business relations, and technological edge. We do not disagree with that assessment.
Shares of ServiceNow saw a trio of price target increases to $1,025 from UBS, BMO Capital, and Mizuho. Baird took its NOW target to $1,150 from $1,010, while Goldman Sachs boosted its to $1,150 from $1,050.
Truist raised its price target for United Rentals to $786 from $732.
HSBC upgraded its rating on Waste Management shares to Buy from Hold with a target of $265, up from $210.
This Week's Portfolio Videos
We cover a lot of ground during the week in our Daily Rundowns. If you happened to miss one or more of them, here are some helpful links:
Monday, April 21: What We're Looking for With Busy Earnings Week Ahead
Tuesday, April 22: These Updates Will Be Far More Telling Than Earnings Releases
Wednesday, April 23: TheStreet Stocks & Markets Podcast #2: Bear Market Blues With Jay Woods
Thursday, April 24: Here's What We're Focused on With Alphabet's Results
Friday, April 25: What We're Watching for in a Big Earnings Week
Key Global Economic Readings
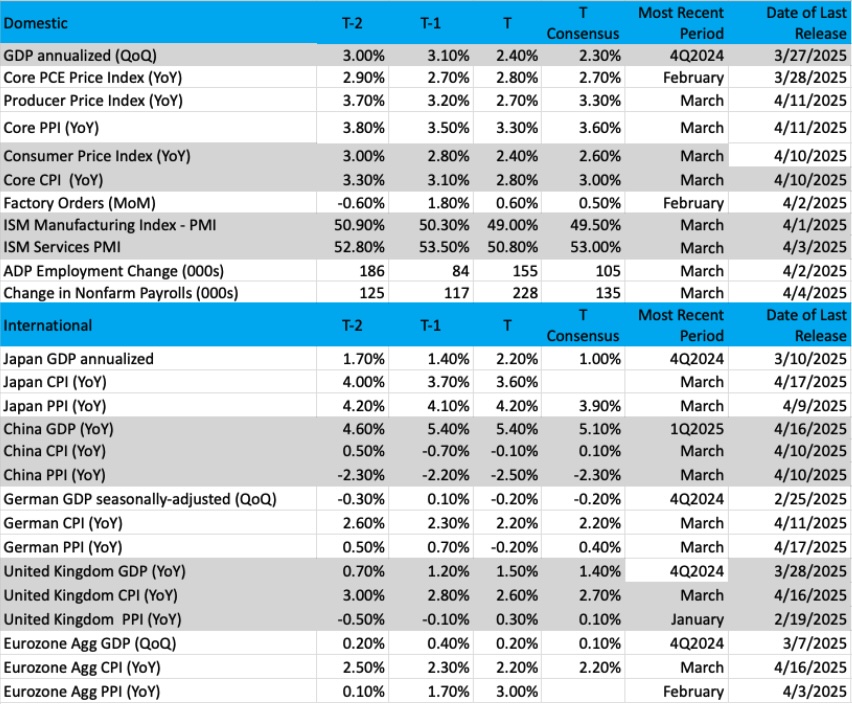
(Note: T is the most recent period, T-1 is the prior period's reading and T-2 is two periods back, the intent being to illustrate any trends)
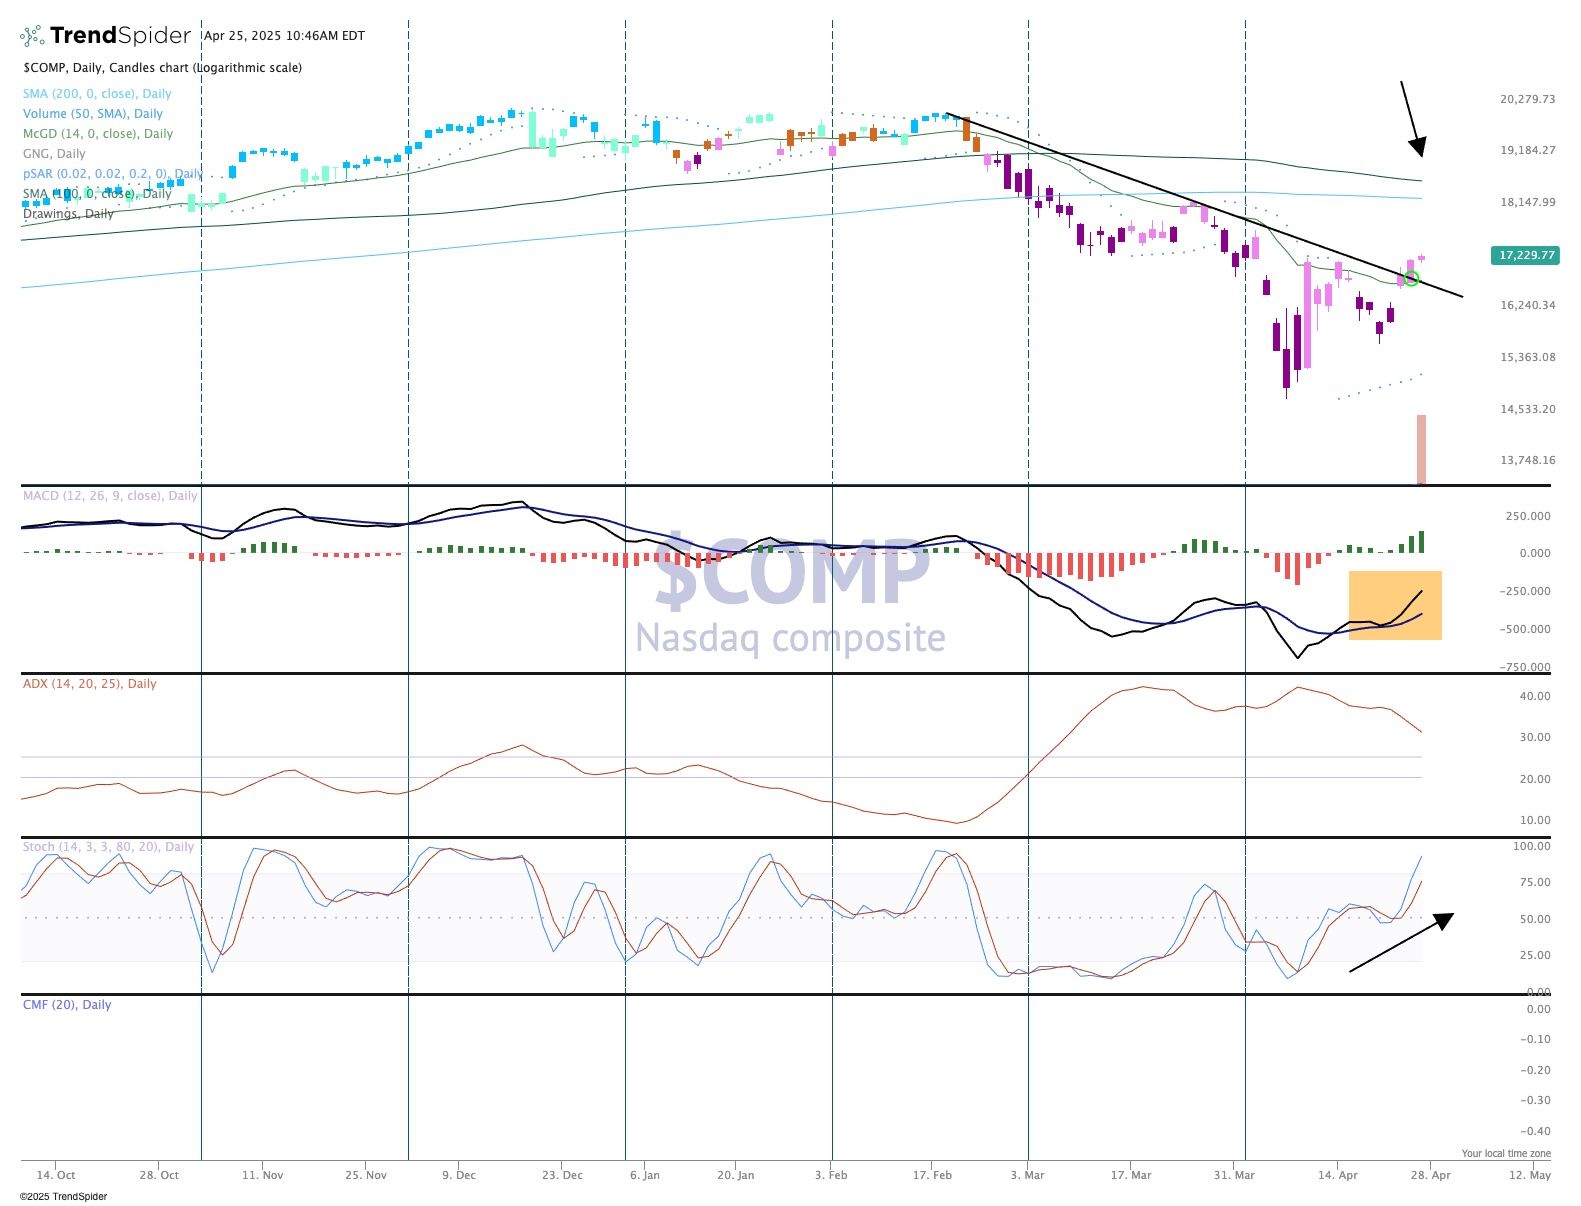
Chart of the Week: The Nasdaq Composite
The Nasdaq Composite (COMP) has made great strides over the last several days to position itself for a positive month of April. Just 10 days ago that goal seemed to be a dream, as the index was down more than 10% as traders/investors were completely dumbfounded by tariff news and ongoing developments. But as the worries and fears started to recede there was a "calmer" effect that persuaded the bulls to get back up off the ground.
This past week has seen truly amazing action, with very large moves up and down. On strong volume. After starting Monday in the hole, buyers came back strong and delivered some nice upside action spread across many sectors. Of course, the Nasdaq is very heavy on technology companies, and that group was the main target of selling earlier this month.
But with earnings season here and many stocks washed out the bar is low for firms to move up if they can simply meet or slightly beat expectations. This coming week we will hear from more big names in technology, including Apple, Microsoft, Amazon, and Meta (all names in TheStreet Pro Portfolio).
As for the technical picture, it appears the COMP has positioned itself for a move to the 200-day and 100-day moving averages (arrow). MACD (moving average convergence/divergence) is on a strong buy signal and momentum is on the move up, with the stochastics at levels not seen since February.
If the market can see through the worries and uncertainty, then this index has some room to move higher toward the 18,500 level where it will meet some heavy resistance.
Other charts we shared with you this week were:
Monday, April 21: S&P 500 - S&P 500 Chart Offers Plenty to Be Worried About
Monday, April 21: American Express (AXP) - We're Still Giving American Express Some Credit
Tuesday, April 22: Axon Enterprise (AXON) - A Pullback Appears to Be an Opportunity
Wednesday, April 23: ServiceNow (NOW) - Will Earnings Answer the Questions on ServiceNow?
Thursday, April 24: Alphabet (GOOGL) - Alphabet Needs a 'Shake Down' of the Bears
The Week Ahead
Next week brings several critical pieces of April economic data, ones that we, the Fed and the market will be keenly interested in. Folks will also be eyeing the March core PCE Price Index data, however, given the timing of tariffs, the initial findings of S&P’s Flash April PMI, and the latest Fed Beige Book, we’ll be more focused on April-facing data and tariff duration.
The April data will start to form initial GDP expectations for the current quarter, and we’ll be able to size those up against the initial print for the March quarter that will also come next week. As we parse the April data, we’ll be mindful of what they indicate about the speed of the economy but also how they pertain to the Fed’s dual mandate. For us that means triangulating the vector and velocity of the economy, inflation, and job gains.
This weekend we enter the blackout period ahead of the Fed’s next policy decision on May 7, which means no Fed speakers to offer their take on next week’s April Manufacturing PMI and April employment data or the following week’s April Service PMI figures.
We’ll also note that as we exit this week, the CME FedWatch Tool shows the market expecting four 25-basis point rate cuts across the five policy meetings between June and December. Based on data received thus far, that looks to be a tad aggressive. We continue to think the data leading up to the Fed’s June policy meeting and its comments exiting that meeting, including the next update of its economic projections, could reset those rate-cut expectations. Between now and then, we will continue to listen to the data and update our thinking as required.
As we do that, we’ll be keeping a close eye on developments in Washington. Our focus will remain on executed trade deals and their impact, rather than headlines that have the potential to deliver a head fake.
Here's a closer look at the economic data coming at us next week:
U.S.
Tuesday, April 29
· Retail, Wholesale Inventories (Advanced) – March (8:30 AM ET)
· FHFA Housing Price Index – February (9:00 AM ET)
· S&P Global Case-Shiller Home Price Index – February (9:00 AM ET)
· JOLTs Job Openings & Quits – March (10:00 AM ET)
· Consumer Confidence – April (10:00 AM ET)
Wednesday, April 30
· MBA Mortgage Applications Index – Weekly (7:00 AM ET)
· ADP Employment Change Report – April (8:30 AM ET)
· GDP, Employment Cost Index – 1Q 2025 (8:30 AM ET)
· Personal Income & Spending, PCE Price Index – March (8:30 AM ET)
· Pending Home Sales – March (10:00 AM ET)
· EIA Crude Oil Inventories – Weekly (10:30 AM ET)
Thursday, May 1
· Chllenger Job Cuts – April (7:30 AM ET)
· Initial & Continuing Jobless Claims – Weekly (8:30 AM ET)
· S&P Global Final Manufacturing PMI – April (9:45 AM ET)
· ISM Manufacturing PMI – April (10:00 AM ET)
· Construction Spending – March (10:00 AM ET)
· EIA Natural Gas Inventories – Weekly (10:30 AM ET)
Friday, May 2
· Employment Report – April (8:30 AM ET)
· Factory Orders – March (10:00 AM ET)
International
Monday, April 28
· China – Industrial Profits (March)
Tuesday, April 29
· Germany: GfK Consumer Confidence – May
· Eurozone: Economic Sentiment, Consumer Confidence - April
Wednesday, April 30
· Japan: Retail Sales, Industrial Production, Housing Starts – March
· China: NBS Manufacturing & Non-Manufacturing PMI – April
· China: Caixin Manufacturing PMI - April
· Germany: Retail Sales – March
· Eurozone: Consumer Inflation Expectations – March
· Eurozone: GDP (Flash) – 1Q 2025
Thursday, May 1
· Japan: Jibun Bank Manufacturing PMI – April
· UK: Bank of England Consumer Credit - March
Friday, May 2
· Eurozone: HCOB Manufacturing PMI – April
· Eurozone: Inflation Rate (Flash) - April
This week roughly 24% of the S&P 500 reported their latest quarterly results and in most cases updated their guidance. Well, hold onto your hats, because next week that figure jumps to 36%, which means that by the end of next week, ~72% of that market basket will have reported earnings. That will give us a very firm look at updated EPS expectations for the June quarter and a good peek into H2 2025.
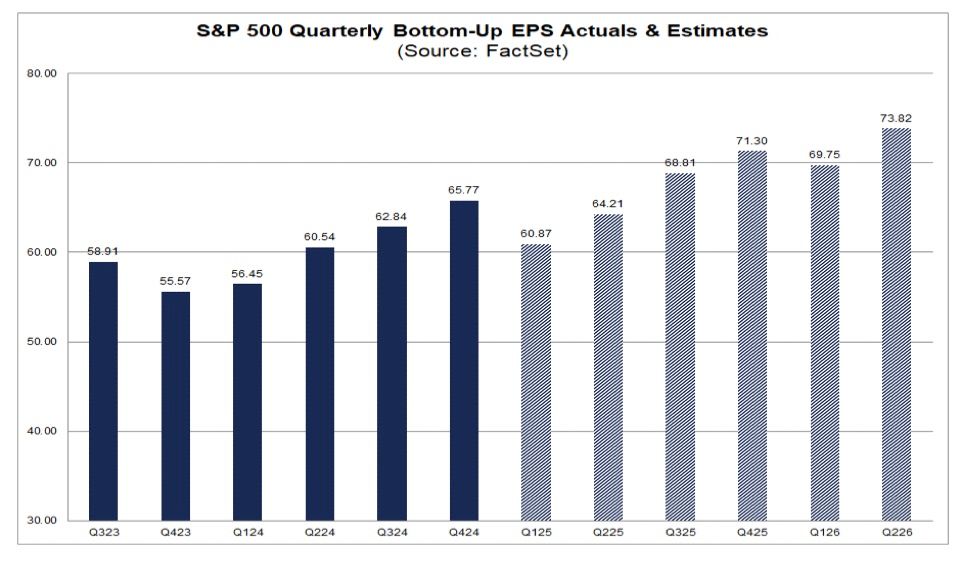
Examining the latest consensus quarterly EPS figures tallied and published by FactSet, we find that after 36% of the S&P 500 has reported, the March-quarter EPS figure has inched up some, but the rate of expected sequential growth for the June quarter has fallen to ~5.5%, down from over 9% in March. That revision likely reflects guidance revisions to the downside from the likes of Kimberly-Clark (KMB), Proctor & Gamble (PG), Clorox (CLX), and others. Looking at the companies poised to report next week that have a high probability of being impacted by tariffs or slowing consumer spending, we could see that sequential EPS growth rate moving even lower.
With the pace of earnings reports even more fast and furious next week, we will strive to connect the dots from as many reports as we can even as we focus our energy on the portfolio holdings reporting. As you can see below, we have 10 positions issuing their quarterly results and updating their guidance during the next five trading days. Odds are we will be making some price target revisions, just like we did this week.
Also not lost on us is the aggregate weighting of Apple, Meta, Amazon, and Microsoft in both the S&P 500 and the Nasdaq Composite. As we said in Friday’s video, based on what we’ve seen thus far, the risk of a downside surprise across all four of those companies appears limited. However, as we connect the dots across the reports we get Monday through Wednesday morning, we’ll have a better read on that level of risk.
Here's a closer look at the earnings reports coming at us next week:
Monday, April 28
· Open: Domino’s Pizza (DPZ)
· Close: Alexandria RE (ARE), Crane (CR), F5 Networks (FFIV), Harmonic (HLIT), Nucor (NUE), NXP Semiconductor (NXPI), Waste Management (WM).
Tuesday, April 29
· Open: American Tower (AMT), Coca-Cola (KO), Corning (GLW), General Motors (GM), Hilton (HLT), Honeywell (HON), JetBlue (JBLU), Kraft Heinz (KHC), Labcorp (LH), LGI Homes (LGIH), PayPal (PYPL), Sherwin Williams (SHW), SoFi Technologies (SOFI), Spotify (SPOT), Sysco (SYY).
· Close: Booking Holdings (BKNG), First Solar (FSLR), Lending Club (LC), Mondelez (MDLZ), PPG Industries (PPG), Qorvo (QRVO), Snap (SNAP), Starbucks (SBUX), Visa (V).
Wednesday, April 30
· Open: Caterpillar (CAT), GE Healthcare (GEHC), Lincoln Electric (LECO), Martin Marietta (MLM), Stanley Black & Decker (SWK), Vulcan Materials (VMC), Wingstop (WING), Yum China (YUMC), Yum! Brands (YUM)
· Close: American Water Works (AWK), Cheesecake Factory (CAKE), Crown Castle (CCI), Equinix (EQIX), KLA Corp. (KLAC), Meta (META), MGM Resorts (MGM), Microsoft (MSFT), Qualcomm (QCOM), Robinhood Markets (HOOD), Tanger Factory (SKT).
Thursday, May 1
· Open: Builders FirstSource (BLDR), Church & Dwight (CHD), CNH Industrial (CNH), CVS Health (CVS), Eli Lilly (LLY), Estee Lauder (EL), Granite Construction (GVA), Hershey (HSY), Mastercard (MA), McDonald’s (MCD), Paker Hannifin (PH)
· Close: Amazon (AMZN), Apple (AAPL), Block (XYZ), Ingersoll-Rand (IR), Lending Tree (TREE), Motorola Solutions (MSI), Omega Health (OHI), Universal Display (OLED).
Friday, May 2
· Open: Apollo Management Group (APO), Chevron (CVX), Eaton (ETN), Exxon Mobil (XOM), Piper Sandler (PIPR), Terex (TEX), Wendy’s (WEN).
Portfolio Investor Resource Guide
· Economic Data: Here's a List of Links to the Key Economic Data We Closely Watch
· Investing Terminology: 16 Key Terms Club Members Should Know
· 10-Ks: Want to Know About a Stock? Read the Company's Reports
· 10-Qs: Unlock the Numbers and Key Information Behind Your Stock With the 10-Q
· Income Statement: Our Cheat Sheet to Understanding This Financial Document
· Balance Sheet, Cash Flow Statements, and Dividends: How to Know If a Company Is Off-Kilter? Read Its Balance Sheet
· Valuation Metrics: Everyone Wants a Value. Here's How Investors Can Find
· Thematic Investing 101 Webinar
The Portfolio Ratings System
1 - Buy Now (BN): Stocks that look compelling to buy right now.
2 - Stockpile (SP): Positions we would add to on pullbacks or a successful test of technical support levels.
3 - Holding Pattern (HP): Stocks we are holding as we wait for a fresh catalyst to make our next move.
4 - Sell (S): Positions we intend to exit.
