Weekly Roundup: Sharpening Our Pencils for More Market Tests Ahead
After another harsh week, we're hoping for opportunities and preparing for more declines.
You've reached your free article limit
You've read 0 of 1 free Pro articles.
 NYSE Trader
It was another tough week for the market, with declines of more than 1% across the board for the major market averages. It also marked the fourth consecutive week-to-week decline for the S&P 500 and the Nasdaq Composite, which led to both crossing below their respective 200-day moving averages and deeper into oversold territory by some measures.
As we pen this week’s Roundup, based on their relative strength index (RSI) levels, neither is classically oversold… as of yet.
As we explained in Friday’s Portfolio video, we will be watching weekend developments for the U.S.-Iran conflict and the Strait of Hormuz very carefully over the weekend. With RealClearPolitics graphics showing President Trump’s approval rating at 42.3% with 55.2% disapproving as of March 18; reports that the ask of another $200 billion for the conflict with Iran is not likely to be passed; the U.S. National Debt moving above the $39 trillion mark; and consumers starting to feel the pinch of higher gas prices, it is possible some positive developments could be had.
If that is what we see, that would be a catalyst for the market to reclaim some lost ground and for us to put some capital to work.
However, developments in the other direction or things staying status quo as next week’s trading begins would mean that inflationary forces and their impact will continue to weigh on the market. It will also have folks, including us, on the lookout for negative earnings pre-announcements as we get closer to the end of the month and current quarter.
If you missed our discussion about consensus S&P 500 earnings expectations for 1H 2026, we would recommend that you read it or even revisit it if you perused it earlier this week. Pouring over the latest FactSet Earnings Insight report, published a day earlier than usual, we see Q1 2026 consensus EPS expectations actually ticked higher to $70.85 from $70.73 the week before. The same activity was had for Q2 2026, putting the consensus at $77.40, up from $77.09.
We find this curious given the growing number of reports about higher gas prices starting to impact consumer sentiment and spending, but in digging deeper into the sector analysis, we find EPS expectations for the Info Technology and Energy sectors stepped up week over week. Yet, week over week, no change for Consumer Discretionary EPS growth expectations. This will serve as a warning for us when the time comes to put some capital to work and re-examine the usefulness of the ProShares Short S&P 500 ETF (SH) in the Portfolio.
Enjoy your weekend and Saturday's signals alert. See you back here, bright and early on Monday.
Catching Up on the Portfolio This Week
The market’s continued trade-off was felt across the Portfolio this week, however, its week-over-week decline was less than that for the S&P 500's. We chalk that up to the week-over-week gains in our ProShares Short S&P 500 ETF (SH) shares as well as positive movements for Axon (AXON) , Bank of America (BAC) , Eaton (ETN) , Labcorp (LH) , Morgan Stanley (MS) and a few others.
Still, those positives were offset by the declines over the last few days in the shares of United Rentals (URI) , Welltower (WELL) , Netflix (NFLX) , Nvidia (NVDA) , Meta (META) and Broadcom (AVGO) . In Friday’s video, we discussed some shopping list candidates, but also that Microsoft (MSFT) shares were flirting with their $385 panic point on Friday. Subject to where the shares close on Friday, some prudent action may be called for and that could be a source of capital for any shopping list activity in the near-term.
Turning to the EPS Diplomats basket, it did not escape the market’s continued move lower this week. Gains in Lumentum (LITE) and SiTime (SITM) shares were more than offset by the drop in gold and silver prices that pummeled shares of those exposed companies in the basket. As a reminder, with our next reconstitution set for March 31 to April 1, we will be increasing the Portfolio’s initial exposure to 4% from 2%. That effort could mean we purposefully raise some cash either a few days ahead of time or as we execute the reconstitution process.
While we made no trades for the Portfolio this week, we shared that as the herd comes around and thinks about the fallout of higher energy costs on consensus EPS expectations and consumer demand, we’re fleshing out additional candidates for the Bullpen. With that in mind, on Thursday, we added shares of Applied Materials (AMAT) to the Bullpen with a note that, given the fundamental outlook, we are closely watching the technical setup amid the larger market backdrop.
In terms of the Portfolio’s cash level, given the lack of trades this week, one might expect it to be unchanged, but that would neglect the payment of Alphabet’s (GOOGL) latest quarterly dividend of $0.21. Those keeping track will note that it is the fourth dividend payment of that size and suggests we could hear of a modest increase in the coming months. Before we close out March, we’ll collect other dividend payments from Meta, Bank of America, Waste Management (WM) , Eaton and Broadcom.
Now let’s turn and see what others on Wall Street had to say about the Portfolio’s holdings during this shortened but electric week for the market:
Monday – Barclays lifted its Eaton target by $4 to $354. BofA dropped its American Express (AXP) target by $1 to $381. BNP Paribas upgraded ServiceNow (NOW) shares to Outperform from Neutral, and Jefferies reinstated coverage of Eaton shares with a Buy rating and a $430 target.
Tuesday – BofA reiterated its Buy rating on Nvidia shares and its $300 target. Cantor has the same target for NVDA shares, but reiterated its Top Pick call on the shares.
Wednesday – Tigress Financial increased its Meta price target to $945 from $935. UBS lifted its Palantir (PLTR) target to $200 from $180. Truist nudged its Nvidia target to $287 from $283. Wells Fargo made a larger increase for its Waste Management target, taking it to $273 from $250. Citi resumed coverage of Netflix shares with a Buy rating and an $115 target.
Thursday – Raymond James lifted its Nvidia target to $323 from $291 while New Street added the shares to its Best Ideas List.
This Week's Portfolio Videos
We cover a lot of ground during the week in our Daily Rundowns. If you happened to miss one or more of them, here are some helpful links:
Tuesday, March 17: Is the Market Missing Something Big?
Wednesday, March 18: Stocks & Markets Podcast: Inside Helus Pharma’s Breakthrough Depression Drugs
Thursday, March 19: How We're Defending Against a Prolonged Energy Shock
Friday, March 20: 7 Stocks We are Watching Closely and 1 Flirting With its Panic Point
Key Global Economic Readings
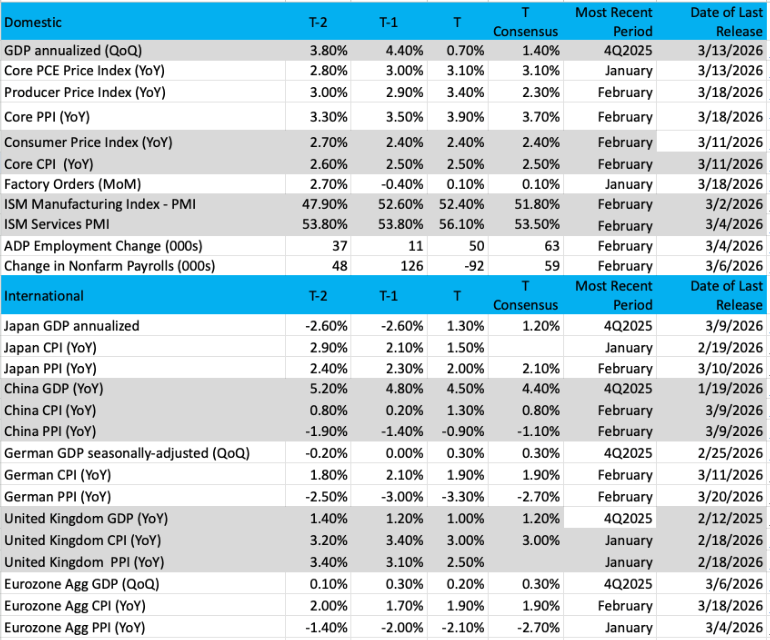
(Note: T is the most recent period, T-1 is the prior period's reading, and T-2 is two periods back, the intent being to illustrate any trends.)
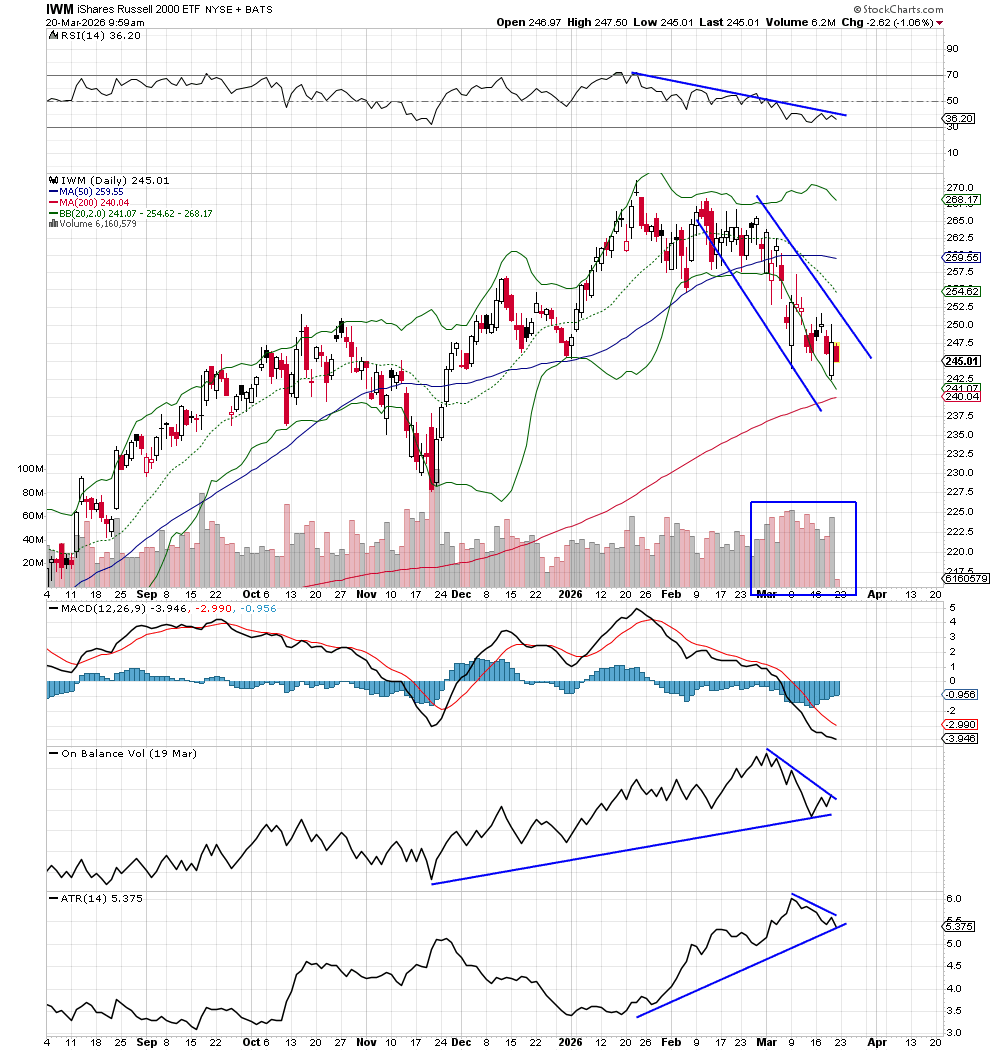
Chart of the Week: The Russell 2000
We have talked in the past about the importance of small-cap stocks to the rest of the market. The Russell 2K, or the (IWM) ETF, remains the leader for all U.S. equity markets. That is a heavy burden to carry, but with 2,000 stocks in their universe, it makes sense these stocks should lead. Now, we are not talking about massive market capitalized companies here — the total of all companies comes to about $2.7 trillion to $3 trillion, which is less than the top company in the world, which would be NVIDIA.
But we can understand why focusing on 2,000 companies rather than just one can show us broad leadership, institutional sponsorship and sector performance across several groups. Small caps are heaviest in financials, industrials and healthcare, those three make up about half the index, followed closely by info tech and consumer discretionary. When the IWM is doing well, we often see all five groups bullish and moving higher.
But the chart of the IWM has been challenged of late. Recently, the index surged from the $220s to a new high at $270, a 20%-plus move from Thanksgiving to late January. That was a stunning move and yes, it brought the rest of the market along with it.
However, what goes up does come down, and the IWM is now flirting with the 200-day moving average, something we have not seen since crossing above it last August. We can see on the chart that this important moving average is starting to flatten out at the $240 level, so that could be the next target for the IWM, about 2.5% lower.
The chart shows a downtrend firmly in place. Lower highs and lower lows, but looking at the lower indicators tells us there is more trouble brewing. The ATR, or the average true range, is the volatility of the chart. In this case, the IWM volatility has been rising, which means wider ranges. As we know, most investors/traders do not like wide ranges and prefer to sell. RSI in the top chart is weak but not quite oversold yet, and the 200-day moving average is in view. A break and confirmation here is going to mean more downside for the small caps.
Other charts we shared with you this week were:
Monday, March 16: S&P 500 - Bears Make Their Biggest Move Yet
Monday, March 16: 6 Charts Show We Could Be in for a Rude Energy Price Awakening
Monday, March 16: Axon - Is Axon's Slump a Sign of Risk to the Stock or the Market?
Tuesday, March 17: Costco (COST) - Costco's Momentum Starts to Build Again
Wednesday, March 18: Apple (AAPL) – What to Watch With Apple
Thursday, March 19: Morgan Stanley - Morgan Stanley Could Struggle if the Economy Falters
The Coming Week
The coming week brings one of the next data points we’ve been waiting for, given developments so far in March: the Flash March PMI report from S&P Global. As you know, we tend to scour this monthly data set, but with the climb in oil prices and ships piling up along the Strait of Hormuz, we’ll be tracking what it reveals about input costs and the ability to pass them through, as well as any potential supply hiccups.
On Monday, we’ll get the January Construction Spending report, which is likely to reflect some of the severe winter weather from earlier in the quarter. Given our comments about the shares of United Rentals in Friday’s video, we’ll want to revisit them as we digest this report.
On Friday, March 27, we will get the February Personal Income & Spending data as well as the PCE Price Index data for the month. While we will peruse the data, as we explained above, the March facing data in the Flash PMI report will be, in our view, far more revealing. Later that day, we’ll get the final read of the Michigan Consumer Sentiment Index, and in that data, inflation expectations are what we’ll be focusing on.
Here's a closer look at the economic data coming at us next week:
U.S.
Monday, March 23
Construction Spending – January (10:00 AM ET)
Tuesday, March 24
Productivity & Unit Labor Costs (Revision) – Q4 2025 (8:30 AM ET)
S&P Flash Manufacturing & Services PMI – March (9:45 AM ET)
New Home Sales – February (10:00 AM ET)
Wednesday, March 25
MBA Mortgage Applications Index – Weekly (7:00 AM ET)
Durable Orders – February (8:30 AM ET)
Import/Export Prices – February (8:30 AM ET)
EIA Crude Oil Inventories – Weekly (10:30 AM ET)
Thursday, March 26
Initial & Continuing Jobless Claims – Weekly (8:30 AM ET)
EIA Natural Gas Inventories – Weekly (10:30 AM ET)
Friday, March 27
Personal Income & Spending – February (8:30 AM ET)
PCE Price Index – February (8:30 AM ET)
Retail & Wholesale inventories (Advanced) – February (8:30 AM ET)
GDP (Third Estimate) – Q4 2025 (8:30 AM ET)
University of Michigan Consumer Sentiment Index (Final) – March (10:00 AM ET)
International
Monday, March 23
Eurozone: Consumer Confidence (Flash) – March
Tuesday, March 24
Japan: Inflation Rate – February
Japan: S&P Global Flash Manufacturing & Services PMI – March
Eurozone: HCOB Flash Manufacturing & Services PMI - March
UK: S&P Global Flash Manufacturing & Services PMI - March
Wednesday, March 25
UK: Inflation Rate - February
Thursday, March 26
Japan: Leading Economic Index (Final) – January
Friday, March 27
China: Industrial Profits – February
UK: Retail Sales - February
We have a modicum of corporate earnings next week, but under normal conditions, there isn’t any one in particular that would be a market mover. This time around, however, the market will be focusing on comments about the impact from the U.S.-Iran conflict, higher energy prices and potential supply chain issues. We’ll be in that camp, but we will also be assessing the degree to which the guidance from those companies falls short of market expectations and the market reaction in their shares.
As we do that, we’ll also be on the lookout for negative earnings pre-announcements from companies as they get ready to shut their books for Q1 2026 and get ready to report those results in the coming weeks.
Here's a closer look at the earnings reports coming at us next week:
Tuesday, March 24
Open: Smithfield Foods (SFD)
Close: GameStop (GME) , KB Home (KBH)
Wednesday, March 25
Open: Chewy (CHWY) , Cintas (CTAS) , Kingsoft Cloud (KC), Paychex (PAYX) ,
Close: Beyond Meat (BYND) , HB Fuller (FUL) , Jefferies (JEF) , Worthington Steel (WS)
Thursday, March 26
Open: Pony AI (PNY), Shoe Carnival (SCVL)
Close: Oxford Industries (OXM)
Friday, March 27
Open: Carnival (CCL)
Portfolio Investor Resource Guide
Economic Data: Here's a List of Links to the Key Economic Data We Closely Watch
Investing Terminology: 16 Key Terms Club Members Should Know
10-Ks: Want to Know About a Stock? Read the Company's Reports
10-Qs: Unlock the Numbers and Key Information Behind Your Stock With the 10-Q
Income Statement: Our Cheat Sheet to Understanding This Financial Document
Balance Sheet, Cash Flow Statements and Dividends: How to Know If a Company Is Off-Kilter? Read Its Balance Sheet
Valuation Metrics: Everyone Wants a Value. Here's How Investors Can Find
Thematic Investing 101 Webinar
Like the Benefits of ETFs? Let’s Talk About Models
The Portfolio Ratings System
1 - Buy Now (BN): Stocks that look compelling to buy right now.
2 - Stockpile (SP): Positions we would add to on pullbacks or a successful test of technical support levels.
3 - Holding Pattern (HP): Stocks we are holding as we wait for a fresh catalyst to make our next move.
4 - Sell (S): Positions we intend to exit.
Stocks & Markets Podcast Links
Some helpful links if you prefer to catch the podcast on the go, in the car or wherever. Be sure to give it a like or thumbs up and leave a review if you’re so inclined. We’d appreciate it.
Related: Wall Street Turns on India as Oil Shock Drives 'Unprecedented Crisis'
More Pro Portfolio
- We're Adding to Two Financial Holdings, While Upgrading One
- We're Tracking 24 Portfolio Signals Across 9 of Our Investing Themes
- Weekly Roundup: Iran and Energy Worries Take Their Toll on the Market
At the time of publication, TheStreet Pro Portfolio was long SH, AXON, BAC, ETN, LHm MS, URI, WELL, NFLX, NVDA, META, AVGO, MSFT, LITE, SITM, GOOGL, WM, AXP, NOW, PLTR, COST and AAPL.
