Weekly Roundup: S&P Drops 2%, Portfolio Barely Blinks. Here's Why.
The Portfolio held up well against fallout from the U.S.-Iran conflict as the market caught up to our thinking on multiple holdings.
You've reached your free article limit
You've read 0 of 1 free Pro articles.
 Market Fear
As we moved into March, the final month of the current quarter, the market and investors were hit with news that the U.S. and Israel launched a major military strike on Iran. Despite some initial reports that Iran was back-channeling a peaceful solution, it became increasingly clear that the prospects for a quick end to the conflict aren’t likely.
Defense Secretary Pete Hegseth acknowledged on Wednesday that the conflict could last eight weeks. Thursday, Energy Secretary Chris Wright sought to calm anxiety about gas prices, predicting that the conflict could end in the next few weeks. Friday, President Trump said there would be no deal to end the U.S. war against Iran without an “unconditional surrender” by Iran. Also Friday, Politico reported the U.S. Central Command asked the Pentagon to support operations against Iran for at least 100 days but likely through September.
Those reports, as well as ones for the shipping standstill at the Strait of Hormuz, led prices to soar. One-fifth of the world’s oil, a significant amount of natural gas, and other items, including fertilizer, move through the Strait. U.S. crude oil on Friday posted its biggest weekly gain in futures trading history, with West Texas Intermediate futures closing at $90.90 per barrel and Brent Crude at $92.69 per barrel. Qatar’s energy minister, Saad al-Kaabi, told The Financial Times that Gulf exporters would halt production in days if tankers cannot pass the Strait of Hormuz and that crude prices could reach $150 per barrel in the coming weeks if oil tankers were unable to pass through the Strait.
We’ve already witnessed sharp moves in gasoline and diesel prices, as well as those for jet fuel. Between now and the end of the Q1 quiet period, we will be listening closely to what companies say about the impact of those and other price pressures, including President Trump’s higher 15% global tariff, and whether they will try to pass those pressures on to customers or feel the impact on their margins. We’ll also continue to listen for what is said about AI adoption and usage, as well as changes in demand and cost expectations relative to guidance issued earlier in the current quarter.
These developments are raising many questions about inflation, potential demand destruction, and other related issues. We’ve positioned the Portfolio to follow where money is being spent, be it by companies, individuals, or government entities, layering in thematic and structural tailwinds. That benefited us this week, and it also kept us patient with the market’s “SAAS-pocalypse” overreaction.
In Monday’s February Monthly Roundup, we trotted out one of our favorite Warren Buffett quotes about when to be fearful and when to be greedy as investors. As we close out the week, the Fear & Greed Index is flashing “Fear,” but is it knocking on the door of "Extreme Fear." The Cboe Volatility Index finished the week over 28, and the S&P 500 has pushed through its 100-day moving average near 6838. Neither the S&P 500's RSI near 38, nor the Nasdaq Composite reading near 41 tell us they are in an oversold condition. The next layer of support for the S&P 500, the 200-day moving average, is near 6583, roughly 2% lower. For the Nasdaq Composite support comes about 1% lower near 22,087.
We will see what transpires over the weekend, and whether it ratchets higher geopolitical tensions and concerns for inflation, global economies, demand, and earnings risk. We will continue to evaluate opportunities to put capital to work, but we won’t be haphazard. We’ll proceed carefully as we update our assessment based on incoming data, new developments, and fresh information.
Enjoy your weekend, and Saturday’s Signals alert. See you back here, bright and early on Monday. Monday afternoon, I’ll be appearing on Taking Stock live from the NYSE at the market close, and Tuesday morning I’ll be at the opening bell ringing at the Nasdaq.
Catching Up on the Portfolio This Week
While the S&P 500 sank 2% this week, we’re pleased to share that double-digit moves in shares of Palantir (PLTR) and ServiceNow (NOW) as well as mid-to-high single-digit gains in Marvell (MRVL) , Axon (AXON) , American Express (AXP) , Microsoft (MSFT) , and the First Trust Nasdaq Cybersecurity ETF (CIBR) led the Portfolio to be little changed week over week. Even though the market’s decline took some of the year-to-date gains out of the EPS Diplomats basket, at more than +8.3%, it is well ahead of the year-to-date loss of 1.5% for the S&P 500.
While we made no trades with the Portfolio and its holdings this week, we reiterated our price targets and ratings for Costco (COST) and Marvell, and upgraded Broadcom (AVGO) to a One rating. We also picked up a nice dividend payment from TJX Cos. (TJX) , which was credited to the Portfolio’s cash position. During the week, we shared other upcoming dividends the Portfolio will collect over the remaining weeks in the current quarter.
Now let’s see what others on Wall Street had to say about the Portfolio’s holdings this week:
Monday – Scotiabank increased its Welltower (WELL) price target to $236 from $214. Netflix (NFLX) was reinstated at JPMorgan with an Overweight rating and a $120 target. Goldman Sachs upgraded Dutch Bros (BROS) to Buy from Neutral but maintained its $75 target. Morgan Stanley moved shares of Nvidia (NVDA) back to its top chip pick, replacing Micron (MU) .
Tuesday – Rosenblatt Securities boosted its Palantir target to $200 from $150.
Wednesday – Mizuho upped its Welltower target to $231 from $216.
Thursday – DA Davidson initiated coverage of Dutch Bros with a Buy rating and a $67 target. Tigress Financial raised its Nvidia target to $360 from $350. Broadcom shares picked up multiple price target increases to $450-$525 from Citi, BofA, Bernstein, Rosenblatt, and JPMorgan.
Friday – JPMorgan raised its Costco target to $1,060 from $1,050, BTIG took its target to $1,125, and Bernstein lifted its COST target to $1,170 from $1,150. Marvell shares received multiple price target increases, with JPMorgan's at $135, Rosenblatt's at $140, and Benchmark taking its to $130. Morgan Stanley boosted its Broadcom target to $470 from $462.
This Week's Portfolio Videos
We cover a lot of ground during the week in our Portfolio videos. If you happened to miss one or more of them, here are some helpful links:
Tuesday, March 3: It's Clear Target Is 'Lost' After Latest Earnings Miss
Friday, March 6: It’s Not Just Oil That Goes Through the Strait of Hormuz
Key Global Economic Readings
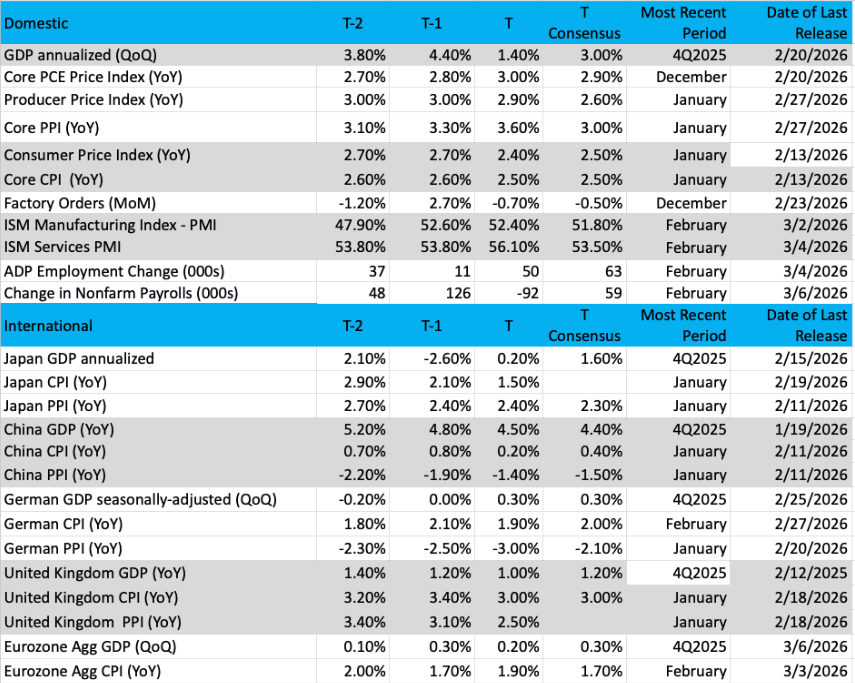
(Note: T is the most recent period, T-1 is the prior period's reading, and T-2 is two periods back, the intent being to illustrate any trends.)
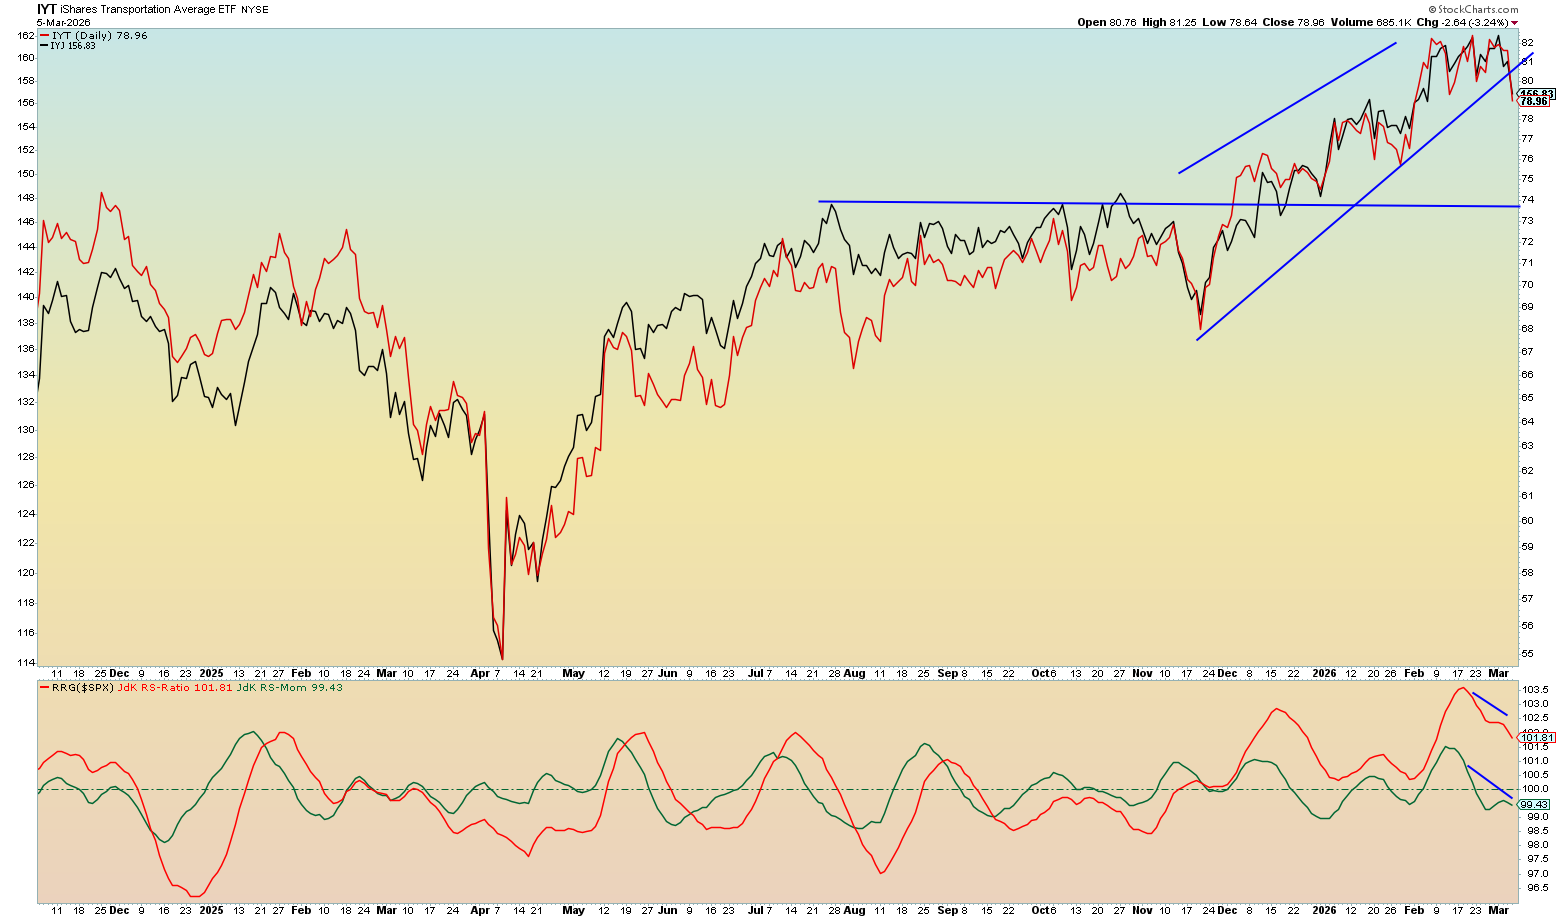
Chart of the Week: iShares Transportation Average ETF
Transportation stocks generally "drive" the economy to prosperity. The index shown here today is the (IYT) , or the iShares Transportation Average ETF. This is a very similar index to the vaunted Dow Transports, which is a collection of 20 stocks that move stuff or people around the world. In this index we find airlines, trucking/rental, delivery, and railroads. Think Union Pacific (UNP) , United Airlines (UAL) , Ryder (R) , FedEx (FDX) . The Transports are 20 companies that reflect movement in our economy, they do the "blocking and tackling" while the Industrials are often on the offense and getting the headlines. But these two indexes are joined at the hip.
There is an old adage that goes back some 100 years, the Dow Theory, which was framed by Charles Dow. It says prices are confirmed (up or down) by the Industrials and Transports to determine when a trend change signal occurs. In other words, when both indexes are performing poorly the rest of the market is either doing the same or will soon follow.
We bring this up today as we compare the Transports (in red, IYT) with the industrials (in black, IYJ, iShares U.S. Industrials ETF) to see if there is some correlation in their movements. As we can see in the chart below, these two indexes do tend to move together, but curiously it seems when the Transports jump out in front and move higher the Industrials lag, while when the Industrials lead on the downside the Transports lag.
This is important to note, because the Transports have performed better with good relative strength vs. the Industrials. Is that meaningful if the market turns lower? Yes, because we expect to see the Transports :catch up" to the Industrials eventually, which means poorer performance is ahead for these moving companies.
In late 2025, the two indexes were tightly correlated and moving up together, but now they seem ready to move down together.
One reason this could happen is the higher oil prices across the world, where crude has moved up nearly 55% in a month. This high input cost may put pressure on margins and thus smack down estimates for growth.
Other charts we shared with you this week were:
Monday, March 2: S&P 500 - Volatile Markets Rattle the Bulls
Monday, March 2:Marvell (MRVL) - Marvell's Chart Is Cryptic Ahead of Earnings
Tuesday, March 3: Costco (COST) - Costco Quietly Improves Its Position Ahead of Earnings
Wednesday, March 4: Idexx Labs (IDXX) - This Bullpen Name Remains on Our Watchlist
Thursday, March 5: Meta Platforms (META) - Taking a Longer View of Meta
The Week Ahead
Coming off the past week’s mixed bag of economic data that raised fresh questions about the speed of job creation despite an improving outlook for the services sector, next week brings multiple looks at inflation data. While we and others will pick over the January PCE Price Index data and both the CPI and PPI for February, given the first week of March’s surge in oil prices, odds are more than a few on Wall Street will be looking past those reports.
Based on the uptick in February wages found in Friday’s Employment Report and elevated levels of the Price Index figures in ISM’s February PMI reports, we are not expecting to see meaningful progress in the February CPI and PPI reports. If we do see those February figures tick higher for headline and core inflation, we are likely to hear comments from Fed officials become incrementally more hawkish despite the loss of jobs in February.
We’ve discussed reasons for not relying on any one particular data set, and that includes the Employment Report. Both February PMI reports from ISM and S&P Global, and ADP’s February Employment Change report all pointed to positive job growth during the month. While we can’t ignore the findings in the February Employment Report, which showed 92,000 jobs were lost and the Unemployment Report ticked up to 4.4%, we’ll be mindful of other job and wage indicators. Our goal will be to zero in on a truer picture of the jobs market, lest we be hoodwinked by statistical and methodology changes.
And as bad as the February Employment Report was, let’s remember the Fed tends to look at rolling three-month averages when it examines the data. On that basis, there was modest job growth in February compared to greater creation in January and the losses sustained between September and November. If we see that rolling three-month average dip into negative numbers without the impact of a government shutdown, we’ll have to parse Fed official comments even more closely.
Here's a closer look at the economic data coming at us next week:
U.S.
Monday, March 9
Consumer Inflation Expectations – February (10:00 AM ET)
Tuesday, March 10
NFIB Small Business Optimism Index – February (6:00 AM ET)
ADP Employment Change – Weekly (7:15 AM ET)
Existing Home Sales – February (10:00 AM ET)
Wednesday, March 11
MBA Mortgage Applications Index – Weekly (7:00 AM ET)
Consumer Price Index – February (8:30 AM ET)
EIA Crude Oil Inventories – Weekly (10:30 AM ET)
Thursday, March 12
Initial & Continuing Jobless Claims – Weekly (8:30 AM ET)
Producer Price Index – February (8:30 AM ET)
Housing Starts & Building Permits – February (8:30 AM ET)
Factory Orders – January (10:00 AM ET)
EIA Natural Gas Inventories – Weekly (10:30 AM ET)
Friday, March 13
Personal Income & spending – January (8:30 AM ET)
PCE Price Index – January (8:30 AM ET)
GDP (2nd Estimate) – Q4 2025 (8:30 AM ET)
JOLTs Job Openings & Quits – January (9:00 AM ET)
University of Michigan Consumer Sentiment Index (Prelim) – March (10:00 AM ET)
International
Monday, March 9
China: Producer Price Index, Inflation Rate – February
Japan: Eco Watchers Survey – February
Germany: Industrial Production - January
Tuesday, March 10
Japan: Household Spending – January
Japan: GDP – Q4 2025 (Final)
China: Imports/Exports – February
Germany: Imports/Exports - January
Wednesday, March 11
Japan: Machine Tool Orders – February
Germany: Inflation Rate (Final) - February
Thursday, March 12
China: Vehicle Sales - February
Friday, March 13
Germany: Wholesale Prices – February
UK: GDP, Industrial Production, Manufacturing Production – January
Eurozone: Industrial Production - January
With a little over three weeks remaining in the current quarter, we are at the tail end of what seems like an extended earnings season. SuRo Capital (SSSS) will be reporting next Tuesday, and we look forward to its updated net asset value per share plus what it has to say on the dividend front.
We’ll also focus on AI and data center-related comments from Hewlett Packard Enterprise (HPE) , Oracle (ORCL) , and Adobe (ADBE) . We’ll also be looking to see what, if anything, SentinelOne (S) has to say about AI and cybersecurity, including usage by bad actors to expand the scope and scale of their attacks. As we do more work on Bullpen resident Idexx Labs (IDXX) , we’ll also be listening for what Petco Health & Wellness (WOOF) has to say about pet spending. We’ll also drink in comments from other retailers, listening to what is discussed about recent geopolitical developments and their potential impact.
Here's a closer look at the earnings reports coming at us next week:
Monday, March 9
Close: Casey’s General (CASY), Hewlett Packard Enterprise (HPE)
Tuesday, March 10
Open: Kohl’s (KSS), United Natural Foods (UNFI)
Close: AeroVironment (AVAV), Oracle (ORCL), SuRo Capital (SSSS)
Wednesday, March 11
Open: Campbell Soup (CPB), Sprinkler (CXM)
Close: Petco Health & Wellness (WOOF)
Thursday, March 12
Open: Dick’s Sporting Goods (DKS), Dollar General (DG), Li Auto (LI), Ollie’s Bargain Outlet (OLLI)
Close: Adobe (ADBE), Lennar (LEN), SentinelOne (S), Ulta Beauty (ULTA)
Portfolio Investor Resource Guide
Economic Data: Here's a List of Links to the Key Economic Data We Closely Watch
Investing Terminology: 16 Key Terms Club Members Should Know
10-Ks: Want to Know About a Stock? Read the Company's Reports
10-Qs: Unlock the Numbers and Key Information Behind Your Stock With the 10-Q
Income Statement: Our Cheat Sheet to Understanding This Financial Document
Balance Sheet, Cash Flow Statements, and Dividends: How to Know If a Company Is Off-Kilter? Read Its Balance Sheet
Valuation Metrics: Everyone Wants a Value. Here's How Investors Can Find
Thematic Investing 101 Webinar
Like the Benefits of ETFs? Let’s Talk About Models
The Portfolio Ratings System
1 - Buy Now (BN): Stocks that look compelling to buy right now.
2 - Stockpile (SP): Positions we would add to on pullbacks or a successful test of technical support levels.
3 - Holding Pattern (HP): Stocks we are holding as we wait for a fresh catalyst to make our next move.
4 - Sell (S): Positions we intend to exit.
Stocks & Markets Podcast Links
Some helpful links if you prefer to catch the podcast on the go, in the car, or wherever. Be sure to give it a like or thumbs up and leave a review if you’re so inclined. We’d appreciate it.
