Weekly Roundup: S&P 500 Hits New Record as Year-End Trading Comes into View
Here's what we're watching for with earnings pre-announcements and other surprises on deck before the end of 2025.
You've reached your free article limit
You've read 0 of 1 free Pro articles.
In last week’s Roundup, we laid out why this week would be one of the quietest stock market weeks we’ve seen in some time. That's hardly a surprise, given how the Christmas and New Year’s Day holidays landed on the calendar this year, but quite a difference compared to the weeks leading up to it.
The lack of new meaningful data, which we attribute to the lack of fresh November or December data and no major corporate earnings reports, led the Volatility Index (VIX) to fall back to levels we haven’t seen in a little more than a year.
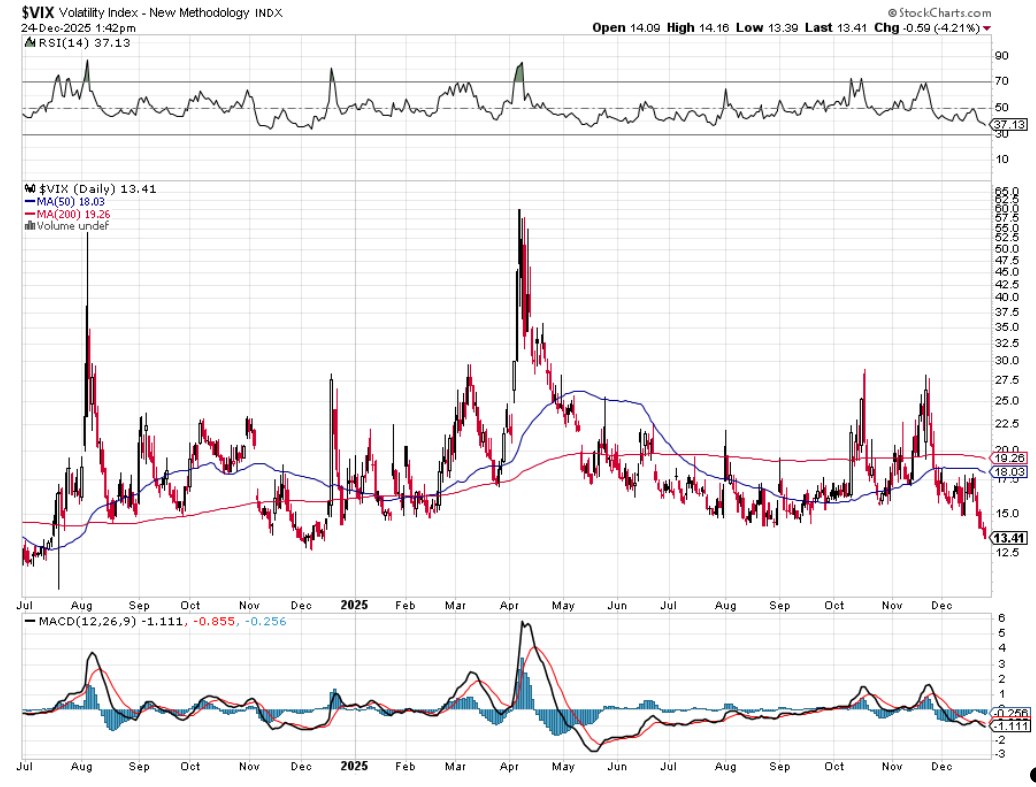
That double-digit week-over-week drop in the VIX, combined with lower-than-usual trading volumes, helped seasonal strength lift the market ahead of the Christmas holiday, with the S&P 500 closing at a fresh record high. That puts the number of record highs for that particular market benchmark near 40 for the year, not something many were expecting back when the market started to fall apart in February and accelerated further in March.
While the timeline for a potential Santa Claus rally begins with Friday's market action, we expect Friday’s market activity to be very subdued and trading volumes to be even lighter as folks either squeeze in a long weekend, brave holiday shopping returns and sales, or both. While we’ll be keeping an eye on the market, we’ll be recharging some but also working on the December Monthly Roundup and prepping for the start of 2026. As a reminder, we’ll be publishing the December Monthly Roundup on Friday, January 2.
Should we see a Santa Claus really emerge, it would add to the market’s gains, a nice development as we close out the year, but it would also mean a few other things.
First, it would extend the S&P 500’s P/E multiple that much further, after it hit 25.6x expected consensus 2025 EPS of $270.96 and 22.4x expected 2026 EPS of $309.83 with Wednesday’s market close. That 2025 multiple is not only higher than the 25.1 multiple the market peaked at in 2024, but outside of 2001 and 2020, it’s also the highest P/E multiple for the S&P 500. The 6% bounce back in the S&P 500 over the last five weeks has the Fear & Greed Index back in “Greed” mode from “Extreme Fear”.
However, when we look at the S&P 500’s relative strength index (RSI) level or the McClellan oscillators for Nasdaq and NYSE-listed stocks, neither is flashing an overbought condition. This tells us there is likely some additional room to run in the market. But with the VIX flashing investor complacency, we will want to remain vigilant so as not to be blindsided by any unexpected developments as we close out the year and enter a fresh one. That means we will continue to watch for earnings pre-announcements during the balance of this week and next, as well as any potential curveballs out of Washington.
Along those lines, we will also be following position sizes and RSI overbought levels for the Portfolio’s holdings. Heading into what we’ll call the Christmas “long weekend,” none of the Portfolio’s holdings are flashing an RSI level over 70. With a reading just over 69, the closest shares are the ones for Bank of America (BAC) , but we’ve also shared multiple times with you that should the BAC position size move past 4.5% some prudent and profitable portfolio management is likely. The same goes for American Express (AXP) , but you knew that.
We continue to think the December quarter earnings season, which will begin in earnest on the week of January 12 and accelerate in a meaningful way after the Martin Luther King Jr. holiday, could be a key time for the market. The market will want to see corporate guidance for 1H 2026 and the full-year that supports the more than 14% expected year-over-year jump in EPS growth baked into consensus 2026 EPS expectations. Stronger would be better, but the change in tax laws and accelerated depreciation, as well as the likelihood that management teams offer a conservative first cut to 2026 EPS, could lead to something else. All the more reason to keep our eyes and ears open over the coming weeks, not that you would expect anything different from us.
As we revisit those S&P 500 EPS growth forecasts, we’ll reset the earnings growth bar candidates will need to clear as part of our screening process. And with about 6.8% of the Portfolio’s assets in cash, barring any meaningful Portfolio management action, if we need to raise some additional cash, existing holdings with more modest EPS growth prospects could be a source of those funds. If that has you wishing for an updated set of earnings expectations for each Portfolio holding, we’re reading your minds, and we will furnish you with one on January 2 as well.
For now, remember that if you don’t put on a few pounds during the holidays, you may not be enjoying yourself to the fullest. At least, that’s what I tell myself.
See you back here on Monday, December 29, as we count down the final trading days of 2025.
Catching Up on the Portfolio This Week
Through Wednesday’s abbreviated trading session, the Pro Portfolio followed the market higher. Notable gains during those days were had in the shares of Marvell (MRVL) , Waste Management (WM) , Nvidia (NVDA) , Morgan Stanley (MS) , Alphabet (GOOGL) , and our newest addition, Broadcom (AVGO) .
Laggards included shares of ServiceNow (NOW) following its announced acquisition of cybersecurity company Armis, but we and as you’ll see below others, see the deal as a positive one for the company. Shares of SuRo Capital (SSSS) also traded off, but as we explained in a recent note to you, we should see a nice jump in the company’s net asset value per share as OpenAI concludes its next capital raise. We continue to rate NOW and SSSS shares as Ones.
Now let’s turn and see what others on Wall Street had to say about the Portfolio’s holdings during this shortened but electric week for the market:
Monday: Truist raised its price target on American Express to $420 from $395, Citi upped its Alphabet target to $350 from $343, and Citi also added an “upside 30-day catalyst watch on Marvell shares. Citi continues to rate MRVL shares a Buy with a $114 target.
Tuesday: Raymond James reiterated its Buy rating on ServiceNow shares, sharing that it sees the announced acquisition of Armis improving the company’s security and operational technology. In Tuesday’s video, we discussed the transaction, including what we’re angling to hear about when ServiceNow reports its December quarter. William Blair largely mimicked those comments as it reiterated its Outperform rating on NOW shares.
Wednesday: Citi likes the "industrial logic" of ServiceNow's acquisition of Armis, sharing its “adds predictive security features to the company's AI Control Tower offering”, reiterating its Buy rating and $250 target. Northcoast upgraded Costco shares to Buy from Neutral with a fresh $1,100 price target, which matches our own. Cantor Fitzgerald voiced its view that Nvidia and Broadcom are “ripe for outperformance” in 2026.
This Week's Portfolio Videos
We cover a lot of ground during the week in our Daily Rundowns. If you happened to miss one or more of them, here are some helpful links:
Monday, December 8: Preparing for a Visit From Santa Claus
Tuesday, December 9: This Holding Is Making a Big Move into Cybersecurity
Key Global Economic Readings
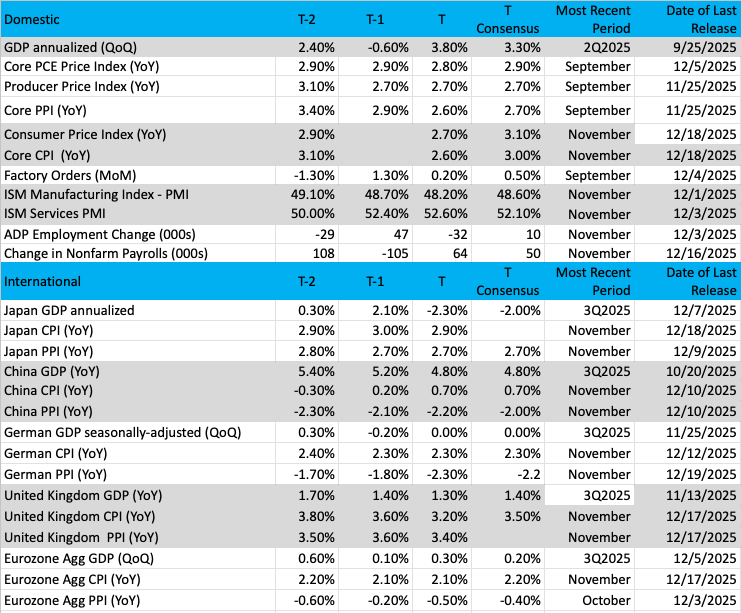
(Note: T is the most recent period, T-1 is the prior period's reading, and T-2 is two periods back, the intent being to illustrate any trends.)
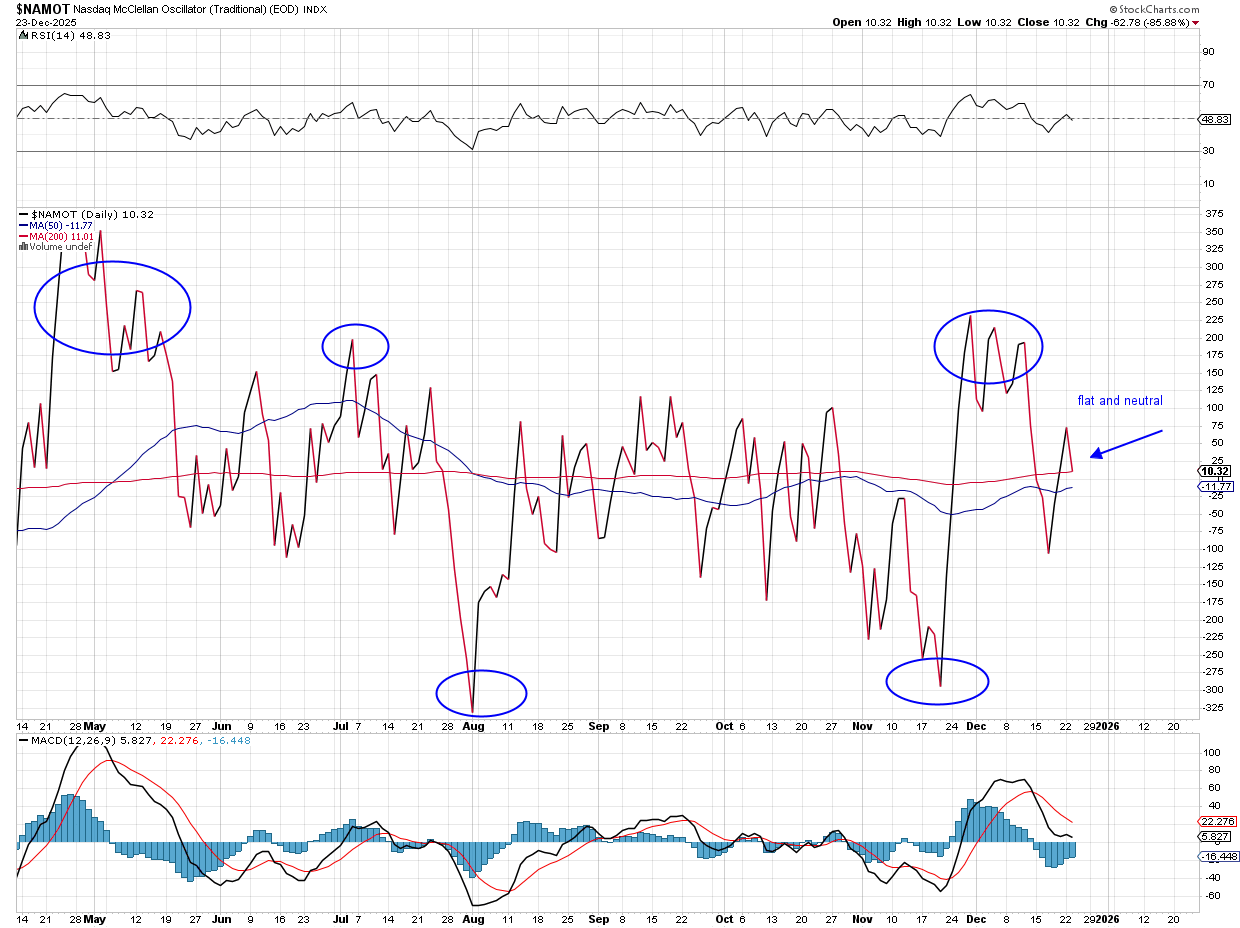
Chart of the Week: The McClellan Oscillator
After a strong start to the week, which extended from the prior week, one might expect the stock market to be overbought right now. However, if we look at certain indicators, that is truly not the case. Sure, the price action has been bullish as the indices knock on the door of an all-time high once again. Banks have been strong; metals are just on fire with gold/silver hitting record highs every day, while retail stocks have had a resurgence. Everything seems perfect.
But all is not right in the land of trading, as we look to one of the most important indicators: breadth. It is this indicator that directly tells us if there is more buying than selling. The price action does not give us this specific information, and it could be a bit misleading at times. Let me explain.
The breadth indicator we like to use is called the McClellan Oscillator, so named for a married couple who, back in the late 1960s, saw the up/down issues as extremely relevant to future price moves. Further, the oscillator captured more than this, like trends and market participation.
The origin of the McClellan Oscillator can be seen and heard right here.
The McClellan Oscillator has become a standard tool of technical analysis, widely used to help traders/investors interpret the health and status of a market trend (bullish or bearish). The oscillator at any point in time can signal certain conditions in the market that gives the analyst a huge advantage by siding with the trend. The data may not always be right in terms of timing, but as with anything, a high percentage of the time it is correct, and that is something useful.
The current state of the Nasdaq McClellan Oscillator is flat, nearly zero. We look for overbought and oversold readings on the oscillator, above +200 for a big overbought reading or below -250 for a juicy oversold condition. We have neither of those currently, the $NAMOT (Nasdaq McClellan Oscillator) is just at a rest stop, but we have no indication of what the next move might be.
With advancers/decliners in balance right now the market is in a stable condition, we’ll look for some movement later in the year and into 2026.
Other charts we shared with you this week were:
Monday, December 8: S&P 500 - A Rally Just in Time for Santa's Ride
Monday, December 8: Apple (AAPL) - Apple Gets Bullish New Price Target Courtesy of Option Flow
Tuesday, December 9: Eaton (ETN) - Trouble Is Brewing for This Holding
Wednesday, December 10: Bank of America - This Bank Holding Is Finally Getting Its Due
The Week Ahead
We have another quiet week on tap as we close the books on 2025 and get ready for 2026. It will also see us tracking the bulk of the potential progress for the expected Santa Claus rally that begins with the market close on December 24 and culminates on Monday, January 5.
For us, the coming days mean squeezing in some downtime before we kick off the new year. We’ll also be spending extra time on our December Monthly Roundup that we’ll share with you on Friday, January 2. As we work on that, we’ll keep our eyes and ears open for any earnings pre-announcements that are made, connecting them back to the Portfolio’s holdings as warranted.
Should a Santa Claus rally emerge, we will continue to monitor the Portfolio’s position sizes for American Express and Bank of America shares. When the markets closed on Christmas Eve, those respective levels stood at 4.39% and 4.45%, and should they eclipse the 4.5% level, we are likely to lock in some gains. We still have shares of Welltower (WELL) and Broadcom, two of our smaller positions, on our shopping list.
Here's a closer look at the economic data coming at us next week:
U.S.
Monday, December 29
Retail & Wholesale Inventories (Advanced) – November (8:30 a.m. ET)
Pending Home Sales – November (10:00 a.m. ET)
EIA Natural Gas Inventories – Weekly (12:00 a.m. ET)
Tuesday, December 30
FHFA Housing Price Index – October (9:00 a.m. ET)
S&P Case-Shiller Home Price Index – October (9:00 a.m. ET)
Consumer Confidence – December (10:00 a.m. ET)
FOMC Meeting Minutes (2 p.m. ET)
Wednesday, December 31
MBA Mortgage Applications Index – Weekly (7:00 a.m. ET)
Initial & Continuing Jobless Claims – Weekly (8:30 a.m. ET)
EIA Crude Oil Inventories – Weekly (10:30 a.m. ET)
Friday, January 2
S&P Global Manufacturing PMI (Final) – December (9:45 a.m. ET)
Construction Spending – November (10:00 a.m. ET)
International
Wednesday, December 31
China: NBS Manufacturing & Non-Manufacturing PMI - December
Friday, January 2
Eurozone: HCOB Global Manufacturing PMI (Final) – December
U.K.: S&P Global Manufacturing PMI (Final) – December
Here's a closer look at the earnings reports coming at us next week:
Portfolio Investor Resource Guide
Economic Data: Here's a List of Links to the Key Economic Data We Closely Watch
Investing Terminology: 16 Key Terms Club Members Should Know
10-Ks: Want to Know About a Stock? Read the Company's Reports
10-Qs: Unlock the Numbers and Key Information Behind Your Stock With the 10-Q
Income Statement -Our Cheat Sheet to Understanding This Financial Document
Balance Sheet, Cash Flow Statements, and Dividends - How to Know If a Company Is Off-Kilter? Read Its Balance Sheet
Valuation Metrics - Everyone Wants a Value. Here's How Investors Can Find
Thematic Investing 101 Webinar
Like the Benefits of ETFs? Let’s Talk About Models
The Portfolio Ratings System
1 - Buy Now (BN): Stocks that look compelling to buy right now.
2 - Stockpile (SP): Positions we would add to on pullbacks or a successful test of technical support levels.
3 - Holding Pattern (HP): Stocks we are holding as we wait for a fresh catalyst to make our next move.
4 - Sell (S): Positions we intend to exit.
Stocks & Markets Podcast Links
Some helpful links if you prefer to catch the podcast on the go, in the car, or wherever. Be sure to give it a like or thumbs up and leave a review if you’re so inclined. We’d appreciate it.
More Pro Portfolio
- Shuffling Our Chip Mix, Setting a Broadcom Price Target With 4 Trades
- Stocks & Markets Podcast: The Market Setup and Pro Picks for 2026
- Weekly Roundup: The Market Rebounded and Now We'll See if Santa Claus Comes This Year
At the time of publication, TheStreet Pro Portfolio was long BAC, AXP, MRVL, WM, NVDA, MS, GOOGL, AVGO, NOW, SSSS, AAPL and ETN.
