Weekly Roundup: Rate Cut Re-Think Rankles Market, But This Is Our Focus
We have one eye on the technicals, and the other on the market’s reaction to these events next week.
You've reached your free article limit
You've read 0 of 1 free Pro articles.
As we close out the halfway point of the current quarter, despite the market’s gyrations this week, the S&P 500 is up around 1% and the Nasdaq Composite is a bit higher. What those figures mask, however, is the relatively flat performance for the Nasdaq this week amid renewed concerns over what some continue to call the “AI trade.” That concern led to a bit of a rotation this week, which favored several of the Pro Portfolio’s non-tech holdings and helped the S&P 500 outperform the Nasdaq Composite.
Two other factors that gave the market a run for its money this week were what we can call a “buy the rumor, sell the news” event that was the end of the government shutdown, and the market having to rethink the potential for a December rate cut. We talked about the growing number of cautionary comments from Fed officials about that expected rate cut in Thursday’s Portfolio video and again on Friday morning.
In our Friday morning note, we recounted the recent conversation we had about the robust and extended run for the S&P 500 and the Nasdaq Composite over the last several months. The message being that the market was likely due for a pullback, and it’s the same one we heard from Freedom Capital’s Jay Woods.
With the benefit of a little hindsight, it’s fair to say the market was once again priced to perfection, and when that’s the case, it doesn’t take a lot to inject some volatility back into it. While some tend to fret, we understand this is par for the course, and it tends to happen a few times each year, historically speaking.
When we experience one of these moments, we keep a close eye on technical support levels and other indicators so we can determine when the worst has likely passed and the market is on relatively more stable footing. On Friday, we shared that we are watching the 50-day moving averages and 100-day moving averages for both the S&P 500 and the Nasdaq Composite. Based on where those indexes closed on Friday, after moving below their respective 50-day moving averages earlier that day, the market may have found its footing.
Follow-through is key, however, and with that in mind, we have quarterly results out next week from Nvidia (NVDA) , Walmart (WMT) , Home Depot (HD) , and others. We also have multiple investor conferences next week and the Flash November PMI data from S&P Global. As we digest those events, we’ll be watching the market’s reaction to them, looking to confirm that it has found its footing.
While we wait to see if that’s what we get, we’ll begin Monday by introducing the EPS Diplomats model into the Pro Portfolio, something we discussed with you on Thursday. And as we move into the second half of the current quarter, we’ll also have an updated table of consensus EPS expectations, pick-up points, and panic points for the Pro Portfolio’s holdings.
Enjoy your weekend, Saturday’s signals alert, and Sunday’s bowl of more light-hearted fare. See you back here, bright and early on Monday.
Catching Up on the Portfolio This Week
Coming into this week, it appeared increasingly likely that the government shutdown was nearing its end. That led us to put some capital to work in seven existing Portfolio positions on Monday. In that trade alert we also explained that position sizing constraints and/or overbought conditions prevented us from making any incremental moves with shares of Welltower (WELL) , Axon (AXON) , Nvidia (NVDA) , Marvell (MRVL) , and Eaton (ETN) . We made a similar comment on Friday when we flagged the recent decline in shares of SuRo Capital (SSSS) as an opportunity ahead of the company’s upcoming dividend record date.
For the week in full, the Pro Portfolio started to recover from our recent exit for Universal Display (OLED) , which closed this week well below our $121.20 closing price. Amid a challenging week for the Nasdaq Composite, which weighed on some tech positions such as Marvell and Meta (META) , while others like Nvidia rebounded, it was our non-tech holdings that carried the Portfolio. Big winners this week were Labcorp (LH) , Waste Management (WM) , and Welltower. Other gainers included Dutch Bros (BROS) , Microsoft (MSFT) , and TJX (TJX) , which offset declines at Axon, Eaton, and a few others.
During the week, we lifted our price target for American Express (AXP) to $385 from $370 following management’s upbeat comments about its Platinum card refresh program. We also discussed how tariff relief on coffee could be a catalyst for our shares of Dutch Bros, even though the real story remains centered on the footprint expansion and pending food menu launch that should drive average ticket higher. And following Advanced Micro Devices' (AMD) upbeat Analyst Day comments about multi-year AI and data center demand, we discussed the support brought to multiple Portfolio holdings from Foxconn’s September-quarter results and upbeat guidance.
Thursday afternoon, we shared with you an upcoming addition to the Portfolio that will take effect on Monday, November 17, when we fold in eight new positions as part of the EPS Diplomats model. Several members had questions about what this means, and we suspect there will be a few more coming before Monday morning. We’ve answered some and will continue to answer others over the weekend and Monday morning as we get ready to put that plan into action. We’ll have that trade alert to you well before the market open on Monday, and as we’ve intimated, those eight positions will consume 2.0% of the Portfolio’s cash.
Based on where the Portfolio closed on Friday, and following that upcoming, multipronged trade, our cash position will be around 7% of the Portfolio’s assets. Keep in mind, we still have several Portfolio dividend payments coming in the next few weeks. That said, if Friday’s market turnaround continues, it may lead us to make a prudent move or two depending on position sizing and/or position RSI levels.
In terms of our shopping list, during the week we mentioned we were watching United Rentals (URI) and Labcorp. Exiting the week, we can add Axon to that list as the stock moved deeper into oversold territory ahead of management’s investor conference presentation next week. Meta shares also exited the week with an RSI level below 30.
Now let’s see what others on Wall Street had to say about the Portfolio’s holdings during the week:
Monday – Citi reiterated its Buy rating on Arista Networks (ANET) and its $176 price target and boosted its Nvidia price target to $220 from $210, keeping its Buy rating intact. UBS also reiterated its Buy rating on Nvidia shares and its $235 target, sharing that the chip company could guide current quarter revenue to $63 billion-$64 billion. Piper Sandler reduced its Labcorp target to $270 from $280. TD Cowen nudged its TJX price target to $162 from $160.
Wednesday – Bernstein initiated coverage of Waste Management with a $255 target and an Outperform rating. Argus upped its United Rentals target to $945 from $935.
Thursday – Wells Fargo started coverage on Waste Management shares with an Overweight rating and a $238 target. Scotiabank upped its Welltower target to $214 from $182. Oppenheimer lifted its Nvidia target to $265 from $225, and maintained its Outperform rating, while Susquehanna took its NVDA target to $230 from $210. Wedbush added shares of Meta to its Best Ideas List, keeping its $920 target.
Friday – Baird initiated Microsoft shares with a $600 target and an Outperform rating. Wells Fargo raised the firm's price target on Nvidia to $265 from $220 and keeps an Overweight rating on the shares ahead of quarterly results next week. Morgan Stanley also nudged its NVDA target to $220 from $210.
This Week's Portfolio Videos
We cover a lot of ground during the week in our Daily Rundowns. If you happened to miss one or more of them, here are some helpful links:
Tuesday, November 11: Big Bank Makes a Surprising Nvidia Move
Wednesday, November 12: Stocks & Markets Podcast - The New Nuclear Age With Homeland Uranium CEO
Thursday, November 13: We’re Watching These Levels for Palantir and 2 Other Holdings
Key Global Economic Readings
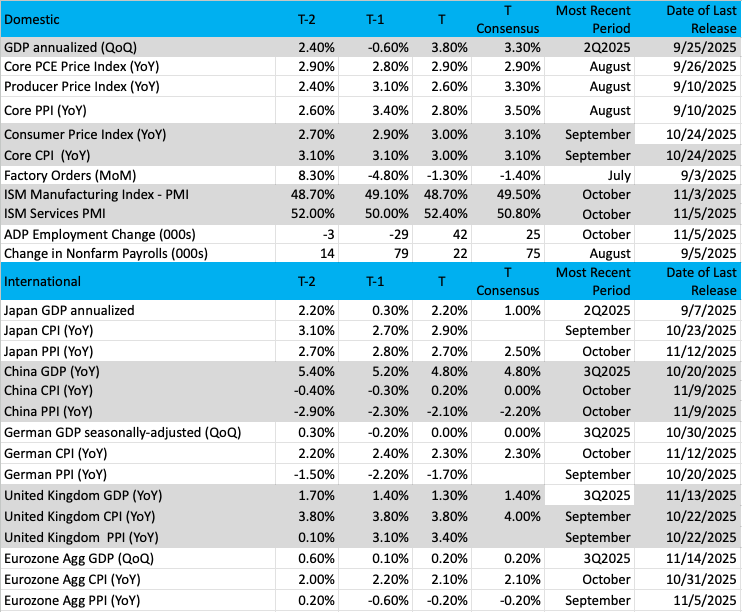
(Note: T is the most recent period, T-1 is the prior period's reading, and T-2 is two periods back, the intent being to illustrate any trends.)
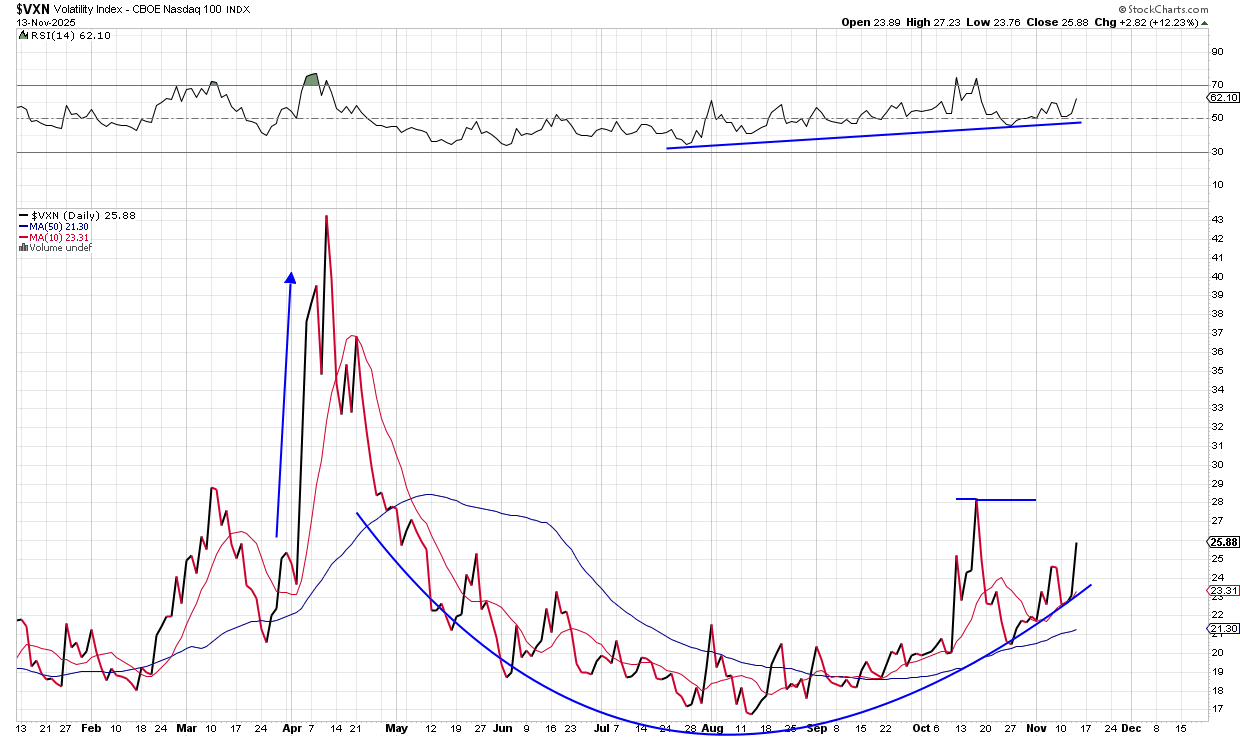
Chart of the Week: The Volatility Index
Don’t look now, but volatility is starting to pick up. While many in the markets see a pullback as necessary or even a chance to "reset" or let the dip buyers back in, there is a certain worry this time around that is going to punish that complacent attitude. You see, we have all been conditioned to do the same thing again, but when conditions change, we are slow to respond, if at all. We can look at volatility moves to see in advance what the next market move might be.
The $VXN is the volatility component of the Nasdaq 100 (QQQ) stocks, and yes, that means the Magnificent Seven names and then some. This index is often the most volatile of the four we examine daily ( (SPY) , (IWM) , (DIA) are the others).
Why is the Nasdaq 100 important, and why should we pay attention to its volatility component? This is the most widely held index in the world, these stocks are in just about every portfolio imaginable, and when the markets start to get shaky or rumble, it is these names that’ll get hit first and often. The $VXN can lead us up to where big moves happen, and we can choose to protect our portfolios to reduce overall volatility.
Noticing the chart, below, we have shifted to a line graph, which shows us a nice bowl-shaped pattern. This is a basing period for the $VXN, but recent action shows this indicator is now in an uptrend. What does higher volatility mean? Basically, an expansion of the range, large moves for the Nasdaq 100 (QQQ), which means big moves up AND down. That makes investors/traders uncomfortable, especially after such strong gains have been booked in the first 10 months of the year.
The $VXN peaked in April after a stunning rise on Liberation Day, a better than 100% move higher from late March to early April, but backed down significantly by the summer. This recent move up had a jolt to the $28 area, backed away, and is now moving steadily back up. That is problematic for the markets. Steady rises in volatility will erode confidence as investors/traders may just throw in the towel for the rest of 2025.
Setting up a buying opportunity? Perhaps, but that would be significantly lower in price. Watch $VXN for any sharp moves up, then right back down, which could signal a buying opportunity if you’re willing to be patient.
Other charts we shared with you this week were:
Monday, November 10: S&P 500: This Is a Big Week for Deciding the Direction
Monday, November 10: First Trust Nasdaq Cybersecurity ETF (CIBR): Is CIBR Safe After Pullback?
Tuesday, November 11: Arista Networks (ANET): This Holding Presents Another Excellent Buying Opportunity
Wednesday, November 12: Costco (COST): Don't Overlook Costco Now
Thursday, November 13: Apple (AAPL): Can Apple Really Be the Best of the Magnificent Seven?
The Week Ahead
With the government shutdown over, we should eventually see the return of the economic data we love to examine and analyze. Most of that data is expected to start being reported after the Thanksgiving holiday, but, per comments late this week from Secretary of Labor Lori Chavez-DeRemer, the September jobs report data was collected, and she hopes it will be released next week. While that would be nice to see, Chavez-DeRemer reiterated comments made earlier in the week from the White House that the BLS was not able to collect October CPI or jobs data.
In addition to that jobs data, we’ll be focusing on the next set of findings from ADP’s new weekly Employment Change report. With less than a handful of such reports available, we’ll be careful not to read too much into its findings, but we will match what it shows against next Friday’s Flash November PMI report from S&P Global. In that report, we’ll also be looking for what is said about input and output cost trends, as well as whether it shows the recent upturn in the Services sector picking up steam.
Here's a closer look at the economic data coming at us next week:
U.S.
Monday, November 17
· Empire State Manufacturing Index – November (8:30 AM ET)
Tuesday, November 18
· Import/Export Prices – October (8:30 AM ET)
· Industrial Production & Capacity Utilization – October (9:15 AM ET)
· ADP Employment Change - Weekly (9:15 AM ET)
· NAHB Housing Markit Index – November (10:00 AM ET)
Wednesday, November 19
· MBA Mortgage Applications Index – Weekly (7:00 AM ET)
· Housing Starts & Building Permits – October (8:30 AM ET)
· EIA Crude Oil Inventories – Weekly (10:30 AM ET)
Thursday, November 20
· Initial & Continuing Jobless Claims – Weekly (8:30 AM ET)
· Philly Fed Index – November (8:30 AM ET)
· Existing Home Sales – November (10:00 AM ET)
· Leading Indicators – October (10:00 AM ET)
· EIA Natural Gas Inventories – Weekly (10:30 AM ET)
Friday, November 21
· S&P Global Flash Manufacturing & Services PMI - November (9:45 AM ET)
· University of Michigan Consumer Sentiment Index (Final) – November (10:00 AM ET)
International
Monday, November 17
· Japan: GDP (Prelim) – Q3 2025
· Japan: Industrial Production – September
Wednesday, November 19
· Japan: Machine Tool Orders - September
· Japan: Imports/Exports – October
· UK: Inflation Rate – October
· Eurozone: Inflation Rate - October
Thursday, November 20
· Germany: Producer Price Index – October
· Eurozone: Consumer Confidence (Flash) - November
Friday, November 21
· Japan: Inflation Rate – October
· UK: GfK Consumer Confidence – November
· Japan: S&P Global Flash Manufacturing & Services PMI – November
· Eurozone: HCOB Flash Manufacturing & Services PMI – November
· UK: S&P Global Flash Manufacturing & Services PMI – November
· UK: Retail Sales - October
The transition to October quarter-end reporting occurs next week, and it will feature retail and other consumer-facing companies as well as the latest quarterly report from one of, if not the most widely held, companies. Yes, we’re talking about Nvidia (NVDA) .
Heading into the weekend, NVDA shares clawed back some of their recent losses, but make no mistake, all eyes are on CEO Jensen Huang to deliver a big quarter and a commanding outlook. The backdrop fueling those expectations is the number of mega-deals announced during the back part of the September quarter and those announced in the current one.
Could Jensen’s outlook be tempered by capacity shortages like the ones we heard from CoreWeave (CRWV) earlier this week? Certainly possible, but we’ll focus on the medium-to longer-term given the expected capex ramp next year from Big Tech and others that should translate into data-center capacity additions coming on stream in the next few years. That said, in the past, NVDA shares have fallen victim to “whisper number” expectations, and should we see that yet again next week, we will want to pay close attention to how the stock reacts against key support levels.
So far, NVDA shares have held their ground against the 50-day moving average at $185.60. If we see the shares under renewed pressure after earnings, we’ll want to keep that level in mind, as well as the 100-day moving average near $179.
While much attention will be paid to Nvidia’s results, guidance, and the market’s reception to both, we also have quarterly earnings from Walmart (WMT) , Home Depot (HD) , Klarna (KLAR) , Target (TGT) , Gap (GPS) , Ross Stores (ROST) , and our own TJX Companies (TJX) next week. We know the consumer has become increasingly bifurcated to the point that even the Trump administration is preparing broad exemptions to certain tariffs in an effort to ease elevated food prices.
What these companies have to say about the consumer, how tariffs are impacting their businesses, and what they expect for the holiday shopping season will be of much interest to us and the wider investment community. We suspect the learnings will reinforce our position in TJX shares, but also provide the context that shows how impressive Costco’s (COST) monthly comp sales have been.
We also have the RBC Capital Markets Global Technology Internet Media Telecommunications Conference, the J.P. Morgan Ultimate Services Investor Conference, the Jefferies Consumer Conference, and others next week. At those events, we’ll hear from Axon Enterprise (AXON) , ServiceNow (NOW) , Arista Networks (ANET) , Waste Management (WM) , and many others. We’ll be interested in comments about the current quarter to date and listening for any incremental changes to their current quarter guidance.
Here's a closer look at the earnings reports coming at us next week:
Monday, November 17
· Open: J&J Snack Foods (JJSF), JinkoSolar (JKS)
· Close: Trip.com Group (TCOM)
Tuesday, November 18
· Open: Baidu (BIDU), Home Depot (HD), James Hardie (JHX), Klarna Group (KLAR)
· Close: La-Z-Boy (LZB)
Wednesday, November 19
· Open: Dycom (DY), Lowe’s (LOW), Target (TGT), TJX Companies (TJX)
· Close: Jack in the Box (JACK), Nvidia (NVDA), Palo Alto Networks (PANW)
Thursday, November 20
· Open: Bath & Body Works (BBWI), Construction Partners (ROAD), Jacob Solutions (J), Walmart (WMT)
· Close: Gap (GPS), Intuit (INTU), Post (POST), Ross Stores (ROST)
Friday, November 21
· Open: BJ’s Wholesale (BJ)
Portfolio Investor Resource Guide
· Economic Data: Here's a List of Links to the Key Economic Data We Closely Watch
· Investing Terminology: 16 Key Terms Club Members Should Know
· 10-Ks: Want to Know About a Stock? Read the Company's Reports
· 10-Qs: Unlock the Numbers and Key Information Behind Your Stock With the 10-Q
· Income Statement: Our Cheat Sheet to Understanding This Financial Document
· Balance Sheet, Cash Flow Statements, and Dividends: How to Know If a Company Is Off-Kilter? Read Its Balance Sheet
· Valuation Metrics: Everyone Wants a Value. Here's How Investors Can Find
· Thematic Investing 101 Webinar
· Like the Benefits of ETFs? Let’s Talk About Models
The Portfolio Ratings System
1 - Buy Now (BN): Stocks that look compelling to buy right now.
2 - Stockpile (SP): Positions we would add to on pullbacks or a successful test of technical support levels.
3 - Holding Pattern (HP): Stocks we are holding as we wait for a fresh catalyst to make our next move.
4 - Sell (S): Positions we intend to exit.
Stocks & Markets Podcast Links
Some helpful links if you prefer to catch the podcast on the go, in the car, or wherever. Be sure to give it a like or thumbs up and leave a review if you’re so inclined. We’d appreciate it.
