Weekly Roundup: Pro Portfolio Widens Its Lead Over the S&P 500
We are enjoying the benefits of strategic moves in April and May, but our eyes are open as the market becomes overbought.
You've reached your free article limit
You've read 0 of 1 free Pro articles.
The stock market put in a very strong week, with the S&P 500 rising more than 5% and the Nasdaq Composite more than 7%, as volatility continued to plummet. Multiple factors powered the market, leading the S&P into positive territory on a year-to-date basis. The moves we made in April and at the start of this week enabled the Pro Portfolio to widen its lead over the S&P 500 on a year-to-date basis. We’ll get a bit more granular on those moves in the next section of the Roundup.
The factors that powered the market higher this week started with a rollback in U.S.-China tariffs and the prospect for other trade deals, indications that tariff-related inflation wasn’t as bad as feared, and aggregate data that point to the economy continuing to grow above trend. In short, the market moved back from extreme uncertainty. However, let’s remember current tariffs are still higher than those at the start of the year, and next week brings another wave of retail earnings.
Multiple times this week, we discussed how the culmination of the market’s rebound from its early April lows had the S&P 500 and the Nasdaq Composite flirting with overbought relative strength index (RSI) level readings. The final surge higher on Friday afternoon into the market close had the S&P 500's RSI reading a hair below 70 (overbought) while the Nasdaq registered just under 71. This is not surprising to us given the 23% move in the S&P 500 off its April low and the 30% one for the Nasdaq Composite over the same time frame. Granted, the market was extremely oversold in early April, and that led us to do some smart buying back then.
We’ve been in markets that have been overbought, or nearly overbought before. Markets can move deeper into overbought territory, provided there isn’t a development that leads to short-term profit-taking. However, the deeper the market moves into overbought territory, the more likely even a minor development could trigger short-term profit-taking.
Gaming it out, barring a return to extreme uncertainty, something we give a low probability following trade talk developments so far, a pullback in the market would likely be a healthy thing. It would take some of the froth out of the market, and it would allow us to potentially put additional capital to work, perhaps in a new position or two.
Our thinking is that as more trade deals are announced and progress on Trump’s tax agenda advances, that combo will melt down remaining market anxiety and lead investors to reassess recent EPS cuts for the second half of 2025. That, in turn, would be a catalyst to drive the market higher, and one we aim to benefit from.
Catching Up on the Pro Portfolio This Week
As we discussed in Friday’s Daily Rundown video, the Pro Portfolio made several moves this week, starting with picking up additional shares of Apple AAPL, American Express AXP, Dutch Bros BROS, Elastic ESTC, Meta META, and Marvell Technology MRVL on Monday. Those moves, together with the other buying we did in early April and again in mid-April, and our timely exit of the inverse ETF positions, led the Pro Portfolio to gain more ground over the S&P 500 this week.
After updating consensus EPS expectations for the Pro Portfolio holdings in a table that also included our updated price targets, panic points, and pick-up points for each position, we made several price target adjustments later in the week. On Wednesday, we lifted our Nvidia NVDA price target to $160 from $150 and explained why CEO Jensen Huang’s keynote on Sunday, May 18, could be a catalyst for the shares ahead of the company’s May 28 earnings report.
After digesting a presentation by Axon Enterprise AXON management at an investor conference this week, we upped our target on the shares to $750 from $700. We did caution, however, that given current relative strength index (RSI) levels, members should not be chasing AXON shares at current levels. On Friday, we made a similar call for shares of Bank of America BAC and Morgan Stanley MS, even as we lifted those price targets to reflect growing activity in the IPO and M&A markets.
It hasn’t been lost on us that several Pro Portfolio holdings have made considerable moves over the last 4-5 weeks. In some cases, they have significantly outpaced the corresponding move for the S&P 500, leading their RSI levels to become elevated. Moving forward, we will continue to balance near-term technicals for individual positions and the market against medium-to longer-term opportunities and fresh developments that could lead those stocks or the market to move even higher in the near term. As we like to say, no one ever went broke taking a profit, but we also want to maximize the Pro Portfolio’s returns over the long run.
Now let’s catch up on what Wall Street and others had to say this week about the Pro Portfolio’s holdings:
Axios reported that Alphabet/Google GOOGL surpassed IBM IBM to become the leader in generative AI-related patents and in the emerging area of agentic AI.
TD Cown initiated coverage on Bank of America with a Buy and a $53 target.
RBC initiated coverage on Dutch Bros with an Outperform rating and an $83 target.
Mizuho raised its price target for Eaton ETN to $385 from $355, while JPMorgan boosted its target to $360 from $300. BNP Paribas also started coverage of ETN shares with an Outperform rating and a $385 target, citing artificial intelligence-related data center demand, accelerating reindustrialization, and electrification as drivers. Sounds a lot like our thinking.
Loop Capital increases its Meta price target to $888 from $695, citing an improving Q2 outlook and calls the company “the best non-hardware example of tangible, right-now beneficiary of AI.”
BofA upped its price target for Nvidia shares to $160 from $150.
UBS upgraded United Rentals URI to Neutral with a $780 price target, from the prior $485. You’re probably shaking your head like we are after reading that.
UBS also upgraded its rating on Vulcan Materials VMC to Buy from Neutral with a revised $318 target, up from $280. Morgan Stanley boosted its VMC target to $303 from $273.
This Week's Portfolio Videos
We cover a lot of ground during the week in our Daily Rundowns. If you happened to miss one or more of them, here are some helpful links:
Monday, May 12: Our Moves After Surprise U.S.-China Trade Update
Tuesday, May 13: 3 Days of Big Reports and Why We’re Eyeing These Key S&P 500 Chart Levels
Wednesday, May 14: TheStreet Pro’s Live Quarterly Meeting: Investing in Uncertain Times
Thursday, May 15: Stocks & Markets Podcast #5: First Technical Green Light With Louis Llanes
Friday, May 16: Big Rebound This Week But Vigilance Is Key
Key Global Economic Readings
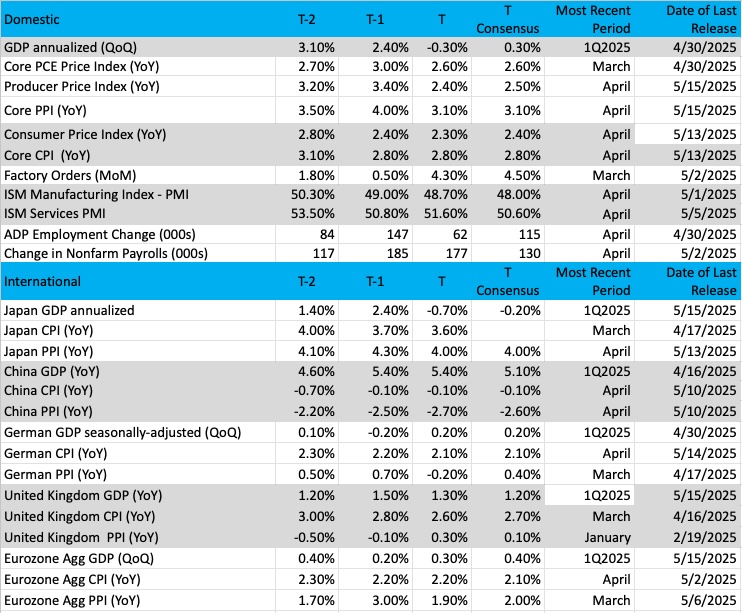
(Note: T is the most recent period, T-1 is the prior period's reading, and T-2 is two periods back, the intent being to illustrate any trends.)
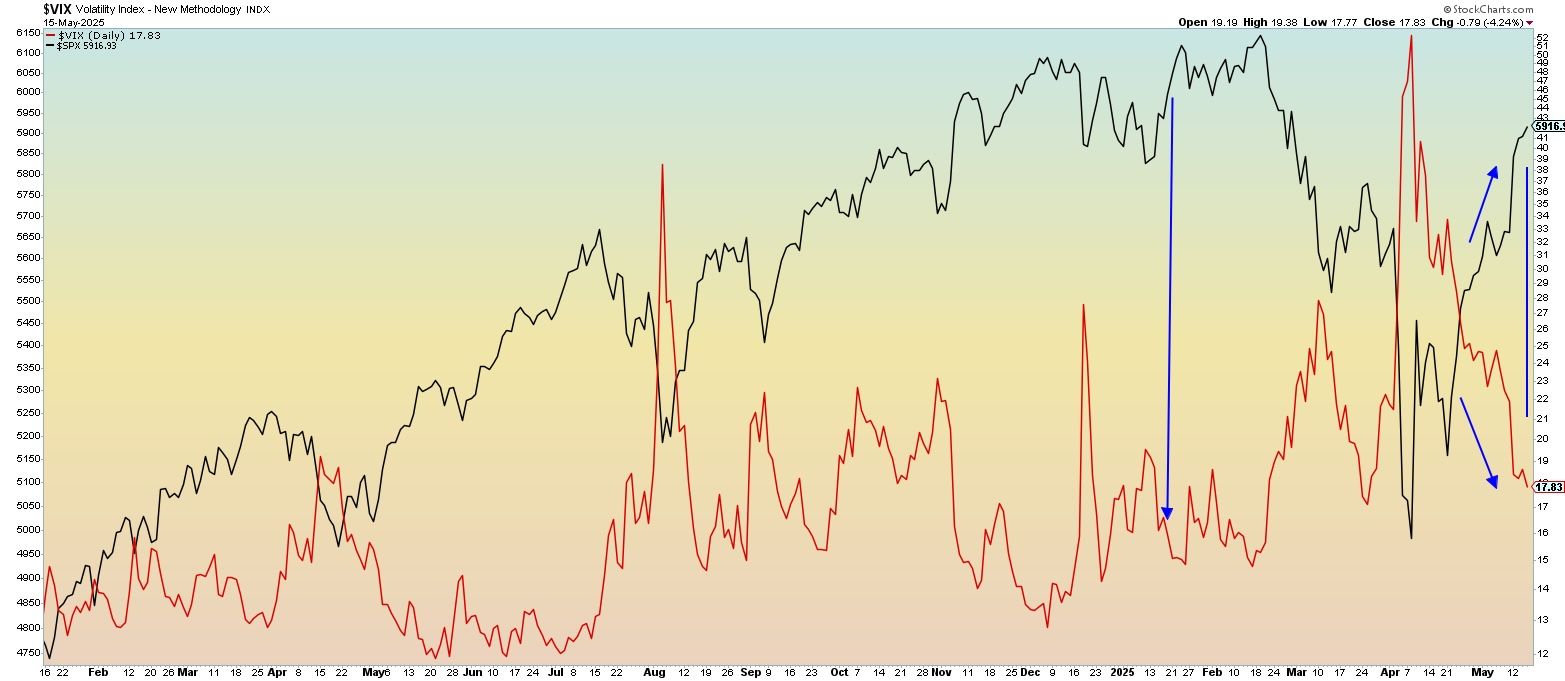
Chart of the Week: Dropping Volatility and Market Sentiment
Market volatility has come down sharply over the last six weeks. During that time, investor sentiment has become more bullish, but, as usual, the “crowd” has been late to the party.
It is true that when markets are selling off and finding no bidders that investors quickly dump stocks and wait for a better moment, maybe a peak in volatility or bearish investor sentiment. The problem with following that logic, however, is that you will always be behind, always chasing the market higher or lower.
We do not trade or invest based on market forecasting tools. Rather, we gather information so we can make the best-informed decision at the moment that will turn out positively for the Pro Portfolio weeks and months into the future. Analyzing market volatility charts is just one of many important tools to help us better convey our thesis.
As mentioned, the VIX has moved sharply lower since peaking on April 2. But leading up to that point was a massive surge in volatility over about 10 sessions that pushed the VIX from 17 to 60. As you might have expected, markets moved down sharply on that rise in volatility; and naturally, much of the fear was noticeable in several tools like the fear/greed index and other sentiment polls. But the decline in VIX has been moderate and steady, giving investors/traders the confidence to step back into markets.
Just recently, it was noted that retail investors piled into stocks at a furious rate, not willing to let the markets rise without them (we call that FOMO, or fear of missing out). Naturally, the big money investors such as banks, institutions, hedge funds, pensions, and trusts were already in and even added more to their holdings.
In this comparison chart of the S&P 500 (black line) vs. the VIX (red line), we see they move in different directions (most of the time), and that is consistent with the pattern of fear and greed. Sharp rises in volatility mean an expansion of the trading range, and that makes investors/traders very uncomfortable.
We were not interested in picking the top in the VIX, but instead looking for a smooth move down, which confirmed that the trend was lower. We received that signal not long after the VIX peaked, and it has been a steady move down since, right to the 17% level from late March. Markets are up significantly over the last month.
The point is we should follow the VIX carefully as it leads on the way up and the way down. After all, if this is reading investor sentiment accurately, there is no better way to know how the investing/trading public is feeling at the moment, and providing us another great opportunity to add to our positions in a moment of market weakness.
Other charts we shared with you this week were:
Monday, May 12: S&P 500 - Is U.S.-China Trade News the Catalyst for a 'Next Level' Move?
Monday, May 12: Waste Management (WM) - Waste Management Makes Impressive Move
Tuesday, May 13: Palantir (PLTR) - Palantir Remains Bullish Through All the Volatility
Wednesday, May 14: Microsoft (MSFT) - As Microsoft Surges, Let's Trace Its Comeback
Thursday, May 15: American Express (AXP) - American Express Delivers for Investors
The Week Ahead
The Atlanta Fed’s GDPNow model closed out the week, and all the April economic data it brought, with a 2.4% rolling figure for the current quarter. What the central bank saw in Friday’s Housing Starts and Import/Export Price data led it to walk back its prior revision that had the economy trending at a 2.5% rate.
Despite that dip, the current GDPNow model figure is well above the 1.1% on May 1, and points to the domestic economy growing at trend despite the start of Trump’s reciprocal tariffs. As we move from April to May numbers, our focus will remain on the data, but for now, what we see is likely to keep the Fed in a holding pattern.
Next week is pretty quiet on the economic data front until Thursday, when S&P Global publishes its Flash May PMI findings. It’s no secret that this monthly data is one of our favorites to examine because it brings an indication of what we are likely to see when we get the final data a short time later. With the Flash PMI data for May, we’ll be looking to gauge the continued impact of tariffs on demand, hiring, and, of course, inflation. We’ll also be interested in comments from those surveyed about plans to raise output prices to preserve margins in the face of tariff-related costs.
Given the timing of that data, we largely expect the pre-Thursday Fed speakers next week to echo this week's comments from Fed Chair Powell and Atlanta Fed President Raphael Bostic. With the learnings from the May Flash PMI report in hand, we will be looking forward to what, if anything, Powell says about it on Sunday, May 25, and what that could mean for the CME FedWatch Tool.
Here's a closer look at the economic data coming at us next week:
U.S.
Monday, May 19
· Leading Indicators – April (10:00 AM ET)
Wednesday, May 21
· MBA Mortgage Applications Index – Weekly (7:00 AM ET)
· EIA Crude Oil Inventories – Weekly (10:30 AM ET)
Thursday, May 22
· Initial & Continuing Jobless Claims – Weekly (8:30 AM ET)
· S&P Global Flash Manufacturing & Services PMI – May (9:45 AM ET)
· Existing Home Sales – April (10:00 AM ET)
· EIA Natural Gas Inventories – Weekly (10:30 AM ET)
Friday, May 23
· New Home Sales – April (10:00 AM ET)
International
Monday, May 19
· China – Industrial Production, Retail Sales, Fixed Asset Investment – April
· Eurozone: Consumer Price Index (Final) - April
Tuesday, May 20
· Eurozone: Consumer Confidence (Flash) - May
Wednesday, May 21
· Japan: Imports/Exports – April
· UK: Inflation Rate - April
Thursday, May 22
· Japan: Machinery Orders – March
· Japan: Jibun Bank Flash Manufacturing & Services PMI - May
· Eurozone: HCOB Flash Manufacturing & Services PMI – May
· UK: S&P Global Flash Manufacturing & Services PMI - May
Friday, May 23
· UK: Retail Sales - April
The expected shift in quarterly earnings toward retailers accelerates big time next week, and we expect many of those reporting will echo comments from Walmart WMT this week about raising prices to offset the impact of Trump tariffs. On Thursday, as part of discussing its latest earnings report, the company commented that President Trump’s tariffs are “too high,” and it will raise prices on some items to offset higher costs.
To be clear, Walmart did praise Trump’s tariff rollback from 145% on goods from China but remarked that even the current level of tariffs is still “too high.” We also expect companies to discuss how they will be impacted by the sharp drop in port cargo, as well as the sharp snapback in shipping costs we discussed on Thursday. Our suspicion is that as we navigate those and other comments, we’ll have further proof that our decision to own Amazon and Costco shares is the right one.
As we move through the week, we’ll continue to revisit price targets for existing Pro Portfolio holdings as new information is received. With that in mind, we’ll be examining results and guidance from Palo Alto Networks PANW, the third-largest holding in our First Trust Nasdaq Cybersecurity ETF CIBR.
Here's a closer look at the earnings reports coming at us next week:
Tuesday, May 20
· Open: Eagle Materials (EXP), Home Depot (HD)
· Close: Palo Alto Networks (PANW), Toll Brothers (TOL)
Wednesday, May 21
· Open: Canada Goose (GOOS), Dycom (DY), Lowe’s (LOW), Target (TGT), TJX Companies (TJX), VF Corp (VFC)
· Close: Snowflake (SNOW), Urban Outfitters (URBN), Zoom (ZM)
Thursday, May 22
· Open: Analog Devices (ADI), BJ’s Wholesale (BJ), Ralph Lauren (RL)
· Close: Intuit (INTU), Workday (WDAY)
Friday, May 23
· Open: Booz Allen (BAH), Buckle (BKE)
Portfolio Investor Resource Guide
· Economic Data: Here's a List of Links to the Key Economic Data We Closely Watch
· Investing Terminology: 16 Key Terms Club Members Should Know
· 10-Ks: Want to Know About a Stock? Read the Company's Reports
· 10-Qs: Unlock the Numbers and Key Information Behind Your Stock With the 10-Q
· Income Statement: Our Cheat Sheet to Understanding This Financial Document
· Balance Sheet, Cash Flow Statements, and Dividends: How to Know If a Company Is Off-Kilter? Read Its Balance Sheet
· Valuation Metrics: Everyone Wants a Value. Here's How Investors Can Find
· Thematic Investing 101 Webinar
The Portfolio Ratings System
1 - Buy Now (BN): Stocks that look compelling to buy right now.
2 - Stockpile (SP): Positions we would add to on pullbacks or a successful test of technical support levels.
3 - Holding Pattern (HP): Stocks we are holding as we wait for a fresh catalyst to make our next move.
4 - Sell (S): Positions we intend to exit.
