Weekly Roundup: Pro Portfolio Gains Ground, Moving Past S&P 500 YTD
Powell delivered as we expected, a U.S.-U.K. trade deal underwhelmed, and we shed our market-hedging ETFs. Now for U.S.-China trade talks and other tariff deals.
You've reached your free article limit
You've read 0 of 1 free Pro articles.
After moving higher over the last few weeks, the stock market gave back some of those gains this week following subdued comments from Fed Chair Powell and the arguably underwhelming “historic” trade deal between the U.S. and the U.K. As we reflect on that, we have to recognize the market backdrop that has evolved over the last few weeks, even as the Pro Portfolio improved its positioning against the S&P 500 even further this week.
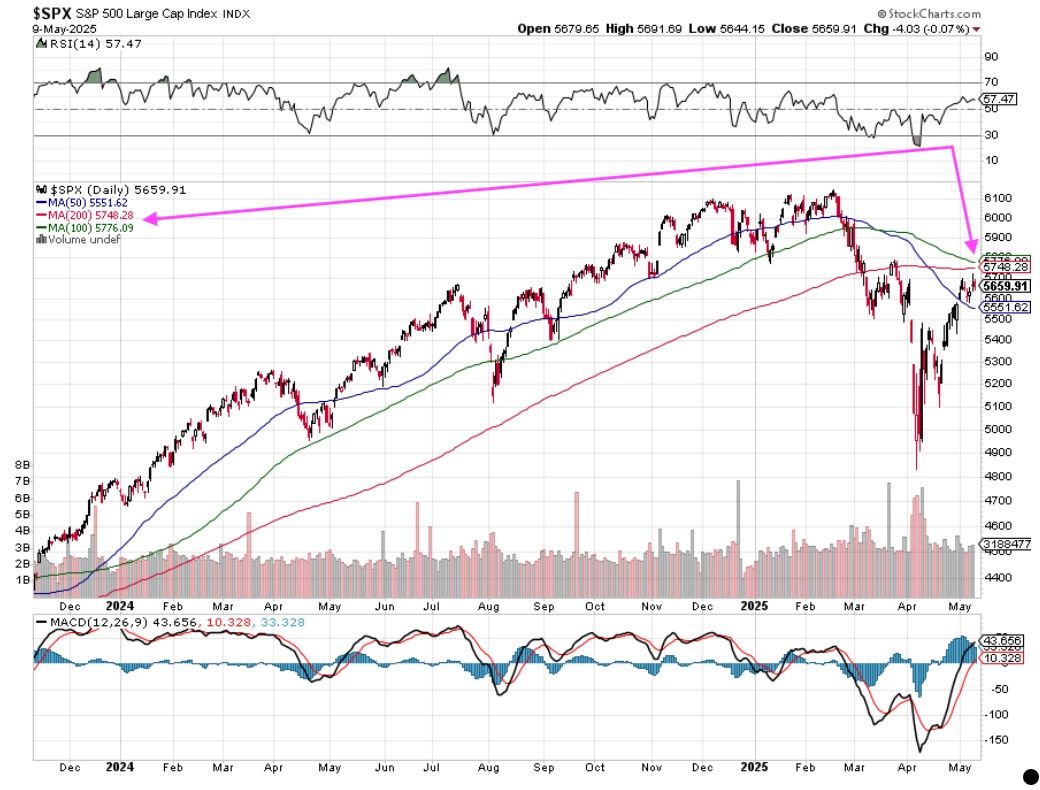
Looking at the S&P 500, after bottoming at 4910.42 on April 8, the index has traveled quite a distance in one month’s time to hit a near-term high near 5720 on May 8. Not only is the 16.5% move a rather brisk pace, albeit from very oversold levels in 30 days, it also has the S&P 500 staring down very tough resistance between its 100-day and 200-day moving averages. That combination meant it would not take much for traders and short-term investors to take some of those quick profits.
Coming into this week, we cautioned that Powell would deliver some sobering comments about rate cuts on Wednesday, after what we saw in the April Employment Report and especially the April Services PMI data from ISM. As we discussed in our post-Fed policy meeting Alert, he didn’t surprise us, and the S&P 500 closed off its highs for the day.
Late Wednesday night, President Trump teased that a “historic” trade deal with the U.K. would be announced Thursday morning. Taking our cue from other reports that predicted a more limited trade agreement between the U.S. and U.K., we shared our view that we were more likely to get headlines, not details. We were more right than not on that. However, we do see that announcement setting the framework for trade deals with other countries, as well as setting the tone for this weekend’s initial trade talks with China.
Ahead of that meeting, on Friday, Trump laid down a clear marker for de-escalation, posting that "80% Tariff on China seems right." While that would be down from the current 145% level, it would still be far higher than pre-April levels and a dramatic headwind for earnings. We also can’t rule out that this is part of Trump’s bombastic and public negotiation style.
We will see what unfolds over the weekend and early Monday morning. We’ll continue to focus on the details of announced trade deals, and our thinking remains that the more the administration can announce, the better its positioning with China trade talks. We are also taking a cue from U.S. Treasury Secretary Scott Bessent that up to 90% of deals could be completed by the end of the year. What we can say for sure is that the longer it takes for those trade deals to be hammered out, the longer the period of uncertainty that is hitting corporate planning and forecasting.
Over the last few weeks, we’ve seen the aggregated impact of tariff uncertainty translate into reduced EPS growth expectations for the basket of companies that comprise the S&P 500. With 90% of that basket having reported March-quarter results and Wall Street adapting to updated guidance, 2025 EPS growth expectations for the S&P 500 have fallen to 7.8% year over year, from 10.4% on March 31. That includes Q2 2025 EPS growth expectations declining to 2.0% from 2.8% on March 31.
Here’s the thing, over the next few weeks, the market will digest retail and related quarterly earnings and updated guidance. While some may have benefited from a pull forward in demand ahead of reciprocal tariffs, the combination of more selective consumer spending, tariffs, higher input costs, and potential supply chain issues is likely to result in updated guidance falling short of Wall Street expectations. That means we will likely see another leg down in Q2 2025 and 2025 EPS growth prospects for the S&P 500.
We’ve steered clear of pure retail-focused companies in the Pro Portfolio, opting instead for those, such as American Express AXP, Costco COST and Amazon AMZN, whose profits and bottom-line performance benefit from their differentiated business models. As retailers report and update their guidance, we should see that differentiation stand out.
Thinking like that has led us to focus on where spending is occurring, be it from the consumer, enterprises, or governments. We’ll continue to follow the money as we look for fresh Pro Portfolio candidates. We’ll also continue to heed the signals we uncover each week, as well as focus on companies positioned to benefit from structural changes and poised to deliver faster EPS growth. With just over 15% of the pro Portfolio’s assets in cash, we have ample firepower at our command, but that same cash level should also help mitigate any additional near-term declines in the market.
Enjoy the weekend, and we’ll be kicking off next week’s trading with our thoughts on what we learn about U.S.-China trade talks and other trade deal developments.
Catching Up on the Pro Portfolio This Week
While the market gave up some ground this week, the Pro Portfolio not only rose compared to last week but inched ahead of the S&P 500 on a year-to-date basis.
We can chalk that performance up to strong moves in shares of Axon Enterprise AXON, Amazon AMZN, American Express AXP, Dutch Bros BROS, Eaton ETN, Elastic ESTC, and Qualcomm QCOM, among others. Those gains were partly offset by declines in Marvell Technology MRVL, Alphabet GOOGL, and Apple AAPL, but even so, the net effect was the Pro Portfolio's holdings finished the week ahead of the prior one.
We made several price target changes this week as companies reported quarterly results and other developments led us to reassess prior targets:
Tuesday, we raised our Palantir PLTR target to $130 from $125. We plan to revisit our target after Palantir holds its next AIPCon event, most likely later this quarter.
After digesting Axon’s latest quarterly earnings beat and raised guidance, which supported our mix shift thesis to higher-margin Software & Services and showed the company has a substantial public safety pipeline, we upped our target to $700 from $625.
We lifted our Costco COST target to $1,150 from $1,100 on Friday following another monthly revenue report from the company that contained impressive comp sales metrics for April.
We also reiterated our $85 price target on Dutch Bros following their thesis confirming earnings report and guidance.
The only trades we made were on Thursday when we closed out the Pro Portfolio’s positions in the ProShares Short S&P500 ETF SH and the ProShares Short QQQ ETF PSQ with modest gains in each. We will continue to evaluate the use of these tools as necessary to blunt market pressure and volatility as needed. With President Trump telegraphing a potential wave of trade deals and tax cuts soon to come into focus, barring a significant injection of hopium into the market, odds are we will not utilize these market-hedging names unless the market were to become significantly overbought and overextended.
Closing out those positions lifted the Pro Portfolio’s cash pile to just over 15.5% of its assets. We will be working on updating our shopping list, something we will likely share as we refresh panic points for all the Pro Portfolio’s positions, as well as their consensus EPS expectations. We expect to have that in your hands as we begin next week. We will also be on the hunt for new Bullpen candidates.
Now let’s see what Wall Street had to say about the Pro Portfolio’s holdings over the last few days:
Barclays boosted its price target on AXON shares to $735 from $726, while Needham upped its to $750 from $600 and Morgan Stanley reset its at $695 from $635.
Stifel inched its Dutch Bros target down a few bucks to $82, but still defended the shares and its Buy rating, saying the company has “several idiosyncratic sales drivers to help offset a soft consumer spending environment, argues that emerging brands with sales momentum tend to outperform during downturns.” That fits with the geographic expansion story that first led us to add BROS shares to the Pro Portfolio back in August 2024, below $30. Barclays initiated coverage on BROS this week with an $82 target.
Citi raised its Eaton price target to $351 from $323, saying it expects the company to “continue delivering 'higher quality' earnings growth on secular growth tailwinds supporting stock appreciation over time.”
Piper Sandler increased its Labcorp LH price target to $280 from $260.
Cantor Fitzgerald issued a mea culpa on Marvell shares Friday, walking back comments made earlier in the week.
Palantir’s price target at Loop Capital was inched up to $130 from $125 following the company’s March quarter results after Monday’s close. Wedbush boosted its PLTR target to $140 from $120, calling out the acceleration in the company’s commercial business.
Scotiabank raised its price target on ServiceNow NOW to $1,100 from $1,075, calling it the "best positioned" enterprise software company with an AI platform driving business transformation. We don't disagree. Citi upped its NOW target to $1,160 from $1,128.
Tigress Financial reset its Amazon price target at $305, up $15, as it sees the company “well positioned to weather any economic and consumer spending environment given its 'robust' e-commerce and fulfillment capabilities.” We’d say that line of reasoning sounds very familiar.
Argus Research increased its Waste Management WM price target to $270 from $245.
This Week's Portfolio Videos
We cover a lot of ground during the week in our Daily Rundowns. If you happened to miss one or more of them, here are some helpful links:
Monday, May 5: What to Look for as Palantir Reports Earnings
Tuesday, May 6: $10 Billion American Electric Update Is a Big Deal for These 4 Holdings
Wednesday, May 7: TheStreet Stocks & Markets Podcast #4: Nvidia Game Plan With Todd Campbell
Thursday, May 8: This Holding's Results Serve as a 'Beat and Raise' in Current Market
Thursday, May 8: Versace on NYSE TV
Key Global Economic Readings
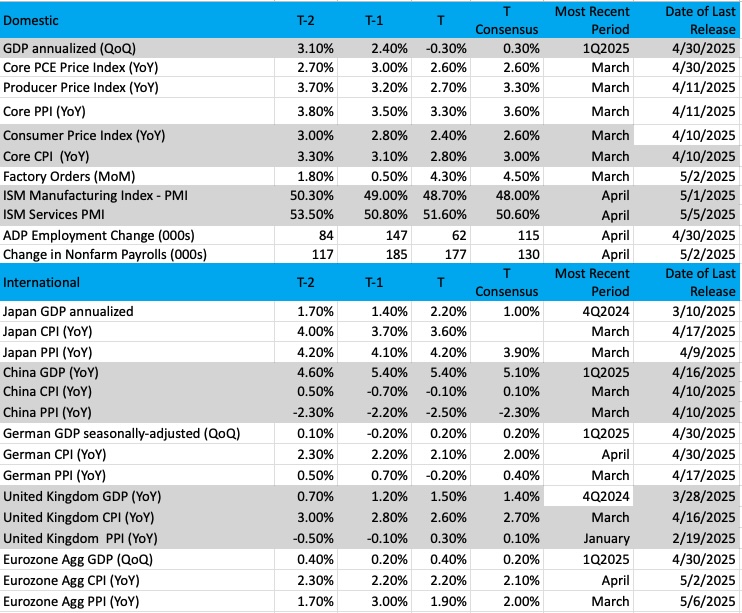
(Note: T is the most recent period, T-1 is the prior period's reading, and T-2 is two periods back, the intent being to illustrate any trends)
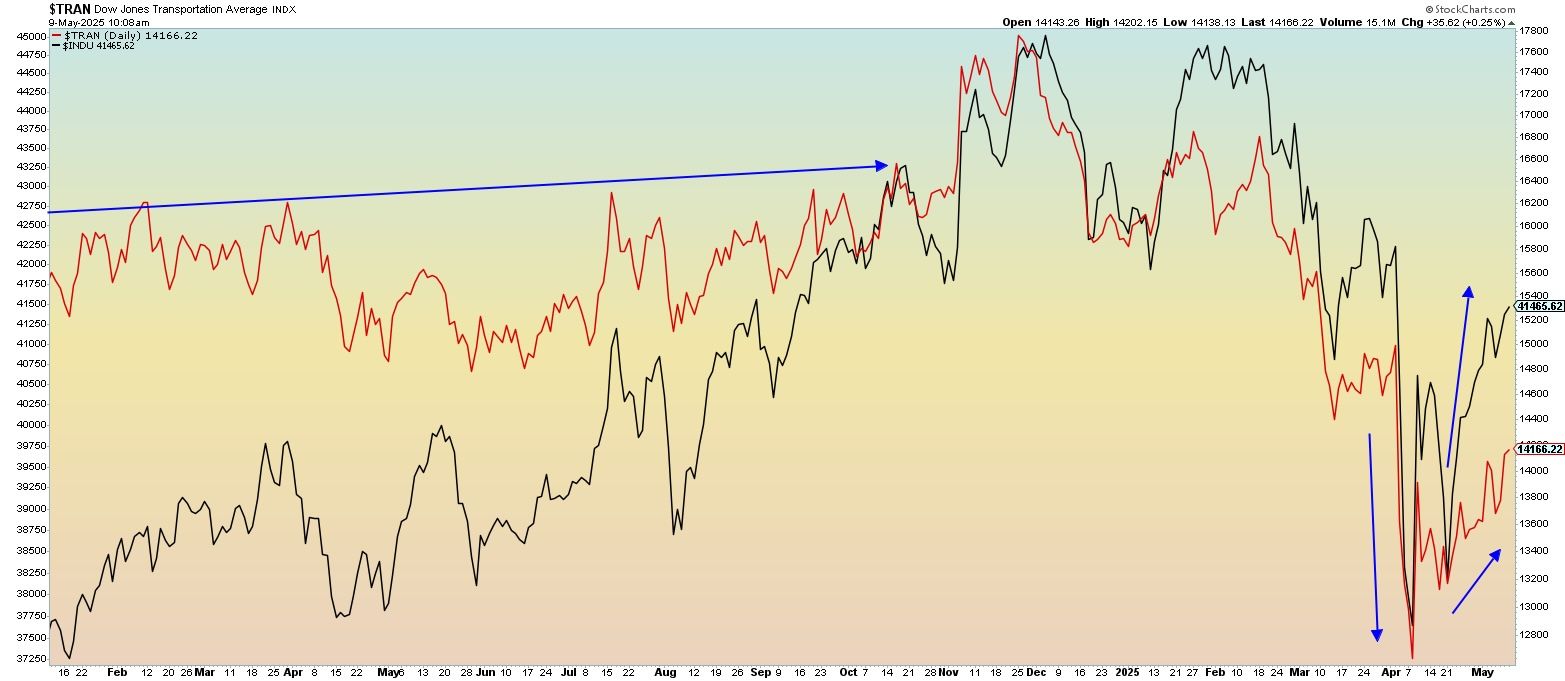
Chart of the Week: What the Dow Transports Tell Us
The big headline index the media likes to highlight is the Dow Industrial Average. It is the one most likely to be cited when hearing about "how did the market do today." But there's another important average in the "Dow" that we will discuss today.
The Transportation Index is a critical element when discussing the economy. Transportation is vital for shipping goods and services, along with people. We’ll show a comparison of the Industrials and Transports today and why they tend to need each other for the markets to go higher.
The Dow Transportation Index includes rails, airlines, and shipping/freight companies. It is the lifeblood of the economy and gives us a nice read on how business is moving. Companies such as FedEx, United Parcel Service, Ryder, American Airlines, Matson, and Union Pacific give us great signals about the strength or weakness in business. Indeed, the Transports are so important that the creator of the Dow Averages, Charles Dow, included both the Transports and Industrials as important "co-workers" in seeing the stock market moving higher.
The Dow Theory, as it goes, examines the relationship between the two indexes and says that when they both reach new highs, then a similar advance is highly likely. If the Industrials hit the highs first, then "theorists" often look for the Transports to confirm (with a new high).
Examining the chart here, we can see that when the Transports (red line) are leading the Industrials (black line), the stock market is robust. Notice that was the case during most of 2024. But when the Industrials lead, that tends to be dour for markets, as we saw in early January until mid-April.
Recent trends show the Industrials are still leading the Transports, which could be more trouble for the markets if the theory holds. However, if the Transports start to catch up (they have been underperforming this year), we could see a resurgence in these important economic areas.
Other charts we shared with you this week were:
Monday, May 5: S&P 500: A Good Old-Fashioned Rally. Now What?
Monday, May 5: What Comparing the S&P 500 to the Nasdaq Reveals
Tuesday, May 6: Axon Enterprise (AXON): What to Watch From a Holding When Earnings Arrive
Wednesday, May 7: Dutch Bros (BROS): Is Any Bad News Already Baked In Before Earnings?
Thursday, May 8: Broadcom (AVGO): This Bullpen Name Is Sporting an 'Intriguing' Pattern
The Week Ahead
Between the April Employment Report last week and its stronger-than-expected headline print as well as new orders in the April Service PMI data from ISM, initial expectations from the Atlanta Fed’s GDPNow model see the U.S. economy chugging along in the current quarter. While it’s based on less than a handful of data points and will be revised multiple times in the coming weeks, this is a welcome finding compared to the -0.3% initial GDP print for Q1 2025. The next update to that rolling GDP forecast comes after we receive next week’s April CPI and PPI reports, as well as April Retail Sales and Industrial Production numbers.
We suspect we will see April CPI and PPI readings that do not support near-term rate cuts, based on the elevated pricing figures in the April ISM PMI data for both Manufacturing and Services. The known culprit is the start of Trump's reciprocal tariffs, but based on the decline in oil prices and the flow through we are starting to see for gas prices as well as declines in other items such as eggs and airline ticket prices, those April inflation figures may not be quite as high as feared. However, declines in port and air freight traffic are only now starting to be seen, and we expect to hear much more about this as the current earnings season transitions to retail-facing companies next week and even more so the following one.
With that in mind, there are two reasons why we’ll want to carefully parse the April Retail Sales report. First, some of the strength chalked up to March Retail sales, which rose +1.4% sequentially and 4.6% year over year, was pull-forward spending ahead of expected April tariffs. Comparing the March and April data should shed light on how much pull forward may have happened.
Second, because most retailers end their fiscal year in January, the trailing three-month data contained in the April Retail Sales report provides a nice yardstick by which to gauge upcoming retail earnings.
Closing out next week, the April Housing Starts and Building Permits data will be published. As of now, the consensus expectations are for overall April housing starts to dip compared to March, which we find reasonable given the tick higher in mortgage rates during April. We know, however, the movements between single-family and mult-ifamily start data are more insightful to investors.
Because we are now past the Fed’s May policy meeting, we will see the return of Fed speakers next week. We will be interested in their comments following the April CPI and PPI data. That goes double for Fed Chair Powell and his appearance that quickly follows the publication of the April PPI data on Wednesday morning. Given our comments above about what we expect to see in the April inflation data, we do not see Powell deterring from what he said Wednesday afternoon.
Here's a closer look at the economic data coming at us next week:
U.S.
Monday, May 12
· Treasury Budget – April (2 PM ET)
Tuesday, May 13
· NFIB Small Business Optimism Index – April (6:00 AM ET)
· Consumer Price Index – April (8:30 AM ET)
Wednesday, May 14
· MBA Mortgage Applications Index – Weekly (7:00 AM ET)
· Retail Sales – April (8:30 AM ET)
· Producer Price Index – April (8:30 AM ET)
· EIA Crude Oil Inventories – Weekly (10:30 AM ET)
Thursday, May 15
· Initial & Continuing Jobless Claims – Weekly (8:30 AM ET)
· Empire State Manufacturing Index – May (8:30 AM ET)
· Philly Fed Index – May (8:30 AM ET)
· Industrial Production & Capacity Utilization – May (9:15 AM ET)
· Business Inventories – March (10:00 AM ET)
· NAHB Housing Market Index – May (10:00 AM ET)
· EIA Natural Gas Inventories – Weekly (10:30 AM ET)
Friday, May 16
· Housing Starts & Building Permits – April (8:30 AM ET)
· Import/Export Prices – April (8:30 AM ET)
· University of Michigan Consumer Sentiment Index (Prelim) – May (10:00 AM ET)
International
Monday, May 12
· China: Inflation Rate – April
· Japan: Eco Watchers Survey - April
Tuesday, May 13
· China: Vehicle Sales – April
· UK: Employment Change – March
· Eurozone: ZEW Economic Sentiment Index - May
Wednesday, May 14
· Japan: Producer Price Index – April
Thursday, May 15
· China: New and Outstanding Loan Growth – April
· Japan: Machine Tool Orders – April
· UK: GDP (Prelim) – Q1 2025
· UK: Industrial and Manufacturing Production – March
· Eurozone: GDP, Employment Change – Q1 2025
· Eurozone: Industrial and Manufacturing Production – March
Friday, May 16
· Japan: GDP (Prelim) – Q1 2025
Coming off another voluminous week of quarterly earnings reports, the pace continues at a much more manageable level. While we have no Pro Portfolio companies reporting, we will continue to stitch together comments and insights from those that are, such as Cisco Systems CSCO, and update our thinking as we do so.
We will see an initial pivot next week to retail-facing companies as Walmart WMT reports, followed by Home Depot HD, Canada Goose GOOS, Target TGT, TJX Cos. TJX, Best Buy BBY, and others when we move into the second half of May. Comments next week from Walmart about tariffs, supply chain issues, pricing, and related items, and findings in the April Retail Sales report will help us formulate or, in some cases, reformulate our views.
In addition to the earnings below, we’ll be mining company presentations at investor conferences, including the Needham Technology, Media, & Consumer 1x1 Conference and J.P. Morgan’s 53rd Annual Global Technology, Media and Communications Conference that runs from May 13-15. We’ll be listening for comments about any pull forward in demand ahead of tariffs, supply chain issues, and other margin pressures, as well as any guidance revisions that might be issued.
Here's a closer look at the earnings reports coming at us next week:
Monday, May 12
· Open: Dole (DOLE), Monday.com (MNDY), Surgery Partners (SGRY)
· Close: Hertz Global (HTZ), indie Semiconductor (INDI), Rapid7 (RPD), Simon Properties (SPG)
Tuesday, May 13
· Open: CyberArk (CYBR), Silicon Labs (SLAB)
Wednesday, May 14
· Open: Tower Semi (TSEM)
· Close: Cisco Systems (CSCO), Jack in the Box (JACK)
Thursday, May 15
· Open: Advanced Drainage (WMS), Deere (DE), Walmart (WMT)
· Close: Applied Materials (AMAT), Cava Group (CAVA), Take-Two (TTWO)
Friday, May 16
· Open: Brady (BRC), Flower Foods (FLO)
Portfolio Investor Resource Guide
· Economic Data: Here's a List of Links to the Key Economic Data We Closely Watch
· Investing Terminology: 16 Key Terms Club Members Should Know
· 10-Ks: Want to Know About a Stock? Read the Company's Reports
· 10-Qs: Unlock the Numbers and Key Information Behind Your Stock With the 10-Q
· Income Statement: Our Cheat Sheet to Understanding This Financial Document
· Balance Sheet, Cash Flow Statements, and Dividends: How to Know If a Company Is Off-Kilter? Read Its Balance Sheet
· Valuation Metrics: Everyone Wants a Value. Here's How Investors Can Find
· Thematic Investing 101 Webinar
The Portfolio Ratings System
1 - Buy Now (BN): Stocks that look compelling to buy right now.
2 - Stockpile (SP): Positions we would add to on pullbacks or a successful test of technical support levels.
3 - Holding Pattern (HP): Stocks we are holding as we wait for a fresh catalyst to make our next move.
4 - Sell (S): Positions we intend to exit.
💵💰 Everyone’s guessing — our experts aren’t. Get the real playbook for Investing in Uncertain Times at TheStreet Pro’s exclusive Quarterly Meeting on May 14th, 2025 at 12PM ET. (Don’t miss it) 💵💰
