Weekly Roundup: Portfolio Advances as Powell Leaves Rate Cut Door Open
Plus, Nvidia earnings and investor conferences are on next week’s radar.
You've reached your free article limit
You've read 0 of 1 free Pro articles.
Heading into Fed Chair Jerome Powell’s Jackson Hole comments on Friday, the market was trending toward a week-over-week decline as lofty market expectations for a September rate cut moved lower, companies signaled fresh price increases ahead and the Flash August PMI report signaled a rebound in August job creation while inflation pressures persisted.
During Powell’s remarks, he ran through a variety of potential scenarios for the employment market as well as inflation pressures.
Suffice to say, while Powell left the door open for a September rate cut should the upcoming economic data lean that way, he also gently pushed back on the market’s high expectation for a rate cut should oncoming job creation and inflation data support what we saw in Thursday's Flash August PMI report from S&P Global. With the market rallying shortly after Powell concluded his Jackson Hole comments on monetary policy, it’s safe to say the market focused on Powell leaving the door open for a possible rate cut on September 17, given the rejiggered expectations found in the CME FedWatch Tool. Exiting the week, the expected probability for a 25 basis point rate cut was back at just over 89%, higher than where it was the prior week.
That would suggest Powell’s effort to prepare the market fell on deaf ears as the market once again took away what it wanted to from his comments, as opposed to the intended message. In ruminating on Powell’s comments, we recognize that the next three and a half weeks will bring multiple economic data points that will determine whether the Fed actually delivers a rate cut in September. We will, of course, continue to follow the data, adjusting our expectations based on what it reveals.
Looking at the S&P 500, following Friday’s market rebound, it is less than 1% away from its all-time reached on… wait for it… August 15. That means that, following Powell’s comments, we are back where we were a week ago with the S&P 500 trading near 24.4x expected consensus 2025 EPS.
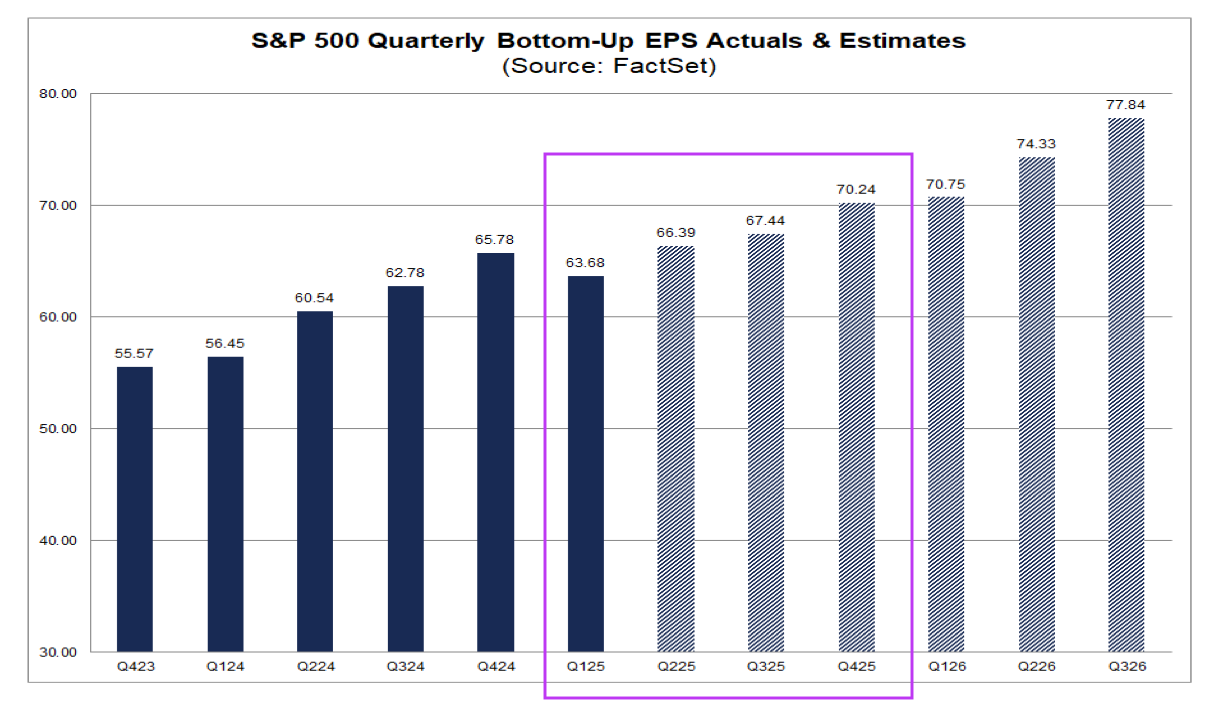
Since March, we’ve seen declining expectations for 2H 2025 S&P 500 EPS measured against 1H 2025. Based on the latest figures from FactSet, that rate of growth now stands at 5.9% compared to 8.5% at the end of June and nearly 14% exiting March. With the market bumping up against all-time highs, the S&P 500 valuation stretched, the discussed slide in EPS growth expectations and the market pricing in a September rate cut, for the S&P 500 to move demonstratively higher from current levels, it stands to reason one item we will need to see will be a positive inflection point in 2H 2025 EPS growth expectations.
So far, that inflection point has yet to emerge, but that could change next week.
During the last week of August, not only will Nvidia NVDA, the S&P 500’s largest constituent at roughly 7.5% of its weight, report its quarterly results and update its guidance for the back half of 2025, but we also have multiple investor conferences on tap. During those presentations, management teams will provide some color on the current quarter, and they could offer an updated view on the December quarter. We expect the topics of end-market demand, tariffs, margins and pricing to be central topics across the Deutsche Bank Technology Conference; the Evercore Semiconductor, IT Hardware & Networking Conference; and the Jefferies Semiconductor, IT Hardware & Communications Conference.
We will have our ear to the ground so we can connect the dots from the company presentations held during those events and other companies reporting next week. We will tie what we learn back to the Portfolio’s holdings and make any needed adjustments.
While it will likely prove to be another busy week for the Portfolio, let’s remember that trading volumes during the last week of August tend to be on the thin side as we approach the Labor Day holiday weekend. That could translate into a new opportunity or two for the Portfolio as we get ready for the September-December push.
Catching Up on the Portfolio This Week
Like the market, the Portfolio added to its quarter-to-date gain, building on the strides it made during the first half of the year.
Notable performers for the week included shares of Bank of America BAC, American Express AXP, SuRo Capital SSSS, TJX Companies TJX and Dutch Bros BROS. Following the late-week rebound, we can also add Axon AXON shares to that list. Those and other gains in the portfolio were mitigated by declines in the shares of Palantir PLTR, something we used to our advantage during the week, as well as Meta META, Nvidia and Marvell MRVL shares.
While for some, the back half of August is expected to be a quieter time of year. That wasn’t the case for the Portfolio as we tapped our shopping list multiple times over the last few days:
We opened the week by picking up additional shares of ServiceNow NOW at $877.52 and followed that up on Tuesday by adding shares of both Waste Management WM and SuRo Capital at $225.06 and $8.62, respectively. As we alluded to above, on Wednesday, we dipped our toes deeper into shares of Palantir at $154.61. On Friday, we did the same with public safety company Axon AXON, adding some shares at $779.99.
After this week’s moves, we still have more than 10% of the Portfolio’s assets in cash, a nice bit of firepower that we can utilize in the coming weeks as upcoming data determines whether a September rate cut is on the table… or not. With that in mind, we’re developing some new candidates for the Portfolio as we contemplate not only some new Portfolio signals, ones we’ll share with you on Saturday, but also as we think about the Portfolio over the coming 12-plus months.
To that end, on Friday, we added shares of Trade Desk TTD to the Portfolio’s Bullpen. However, as we noted in that alert, we will need to become comfortable with the company’s competitive position, especially after reports that one of its key customers, Walmart WMT, is no longer exclusive.
Now, let’s turn and see what Wall Street had to say about the Portfolio’s holdings over the last few days:
Loop Capital trimmed its Apple target to $226 from $230.
Evercore ISI lifted its Eaton ETN target to $376 from $349.
Ahead of its earnings next week, Evercore ISI bumped up its Nvidia price target to $214 from $190. Wedbush took its target to $210 from $175. Edging them both out, KeyBanc raised its NVDA target to $215 from $190.
Telsey Advisory upped its TJX target to $155 from $150, Baird lifted its target to $152 from $143, but Evercore ISI raised its TJX target to $162 from $150
Wells Fargo reiterated its Overweight rating and $95 price target for Marvell shares, sharing that competitive concerns are overblown and optics positioning remains strong.
Truist lifted its Microsoft MSFT target to $675 from $650 as it sees continued AI and cloud momentum continuing.
United Rentals URI saw its share price target hoisted to $1,075 from $921 at Evercore ISI, with the firm seeing further multiple expansion ahead, fueled by continued EPS growth.
This Week's Portfolio Videos and Podcasts
We cover a lot of ground during the week in our Daily Rundowns. If you happened to miss one or more of them, here are some helpful links:
Monday, August 18: IPO Momentum Could Impact These 3 Holdings
Wednesday, August 20: Stocks & Markets Podcast - Thematic Investing 101
Key Global Economic Readings
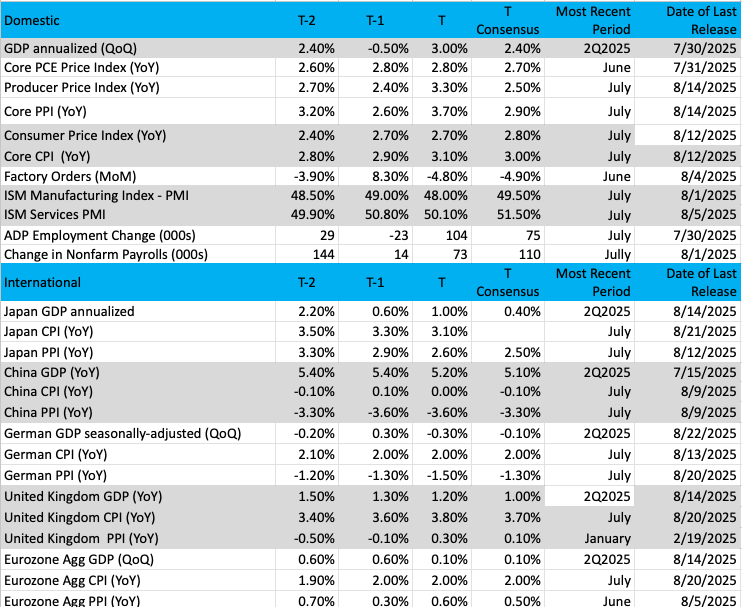
(Note: T is the most recent period, T-1 is the prior period's reading, and T-2 is two periods back, the intent being to illustrate any trends.)
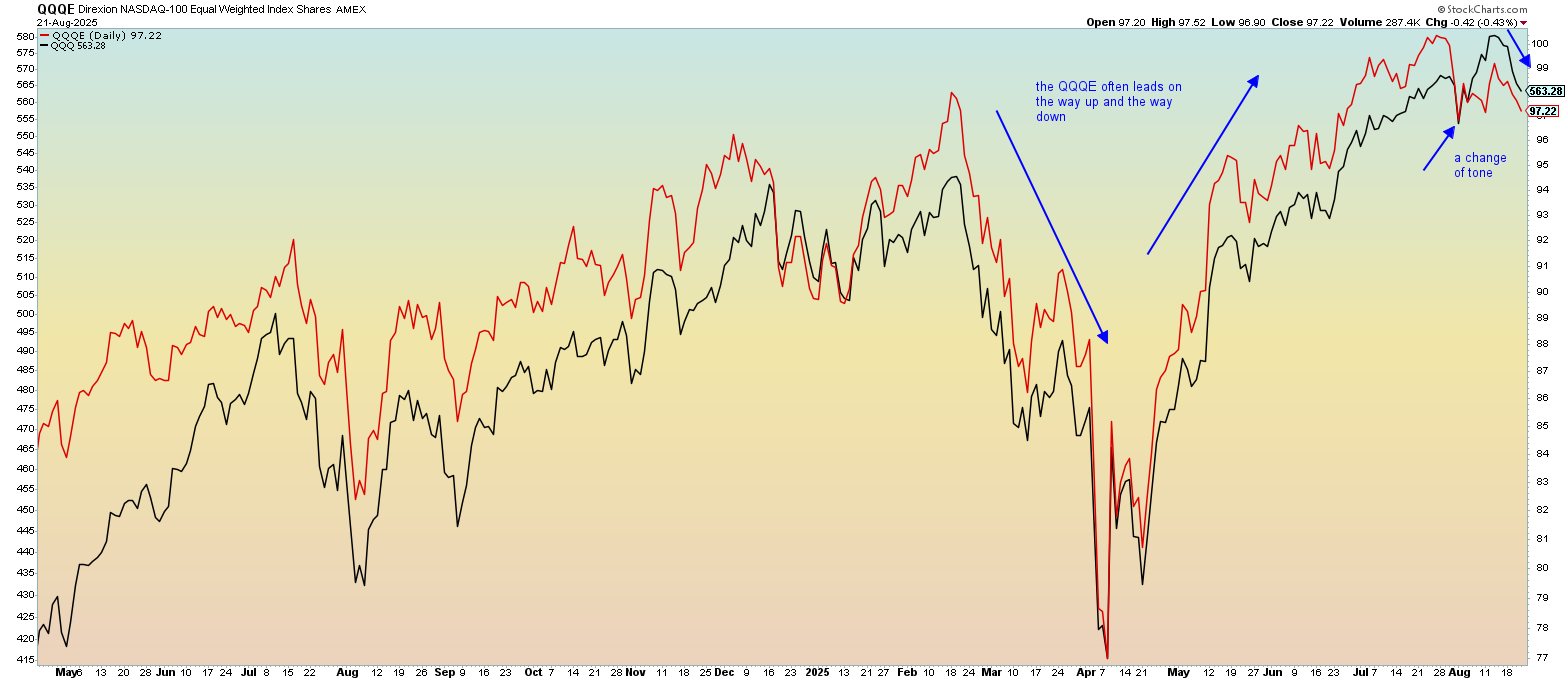
Chart of the Week: The Nasdaq 100 – Equal Weight vs. Market Cap Weight
Divergences come and go, but when we can identify them, there are ways to take advantage until they clear up.
One such divergence we have seen lately is between the Nasdaq 100 QQQ and its equal-weighted counterpart, the Direxion NASDAQ-100 Equal Weighted Index Shares QQQE. We compare the price action of these two ETFs to see if the entire market is moving together or if it's just a few names that are leading the pack.
Much like the SPY/RSP comparison we do once a month here in the roundup, the QQQ/QQQE is based on the differential of market cap influence/equal weight. The QQQE applies an equal weight for each component, while the QQQ is skewed towards the companies with the highest market capitalization.
By comparison, the Magnificent 7 holds a 40% weighting of the QQQ, but in the QQQE, it is just 7% (seven names out of 100). The skew towards the "heavyweights" in the QQQ has often masked the overall performance of the Nasdaq 100, but the QQQE brings those discrepancies to light.
Notice in the chart for a long period of time, the QQQE (in red) has long been the better performer, especially on the way up. But it is most recently the QQQ that has led the way when the market was declining after a spectacular run-up in the early part of August. What goes up must come down.
If this divergence continues, we will eventually see the QQQE start leading again, and if it is to the upside, then we would say the condition is "healthy." Why is that? Simply put, a broadening out of a rally is much more reliable for continuation, and when corrections occur, there are strong support areas for more stocks rather than a select few.
Other charts we shared with you this week were:
Monday, August 18: S&P 500 - The S&P 500 Continues to Move the Goal Posts
Monday, August 18: TJX Companies - A Close Look at TJX Ahead of Earnings
Tuesday, August 19: American Express - What's Next as This Holding Glides Down to Test Support?
Wednesday, August 20: United Rentals - Concern for United Rentals After All-Time High?
Thursday, August 21: Broadcom AVGO - Watching This Bullpen Name as it Could Be Time to Buy
The Week Ahead
Following Thursday’s Flash August PMI data and Fed Chair Powell’s Jackson Hole comments on Friday, the two economic data points we’ll be focusing on next week are the second estimate of Q2 2025 GDP and the July PCE Price Index. We’ve chin-wagged quite a bit about recent inflation data, and we’ll be looking to see to what degree that upward pressure is captured in the core PCE Price Index.
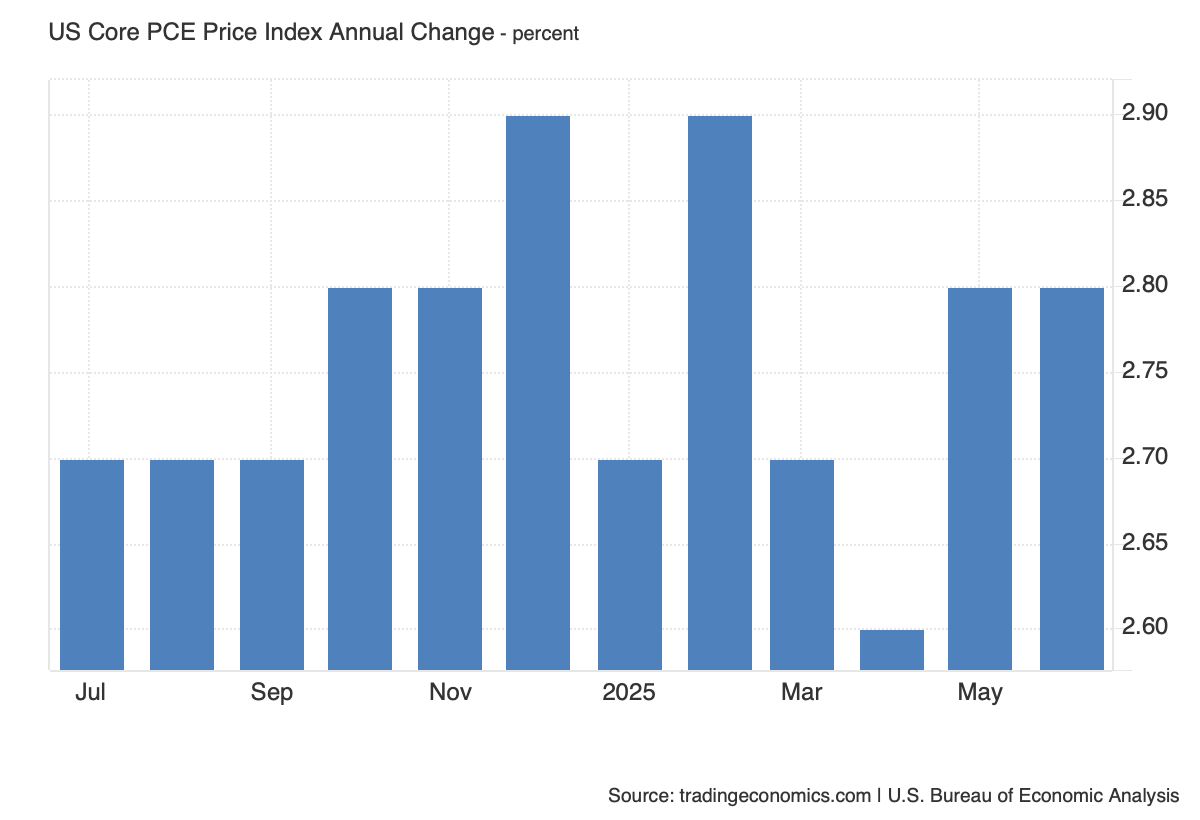
Odds are we will see some movement higher in the reported figures. The question to be answered is how much higher compared to the 2.8% year-over-year figure posted for May and June?
Heading into the weekend, the Cleveland Fed’s Inflation Nowcasting model pegs July core PCE at 2.89% with a 2.96% figure for August. Should the July core PCE come in at that level for July or higher, it would lead the trailing year-over-year three-month core PCE figure to break out of the 2.7% range it’s been holding since April. That would likely catch some eyebrows, especially if the Volatility Index (VIX) remains below the 15.0 level heading into the data on Friday.
As we wait for those July figures, we’ll continue to parse comments from Fed speakers next week, but candidly, what they say after the Labor Day holiday will be more important. We say this because they will not only have the July PCE Price Index data in hand, but ISM’s August PMI data, and then the August Employment Report. What those data points show in aggregate will inform us as to whether a September rate cut is really on the table.
In tandem with the July PCE Price Index, we’ll get the July Personal Income and Spending reports. In the one for spending, we’ll be digging into what it says about spending on services, which is not captured in the monthly Retail Sales report.
Here's a closer look at the economic data coming at us next week:
U.S.
Monday, August 25
- Chicago Fed National Activity Index – July (8:30 AM ET)
- New Home Sales – July (10:00 AM ET)
Tuesday, August 26
- Durable Orders – July (8:30 AM ET)
- FHFA Housing Price Index – June (9:00 AM ET)
- S&P Case Shiller Home Price Index – June (9:00 AM ET)
- Consumer Confidence – August (10:00 AM ET)
Wednesday, August 27
- MBA Mortgage Applications Index – Weekly (7:00 AM ET)
- EIA Crude Oil Inventories – Weekly (10:30 AM ET)
Thursday, August 28
- Initial & Continuing Jobless Claims – Weekly (8:30 AM ET)
- GDP (2nd Estimate) – Q2 2025 (8:30 AM ET)
- Pending Home Sales – July (10:00 AM ET)
- EIA Natural Gas Inventories – Weekly (10:30 AM ET)
Friday, August 29
- Advanced Retail & Wholesale Inventories – July (8:30 AM ET)
- Personal Income & Spending – July (8:30 AM ET)
- PCE Price Index – July (8:30 AM ET)
- University of Michigan Consumer Sentiment Index – August (10:00 AM ET)
International
Monday, August 25
- Japan: Leading Economic Index – June
Wednesday, August 27
- China: Industrial Profits - July
Thursday, August 28
- Eurozone: Loans to Companies & Households – July
- Eurozone: Economic Sentiment, Consumer Confidence, Inflation Expectations - August
Friday, August 29
- Japan: Industrial Production, Retail Sales – July
- Japan: Consumer Confidence – August
The wave of retailer earnings continues next week with quarterly results from PVH PVH, Kohl’s KSS, Abercrombie & Fitch ANF, Best Buy BBY, Dicks’ Sporting Goods DKS and multiple others. These results and updated looks for the balance of the year will help shape consumer spending expectations as we approach the all-important holiday shopping season. When Affirm AFRM reports, the adoption of its Buy Now, Pay Later (BNPL) could also bring another view on consumer spending. We suspect that the results will confirm a bifurcated consumer, one we capture in the Portfolio through our positions in American Express, Costco COST, Amazon AMZN and TJX Companies.
Alongside that retail wave, we have the largest component of the S&P 500 and Nasdaq Composite reporting next week. That’s right, quarterly results from Nvidia are on tap.
Across the June quarter earnings season, one of the themes we’ve noticed is that “beat and reiterate” quarters have been treated more like earnings misses. Because NVDA shares have moved a considerable distance since their early April low, more than 80%, and spending expectations from Big Tech on AI and data centers for the coming quarters have moved higher, it’s fair to say Nvidia's expectations are running high. We intend on being long-term owners of NVDA shares, but a post-earnings pullback could bring an opportunity for folks who are underweight the shares.
We also have Marvell reporting, and Nvidia’s AI and data center comments will shape expectations for those results. With Marvell, we’ll also be looking for an update on the company’s proprietary custom AI silicon business, as well as signs that demand for its Enterprise Networking and Carrier Infrastructure segments is picking up.
Adding context for updated guidance from Nvidia and Marvell, we’ll be following comments about AI and cloud adoption from Snowflake SNOW, Dell DELL and HP HPQ. Given our position in Qualcomm QCOM, what Dell and HP have to say about PC demand, specifically AI PC demand, in the coming quarters will also be of interest.
Here's a closer look at the earnings reports coming at us next week:
Monday, August 25
- Close: Heico (HEI)
Tuesday, August 26
- Close: Box (BOX), Okta (OKTA), PVH (PVH)
Wednesday, August 27
- Open: Abercrombie & Fitch (ANF), JM Smucker (SJM), Kohl’s (KSS), MasterCraft (MCFT)
- Close: Agilent (A), CrowdStrike (CRWD), HP (HPQ), NetApp (NTA), Nvidia (NVDA), Snowflake (SNOW), Urban Outfitters (URBN)
Thursday, August 28
- Open: Bath & Body Works (BBWI), Best Buy (BBY), Brown-Forman (BF.B), Burling Stores (BURL), Dick’s Sporting Goods (DKS), Dollar General (DG), Hormel Foods (HRL), Victoria’s Secret (VSCO)
- Close: Affirm (AFRM), Ambarella (AMBA), Dell (DELL), Elastic (ESTC), Gap (GPS), Marvell (MRVL), Ulta Beauty (ULTA)
Portfolio Investor Resource Guide
- Economic Data: Here's a List of Links to the Key Economic Data We Closely Watch
- Investing Terminology: 16 Key Terms Club Members Should Know
- 10-Ks: Want to Know About a Stock? Read the Company's Reports
- 10-Qs: Unlock the Numbers and Key Information Behind Your Stock With the 10-Q
- Income Statement -Our Cheat Sheet to Understanding This Financial Document
- Balance Sheet, Cash Flow Statements, and Dividends - How to Know If a Company Is Off-Kilter? Read Its Balance Sheet
- Valuation Metrics - Everyone Wants a Value. Here's How Investors Can Find
- Thematic Investing 101 Webinar
The Portfolio Ratings System
1 - Buy Now (BN): Stocks that look compelling to buy right now.
2 - Stockpile (SP): Positions we would add to on pullbacks or a successful test of technical support levels.
3 - Holding Pattern (HP): Stocks we are holding as we wait for a fresh catalyst to make our next move.
4 - Sell (S): Positions we intend to exit.
