Weekly Roundup: Market Volatility Is Here to Stay
Stocks are making large moves daily, which is starting to make investors very nervous.
You've reached your free article limit
You've read 0 of 1 free Pro articles.
It was a tumultuous week for sure as market volatility rose to levels not seen in months, and sustainably higher as well. It has been more than a decade since we had the volatility index (VIX) stay above 40 for a week or more. In fact, it is so rare that it has only occurred a handful of times in history.
What does this all mean?
Uncertain outcomes create worry and doubt for investors, and a signal to sell is suddenly in vogue. The market is struggling to find some footing and may have found it Wednesday with an enormous rise up. The S&P 500 jumped 9.7% while the Nasdaq pushed higher by more than 12% on the day, but failed to follow through Thursday, before rising Friday and settling into a wide range. That range is going to frustrate all investors and traders as each move up or down will trigger a response to either sell or buy, which will often be the wrong choice at the time.
In any case, stocks are struggling, but so are bonds, where we find the 10-year yield up near 4.5%. It was this level that Treasury officials "off the record" displayed some concerns. Treasury Secretary Bessent is trying to get yields on the long end down, but with some heavy sellers in the market (China, Japan?) there is a big supply of bonds coming on line that need to be bought up. Further, if yields rise it means an increased cost to finance our ballooning debt, also a negative situation (increased interest costs which will increase the deficit). Meanwhile, the dollar has been declining while gold is up at all-time highs, so we can see where money is moving to (away from dollars).
Earnings season is upon us, and that means we’ll get a good read on the future and how companies view the new tariff policy. We heard from a few banks this week, and CEOs expressed some concern over this policy and how it could stunt economic growth dramatically. They all stopped short of calling for a recession, however. Goldman Sachs had modeled a strong chance of it happening on Tuesday (they retracted the statement the following day).
Wednesday was an historic trading day as mentioned above, but if there is not a continuation higher then we could be facing an "Indian Summer" in markets. We hope for some clarity on issues that need to be addressed so businesses can get back to it and not have to worry about issues they have little ability to resolve.
Catching Up on the Portfolio This Week
Stocks were on the move this past week and no doubt we have the news cycle and volatility to thank for it. Technology names were hit the hardest as investors suddenly realized tariffs were going to hurt earnings badly.
It’s not enough that sentiment is sour, the Fear& Greed Index ticked way down to a 4 this week (on a scale of 1-100). Wednesday’s relief rally was bubbling from earlier in the week and simply gushed out buyers of stocks that seemed for one day a very pleasant experience.
We experienced some pain in the portfolio this week but not as bad due to the fact we have some higher defensive names represented.
We chose to stand pat as our defensive posture started to pay dividends. The SH and PSQ worked to stymie some extended volatility and while these instruments did not have a commensurate rise versus our long positions, it certainly felt good to have a bit of protection in place, along with a higher cash balance. That will serve us when when we are ready to deploy it.
Taiwan Semiconductor TSM, not a holding, did have strong numbers out Thursday morning with bodes well for portfolio holdings such as Qualcomm QCOM, Marvell MRVL, Nvidia NVDA and Apple AAPL and perhaps a few more names.
Financials are in view here with some having reported on April 11. We’ll hear from Bank of America BAC next week along with American Express AXP to see how the consumer is faring. Prices are still elevated as the CPI told us this week but they are trending down ever so slowly.
This Week's Portfolio Videos
We cover a lot of ground during the week in our Daily Rundowns. If you happened to miss one or more of them, here are some helpful links:
Monday, April 7: What We're Watching For as Tariff Turmoil Keeps Us Sidelined
Tuesday, April 8: Stocks Are Rebounding, but We’re Not Out of the Woods Yet
Wednesday, April 9: Why Tariff Developments, Not March Data Will Drive The Market
Key Global Economic Readings
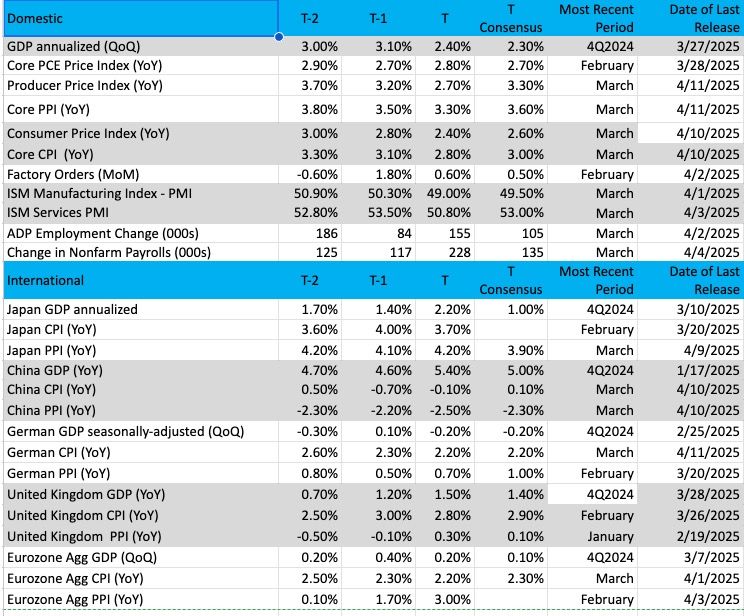
(Note: T is the most recent period, T-1 is the prior period's reading and T-2 is two periods back, the intent being to illustrate any trends)
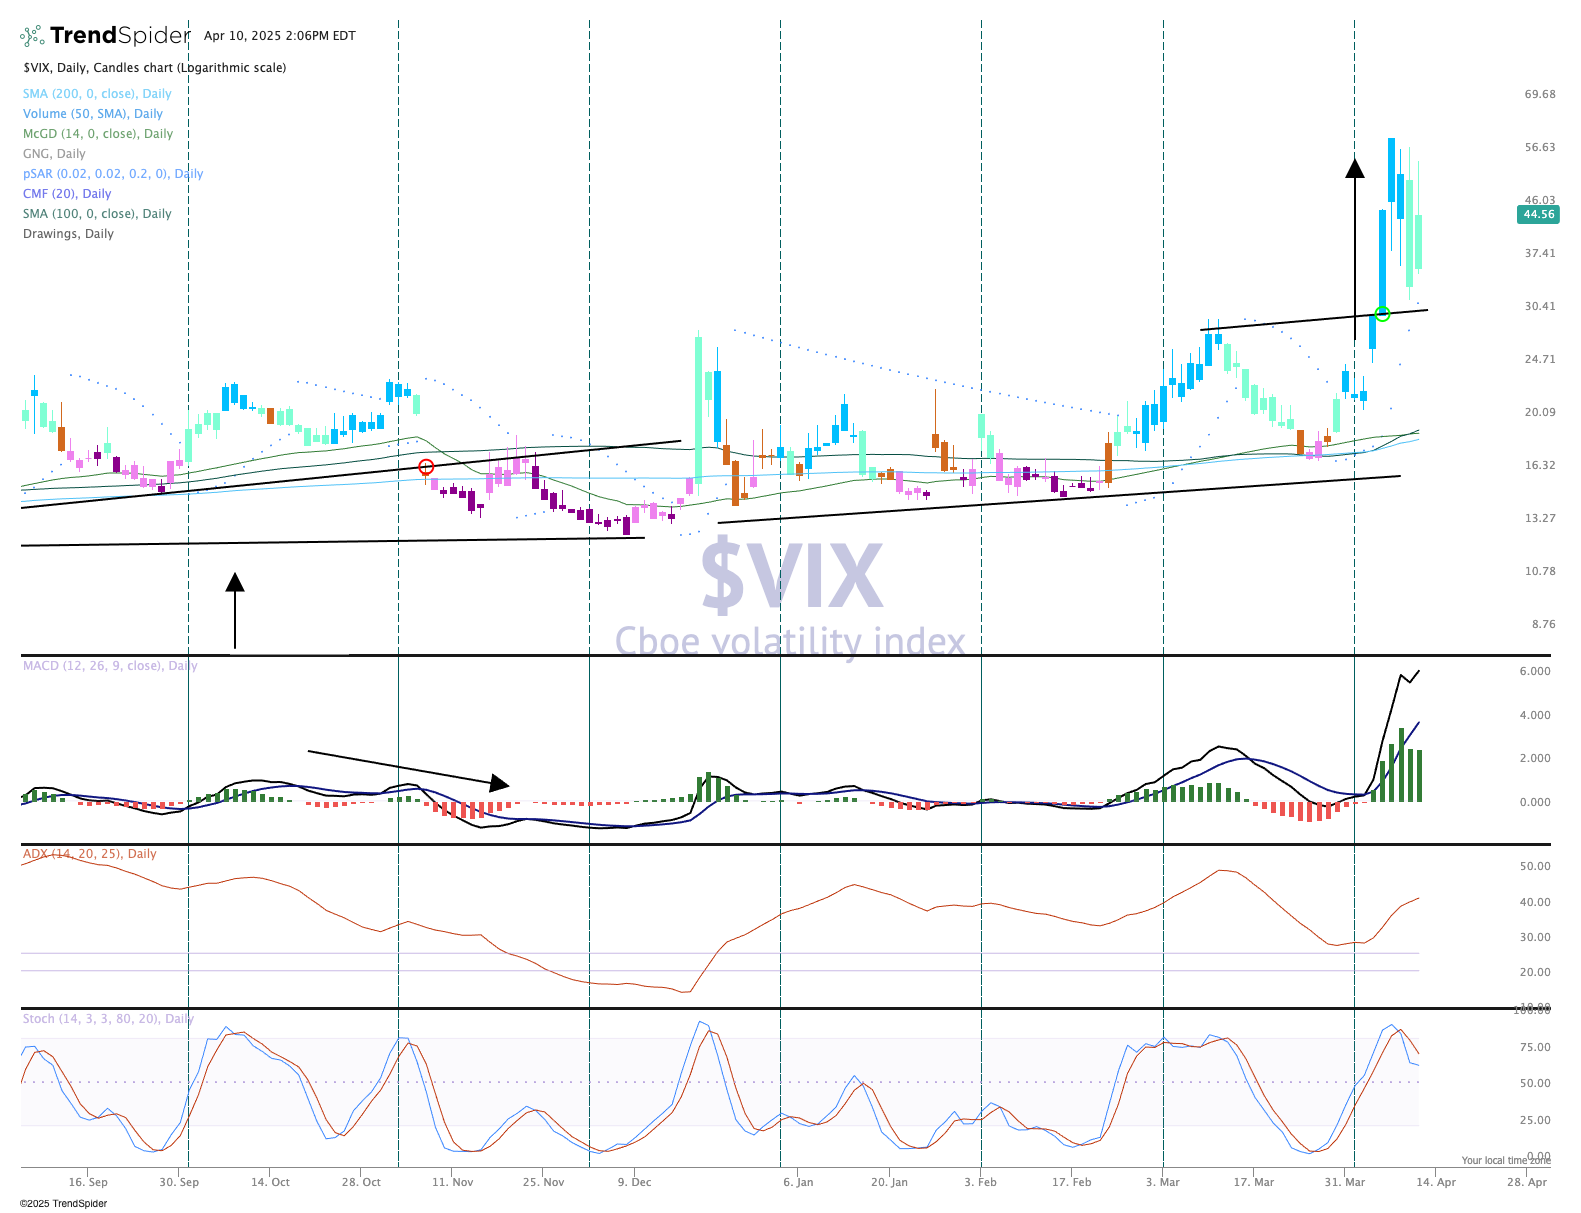
Chart of the Week: The Volatility Index
The volatility index, or the VIX for short, attempts to capture the emotions of the market. When low or subdued, the message is market sentiment is bullish, no need to panic, and a sense of complacency is built in. When the VIX is elevated and rising, the idea is worry, concern and fear with market players reaching for protection or just flat out selling, as they believe lower prices are ahead. Why not get out now before the big drop occurs.
But as markets are more focused on the news that is driving decisions, ultimately the emotional response is movement in the market. Further, investors and traders make "bets" on different outcomes, one of these being the economy and whether the U.S. could flip into a recession, or something worse.
2025 has been the year of volatility, and we have recently experienced sharp rises in the VIX that have not been seen since 2020, and before that 2008/2009. Could this continue and create havoc on the markets? It already has and it could continue if the uncertainty remains. Remember, the stock market hates uncertainty, and the longer situations persist without answers the more doubt is created in investors’ minds. That doubt causes some investors to panic and to hit the sell button. In those circumstances, you have the VIX running hot, and there is nowhere to hide.
The VIX rose up this week to the 60 level and remains buoyant. Buyers are picking up protection at high levels, and option prices are very expensive as the market looks for wide moves. Remember the rule of 16, a 1% implied move for every 16 points. Hence, a VIX at 32 implies a 2% move, at 48 a 3% move and so on. Is this sustainable? Not in the long run, because stocks go up over the long term. But for the moment, fear is gripping investors and not letting go.
Momentum is in favor of the volatility bulls, most certainly. But the fear index has reached some overbought readings and could slide, as that big move down Wednesday showed when some news hits. If the VIX falls even more and settles down below the 200-moving average, we could have some upside potential. Until then, wild times!
Other charts we shared with you this week were:
Monday, April 7: S&P 500 - Seeing 'Purple' in a Dangerous Market
Monday, April 7: ProShares Short S&P 500 (SH) - Our 'Insurance Plan' Is Working
Tuesday, April 8: Dutch Bros (BROS) - A Jolt Off Important Support
Wednesday, April 9: New Bullpen Names Reflects Sentiment
Thursday, April 10: Is This Holding Out of the Woods Yet?
The Week Ahead
Here's a closer look at the economic data coming at us next week:
U.S.
Monday, April 14
- Consumer Inflation Expectations – March (11:00 AM ET)
Tuesday, April 15
- Empire State Manufacturing Index – April (8:30 AM ET)
- Import/Export Prices – March (8:30 AM ET)
Wednesday, April 16
- MBA Mortgage Applications Index – Weekly (7:00 AM ET)
- Retail Sales – March (8:30 AM ET)
- Industrial Production & Capacity Utilization – March (9:15 AM ET)
- NAHB Housing Market Index – April (10:00 AM ET)
- EIA Crude Oil Inventories – Weekly (10:30 AM ET)
Thursday, April 17
- Initial & Continuing Jobless Claims – Weekly (8:30 AM ET)
- Housing Starts & Building Permits – March (8:30 AM ET)
- Philly Fed Index – April (8:30 AM ET)
- EIA Natural Gas Inventories – Weekly (10:30 AM ET)
Friday, April 18
- US equity markets closed – Good Friday
International
Monday, April 14
- China: Imports/Exports – March
- Japan: Industrial Production & Capacity Utilization - February
Tuesday, April 15
- Germany: Wholesale Prices – March
- UK: Employment Change – February
- Eurozone: Industrial Production – February
- Eurozone: Economic Sentiment Index – April
Wednesday, April 16
- China: GDP – 1Q 2025
- China: Retail Sales, Fixed Asset Investment – March
- UK: Inflation Rate – March
- Eurozone: Inflation Rate (Final) – March
- Canada: Bank of Canada Interest Rate Decision
Thursday, April 17
- Germany: Producer Price Index – March
- Eurozone: European Central Bank Interest Rate Decision
Here's a closer look at the earnings reports coming at us next week:
Monday, April 14
- Open: Goldman Sachs (GS),
- Close: Applied Digital Corp. (APLD)
Tuesday, April 15
- Open: Albertsons (ACI), Bank of America (BAC), Citigroup (C), Ericsson (ERIC), Johnson & Johnson (JNJ)
- Close: Interactive Brokers (IBKR), JB Hunt (JBHT), United Airlines (UAL)
Wednesday, April 16
- Open: Abbott Labs (ABT), ASML (ASML),
- Close: Alcoa (AA), CSX (CSX),
Thursday, April 17
- Open: American Express (AXP), Charels Schwab (SCHW), DR. Horton (DHI), Fifth-Third (FITB), Taiwan Semiconductor (TSM), Truist (TFC),
- Close: Netflix (NFLX)
Portfolio Investor Resource Guide
- Investing Terminology: 16 Key Terms Club Members Should Know
- Income Statement: Our Cheat Sheet to Understanding This Financial Document
- Balance Sheet, Cash Flow Statements, and Dividends: How to Know If a Company Is Off-Kilter? Read Its Balance Sheet
- Valuation Metrics: Everyone Wants a Value. Here's How Investors Can Find
The Portfolio Ratings System
1 - Buy Now (BN): Stocks that look compelling to buy right now.
2 - Stockpile (SP): Positions we would add to on pullbacks or a successful test of technical support levels.
3 - Holding Pattern (HP): Stocks we are holding as we wait for a fresh catalyst to make our next move.
4 - Sell (S): Positions we intend to exit.
