Weekly Roundup: Keeping Our Lead as the S&P Faces Potential Market Seasonality
We rang the register and exited one position, fortifying our cash levels for opportunities down the line.
You've reached your free article limit
You've read 0 of 1 free Pro articles.
The S&P 500 recovered the ground it lost over the last two weeks, leaving it up more than 2.9% as we approach the halfway point for the current quarter. We’re pleased to report that the Pro Portfolio more than held its own against that market benchmark as it closed the week ahead of the S&P 500 on a year-to-date basis by more than a nose.
During the week, we were joined by Freedom Capital Market’s Jay Woods on this week’s Stocks & Markets podcast, with Jay pointing out that the level to be mindful of for the S&P 500 is 6400. The S&P 500 closed Friday at 6389.45, and its breadth was, as Jay shared with us, horrible.
With 90% of the S&P 500 having reported quarterly results, the remaining big dog of the S&P 500 to report is Nvidia NVDA, which accounts for ~7.77% of the S&P 500. That means next week we may see some minor adjustments to the consensus EPS figures for the S&P 500 tallied by FactSet. What we see with this latest update from August 8 is that second-half EPS growth for the S&P 500 has fallen to 5.8% compared to the first half.
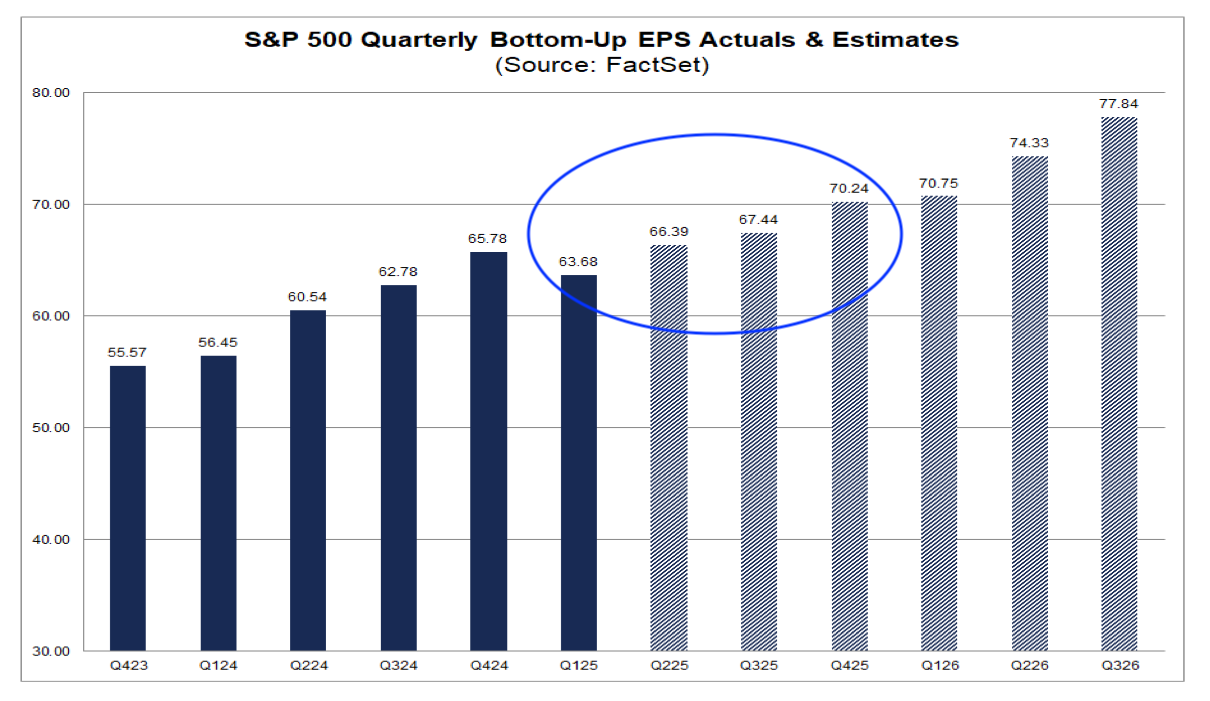
That continues the slide in EPS growth expectations, which resumed at the start of the current earnings season. At the end of June, the expectation was that H2 2025 EPS would rise 8.5%. At the end of July, that growth rate slipped to 7.9% and last Friday it stood at 6.8%.
And yet the S&P 500 is less than 0.5% from its record high set on July 31 as we move deeper into one of the seasonally worst times of the year for the market. Since 1950, the S&P 500 has lost an average of 0.01% in August and 0.72% in September, per data tallied by Ycharts. We understand that past performance is not indicative of future results because things can change, but with slower EPS growth prospects and the S&P 500 close to all-time highs as we head into a known period of weakness, we’ll tread carefully just in case the market goes through its latest self-fulfilling prophecy.
Another reason to tread carefully near-term, as we look to next week and the week after, the Fed and the market’s expectation for rate cuts is likely to be back in the center ring. Next week brings the July CPI and PPI reports, and if the core figures repeat what we saw in the July ISM Services report, they would push back on the market think for a September rate cut. Heading into the weekend, the CME FedWatch Tool shows an 89.4% probability the Fed will deliver a 25-basis point rate cut in September and potentially two more by the end of the year.
The following week, we have the Kansas City Fed’s annual Jackson Hole Economic Policy Symposium being held on August 21-23. Fed Chair Powell is expected to deliver a keynote address on Friday, August 22, which means he will not only have the July CPI and PPI data in hand but also the August Flash PMI report from S&P Global. That data will be published the day before Powell’s keynote, and we will be sure to share with you what the data tell us about the economy, job creation, and inflation pressures in August and how that may fit with rate cut expectations.
Back to next week, we have a bit of a lull on the earnings front, and given the timing of the July CPI and PPI reports, more than likely, it means President Trump and the White House could drive the start to next week’s trading. We’ll be seeing what develops over the weekend, and that will inform the trading plan we’ll share with you Monday morning. As we’ll discuss in the next section of the Roundup, the Pro Portfolio’s cash position is back over 13% and that gives us some firepower to take advantage of potential market seasonality.
Saturday, we’ll have our latest batch of Portfolio signals, and on Sunday, another helping of articles and streamin ideas that caught our attention. We’ll also have a summer reading recommendation for all those members heading out to grab some R&R before September.
Enjoy the weekend, see you back here on Monday.
Catching Up on the Portfolio This Week
The Pro Portfolio powered ahead this week, rising ~2.7% compared to the S&P 500’s gain of ~2.4%. That left the Portfolio in the same position it was at the end of July, ahead of the S&P 500 on a year-to-date basis.
Helping drive the week’s outperformance were shares of Palantir PLTR, Dutch Bros BROS, Axon Enterprise AXON, and Apple AAPL with their double-digit moves higher. Other outperformers for the week included Amazon AMZN, Costco COST, Alphabet GOOGL, Marvell MRVL, Morgan Stanley MS, Nvidia NVDA, and TJX Companies TJX.
The collective gains of those 11 positions and several others were mitigated by measured declines in shares of ServiceNow NOW and Elastic ESTC. We first reduced the Portfolio’s exposure to ESTC shares and downgraded them on Thursday, and then exited the position completely on Friday.
That move bumped up the Portfolio’s cash position, as did our ringing the register for a 76% gain early in the week following the post-earnings pop in Axon shares. The combined moves put the Portfolio’s cash position at 13.4% of its assets. As we move deeper into the seasonally weaker time of year for the market, we’re okay having a little more cash on hand, but we will continue to look for opportunities in well-positioned companies benefiting from multi-year structural tailwinds that are poised to grow their EPS faster than the S&P 500.
Our shopping list includes a few existing positions, should they hit the right price, such as Waste Management WM and TJX Companies, as well as others that have pulled back, like ServiceNow. Near-term, we expect to revisit the Bullpen, and that could mean a new idea or two before too long.
During the week, we increased our price targets for Axon to $860 from $840, Palantir to $190 from $160, and Eaton ETN to $420 from $400. We also reiterated our $85 target for Dutch Bros BROS following its June-quarter earnings report and lifted guidance, and did the same with our Costco COST price target following the company’s impressive July sales report.
Now let’s see what Wall Street had to say about our holdings this week:
Melius Research lifted its Apple AAPL target to $260 from $246, and BofA reset its AAPL target at $250 from $240.
Guggenheim lifted its Dutch Bros target to $76 from $72, while Morgan Stanley upped its target to $84 from $80. Barclays went a bit further and reset its BROS target at $92 from $84.
Raymond James upped its Eaton target to $415 from $380. Morgan Stanley bumped up its target for the shares to $425.
Wedbush increased its Palantir price target to $200 from $160, Citi set its at $177, up from $155, and Loop Capital raised its to $180.
Citi increased its Vulcan Materials VMC target to $321 from $305.
This Week's Portfolio Videos
We cover a lot of ground during the week in our Daily Rundowns. If you happened to miss one or more of them, here are some helpful links:
Monday, August 4: Our Plan for Palantir With Earnings Set for After Monday's Market Close
Tuesday, August 5: Foxconn Revenue Supports Our Positions in 5 Holdings
Wednesday, August 6: Stocks & Markets Podcast: Sectors to Avoid With Jay Woods
Key Global Economic Readings
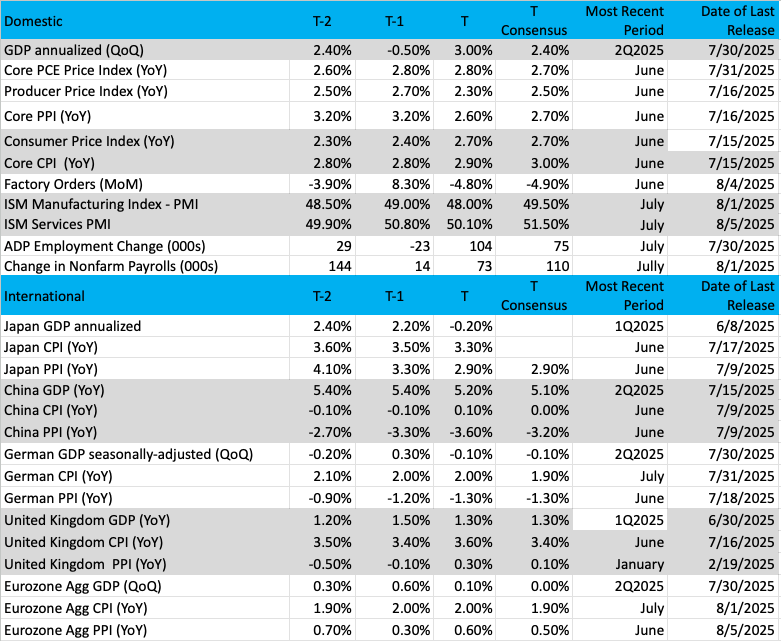
(Note: T is the most recent period, T-1 is the prior period's reading, and T-2 is two periods back, the intent being to illustrate any trends.)
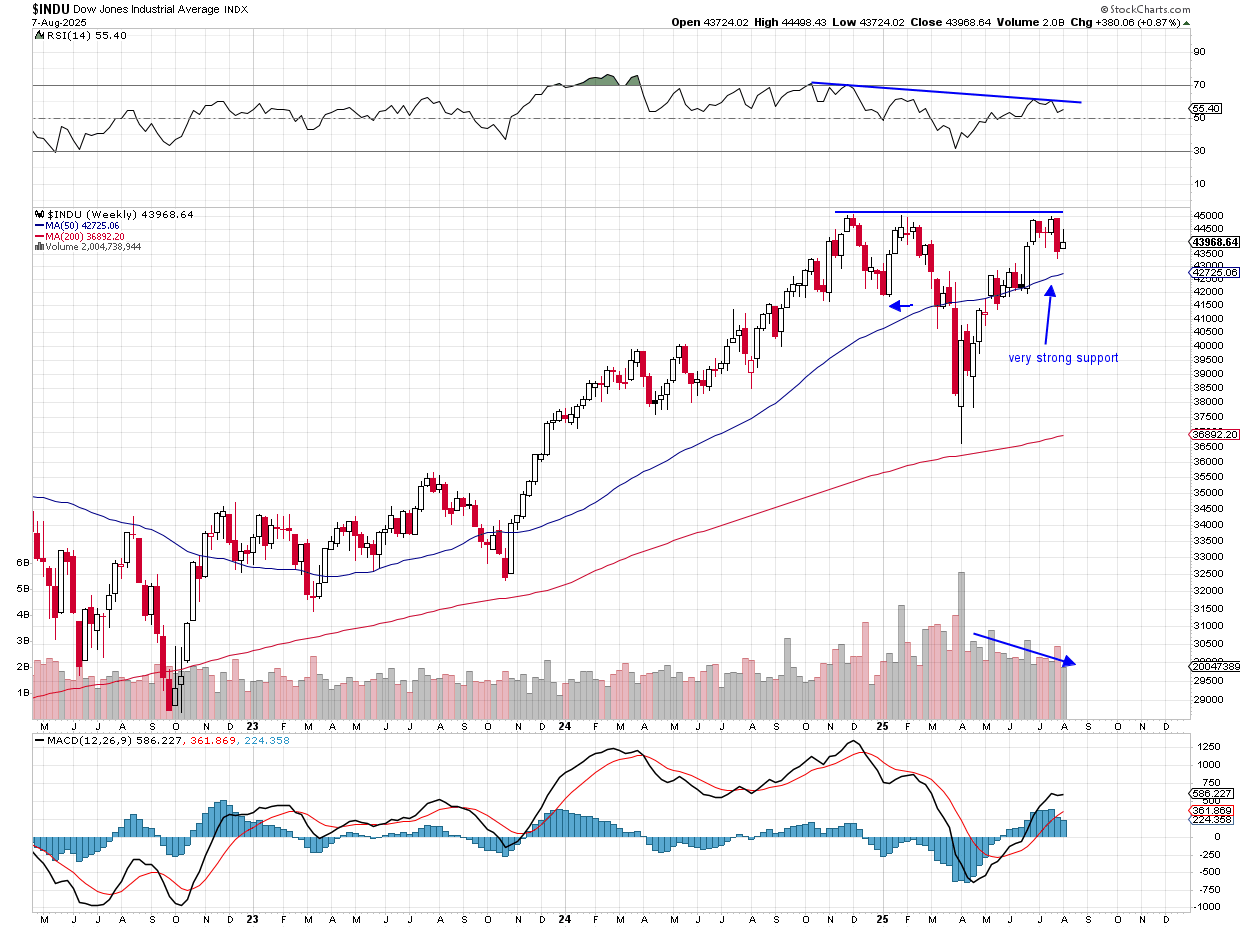
Chart of the Week: The Dow Jones Industrial Average (INDU)
During the trading week, we often focus on the charts of the Nasdaq 100 QQQ or the S&P 500 SPY to guide our journey through the markets. But we should not forget about the venerable Dow Jones Industrial Average (Dow), as this index can have a great influence on how the rest of the market performs and gives us solid information about the economy.
In recent years, the Dow has had a major facelift. You may recall the last entrant into the index was Nvidia NVDA, along with Sherwin-Williams SHW, and before that Amazon AMZN. All three of those moves were made last year, the first two names added when the Dow was right at its all-time highs in November. Since then, the Industrials have tread water.
The weekly chart of the Dow shows a very strong wall of resistance, very clear to see at the 45,000 mark. On three occasions, the Industrials were thrown back down, including this last following the sharp drop on August 1.
Now, I would be mistaken if we were to call this chart bearish; it is not. This weekly chart of the Industrials shows the index remains in an uptrend, even after that sharp move lower in April of this year. The increased volatility just magnifies the large movements of the Dow, but suffice to say, in May, the index got back on track.
But the issue about resistance is troublesome for the bulls. It clearly means buyers are not stepping up to add shares in names that are in the Industrials, even as most stocks are performing quite well in 2025. There are, of course, the slackers like Merck MRK, UnitedHealth UNH and Salesforce CRM. These are the worst-performing names this year. With the Dow up a paltry 3.3% in 2025, it is barely keeping pace with 10-year Treasuries, which yield about 4.2%. At the current rate, the Industrials are on pace for a 5.2% gain in 2025, less than half the result in 2024.
As for the weekly chart, MACD (moving average convergence/divergence) has been on a buy signal crossover since May. Relative strength is mediocre, but the index is still well above the 50-day and 200-day moving averages, and with higher highs, higher lows in place, the Dow remains in an uptrend. If the index corrects, there is very good support at the 50-week moving average at 42,700.
But if it can just clear 45,000 and confirm it, that would be huge for the bulls and pave the way for a move to 50,000 (not likely this year, but in 2026).
Other charts we shared with you this week were:
Monday, August 4: S&P 500 - S&P 500 Stumbles Despite Strong Earnings
Monday, August 4: Palantir (PLTR) - A Close Look at Palantir Ahead of Earnings
Tuesday, August 5: Dutch Bros (BROS) - This Indicator Shows Danger Ahead for Dutch Bros
Wednesday, August 6: Vulcan Materials (VMC) - Vulcan Shows Strong Support
Thursday, August 7: Qualcomm (QCOM) - A Tech Holding Finds Itself in a Tough Spot
The Week Ahead
Following this week’s July ISM Services PMI report, which showed that part of the economy contracted during the month and confirmed inflation pressures rose month over month in the bulk of the economy, the Atlanta Fed’s GDPNow model pegs current quarter GDP at 2.5%. However, as we mentioned last week, that figure and the ones before it are based on less than a handful of data points. In the coming weeks, those figures will become more refined as more data are collected.
Next week will bring some of those data points, and among them will be the next litmus tests for inflation. The headline Consumer Price Index (CPI) figure for July is expected to tick up to 2.8% from June’s 2.7% reading, but the market consensus has the core figure coming in with a 3-handle. If that’s the number we get, it would be the highest reading since February’s 3.1% core print.
Thursday brings the release of the July Produce Price Index (PPI), and expectations are that the headline and core figures will move higher. We could see a downward surprise with headline PPI given lower oil and gas prices in July, but what we see on the core PPI front will be of greater interest.
On Friday, we discussed some company commentaries about the consumer, and next Friday’s July Retail Sales report will bring even more color. As we get ready for that report, let’s remember that July contained Amazon’s 2025 Prime Day and competing events. That means we should see an outsized print for non-store retail sales in July. We’ll also be eyeing sequential comparisons across many other line items to see where consumers were spending. Let’s remember, however, the Retail Sales report only captures a portion of consumer spending. The July Personal Spending data out on August 29 will cover a much wider swatch of consumer spending.
When we review the July Industrial Production data, we’ll make sure to focus on manufacturing activity, knowing full well the high temperatures during the month will no doubt give a lift to utility activity.
Here's a closer look at the economic data coming at us next week:
U.S.
Tuesday, August 12
· NFIB Small Business Optimism Index – July (6:00 AM ET)
· Consumer Price Index – July (8:30 AM ET)
· Treasury Budget – July (2 PM ET)
Wednesday, August 13
· MBA Mortgage Applications Index – Weekly (7:00 AM ET)
· EIA Crude Oil Inventories – Weekly (10:30 AM ET)
Thursday, August 14
· Initial & Continuing Jobless Claims – Weekly (8:30 AM ET)
· Producer Price Index – July (8:30 AM ET)
· EIA Natural Gas Inventories – Weekly (10:30 AM ET)
Friday, August 15
· Retail Sales – July (8:30 AM ET)
· Import/Export Prices – July (8:30 AM ET)
· Industrial Production & Capacity Utilization – July (9:15 AM ET)
· Business Inventories – June (10:00 AM ET)
· University of Michigan Consumer Sentiment Survey (Prelim) – August (10:00 AM ET)
International
Tuesday, August 12
· Eurozone: ZEW Economic Sentiment Index - August
Wednesday, August 13
· Japan: Producer Price Index, Machine Tool Orders – July
Thursday, August 14
· China: Vehicle Sales – July
· UK: GDP, Manufacturing Production, Industrial Production - June
· Eurozone: GDP, Employment Change – Q2 2025
Friday, August 15
· China: Retail Sales, Industrial Production, Fixed Asset Investment – July
· Japan: Industrial Production – June
We will see a noticeable slowdown in the volume of corporate earnings reports next week. We consider it the calm before the final waves of earnings activity during the last two weeks of August. Those two weeks will be heavy on retail earnings, and what those management teams say about tariffs, the consumer, and their margins will be of more than passing interest to us.
While we have no companies reporting until TJX Companies TJX on August 20, we will continue to collect data points, update our thoughts accordingly, and if need be, make any necessary moves with the Portfolio. CoreWeave CRWV, Lumentum LITE, Cisco Systems CSCO, Applied Industrial AIT, and Tapestry TPR are on our must-listen-to list.
Here's a closer look at the earnings reports coming at us next week:
Monday, August 11
· Open: Ceva (CEVA), Owens & Minor (OMI)
· Close: Green Dot (GDOT), Oklo (OKLO),
Tuesday, August 12
· Open: Cardinal Health (CAH), Smithfield Foods (SFD)
· Close: Cava (CAVA), CoreWeave (CRWV), Lumentum (LITE),
Wednesday, August 13
· Open: Brinker (EAT)
· Close: Cisco (CSCO),
Thursday, August 14
· Open: Advance Auto (AAP), Applied Industrial (AIT), Deere (DE), Tapestry (TPR)
· Close: Applied Materials (AMAT),
Friday, August 15
· Open: Flower Foods (FLO).
Portfolio Investor Resource Guide
· Economic Data: Here's a List of Links to the Key Economic Data We Closely Watch
· Investing Terminology: 16 Key Terms Club Members Should Know
· 10-Ks: Want to Know About a Stock? Read the Company's Reports
· 10-Qs: Unlock the Numbers and Key Information Behind Your Stock With the 10-Q
· Income Statement: Our Cheat Sheet to Understanding This Financial Document
· Balance Sheet, Cash Flow Statements, and Dividends: How to Know If a Company Is Off-Kilter? Read Its Balance Sheet
· Valuation Metrics: Everyone Wants a Value. Here's How Investors Can Find
· Thematic Investing 101 Webinar
The Portfolio Ratings System
1 - Buy Now (BN): Stocks that look compelling to buy right now.
2 - Stockpile (SP): Positions we would add to on pullbacks or a successful test of technical support levels.
3 - Holding Pattern (HP): Stocks we are holding as we wait for a fresh catalyst to make our next move.
4 - Sell (S): Positions we intend to exit.
