Weekly Roundup: Here's Our Game Plan as We Focus on Our Updated Shopping List
We’ll be ready when opportunity knocks and the market finds technical support.
You've reached your free article limit
You've read 0 of 1 free Pro articles.
The stock market continued to trade off this week, with the S&P 500 testing its 200-day moving average on Friday, and the Nasdaq Composite crossing below that support level earlier in the week. Growing unease about the vector and velocity of the economy, uncertainty over tariffs, and questions about 2025 EPS prospects and market multiples continued to weigh on the major market indexes. The net effect has the S&P 500, Nasdaq Composite, and the Russell 2000 all down on a year-to-date basis. While relative strength index (RSI) levels for the S&P 500 and Nasdaq Composite are not below 30, other market oscillators point to the market being oversold.
Our plan coming into the week was to let the market absorb the fresh February economic data and what it said about job creation and inflation. While job creation in Friday’s February Employment Report was better than feared following the surge in layoffs found in the February Challenger Job Cuts Report, PMI data from ISM showed inflation marched higher during the month. Our thinking was that combination would lead to some sober talk from Fed Chair Powell on Friday about the market’s expectation for three rate cuts this year, with two of them in the middle of the year.
Instead, Powell’s Friday comments were more velvet-gloved with the Fed Chair saying “If the economy remains strong but inflation does not continue to move sustainably toward 2 percent, we can maintain policy restraint for longer. If the labor market were to weaken unexpectedly or inflation was to fall more quickly than anticipated, we can ease policy accordingly.”
That fits with our expectation Powell would trot out the much-used “data dependent” line when it comes to future monetary policy. We don’t blame him because we could see that layoff surge in Challenger’s Job Cuts Report and news of federal layoffs get captured in the March or April jobs data.
Friday afternoon stocks looked to claw back some of the week’s decline, but given the trifecta of forces that weighed on it this week and the likelihood they will continue, odds are the market will be range bound near-term. For the S&P 500, that means the 100-day moving average near 5955 is now a source of resistance and we could see the 200-day moving average near 18,400 be one for the Nasdaq Composite. Remember resistance doesn’t mean the market can’t move past it, but it does mean we will want to see a successful re-test of that level so it can move higher on a sustained basis.
That’s the market, and while we need to be mindful of its technical setup and investor sentiment, our job is to identify well-positioned companies benefiting from multi-year tailwinds poised to deliver superior EPS growth. The follow-through is scooping up shares in those companies when an opportunity arrives, and we see a favorably skewed risk-to-reward profile.
The market pain between this week and last has dragged down well-positioned companies alongside ones that are seeing weakening fundamentals and other challenges. In many ways, this reminds us of what happened last July and early August. Two differences this time around, though, are the uncertainties emanating from the White House and the speed of the economy per the latest Atlanta Fed GDPNow reading. That will see us focus on names poised to benefit from spending in areas that continue to outpace overall spending levels. We see that in sync with our focus on companies poised to deliver superior EPS growth.
Below we share an updated shopping list for the Portfolio, and based on what we learn over the weekend we may look to slowly wade back into the market. Should that come to pass, we’re likely to favor positions that are oversold. However, similar to our adding Meta META shares last August, we’ll remain flexible and opportunistic as we manage the TheStreet Pro Portfolio not for the short term but for the longer term.
Catching Up on the Portfolio This Week
The Pro Portfolio did not escape the accelerating slide in the market this week, and that led to it losing additional ground compared to the S&P 500. Still, there were notable bright spots across our holdings this week, including Lockheed Martin LMT, Labcorp LH, Alphabet GOOGL, Universal Display OLED, and Qualcomm QCOM. Our inverse ETF positions were also positive contributors this week, just like they were the week before.
During the week we locked in sizable gains in Lockheed Martin and Waste Management WM, redeploying some of that capital when we added to American Express AXP, Axon AXON, Eaton ETN, United Rentals URI, and the VanEck Uranium & Nuclear ETF NLR later in the week. As the market came under further pressure, on Friday, we added Palantir Technologies PLTR to the Portfolio’s Bullpen and removed Advanced Micro Devices AMD and TreeHouse Foods THS.
As the market finds its footing, we’ll look to initiate a position in PLTR. Other portfolio names on our shopping list include ServiceNow NOW, Costco COST, Marvell MRVL, Elastic ESTC, American Express AXP, Vulcan Materials VMC and Dutch Bros BROS. While the portfolio has rather sizable exposure to several holdings, shares of United Rentals URI are attractive.
Now let’s get caught up with what Wall Street had to say this week about the Portfolio’s holdings:
Noted TF International Securities analyst Ming-Chi Kuo shared his view Apple AAPL will start mass producing a book-style foldable iPhone in Q4 2026. We’ve discussed the foldable market on several occasions for smartphones, tablets, and even notebook PCs. We continue to see it as a positive demand driver for Universal Display.
Baird upped Bank of America BAC to Outperform from Neutral and lifted its price target to $50 from $45. Our target on BAC shares remains $53. Baird made its move saying the company has a “great franchise at a reasonable price.” Our thesis on Bank of America and Morgan Stanley MS is tied more to the rebound in investment banking activity that should unfold as President Trump continues to address the regulatory environment. This week, AI hyperscaler CoreWeave filed its IPO documents and reports indicate payments company Klarna could file as soon as next week.
While we maintained our Costco price target following the company’s earnings report this week, Truist lifted its target to $995 from $935 while Loop Capital trimmed its to $1,135 from $1,150.
Truist raised its Elastic price target to $145 from $135. We recently upped our ESTC target to $140 from $130.
Argus boosted its Labcorp target to $290 from $260 given favorable diagnostic volumes and pricing trends. Citi upgraded LH shares to Buy from Neutral this week, slapping a $300 target on them, up from $250.
Wells Fargo lifted its Lockheed Martin price target to $476 from $468 noting international demand for the company’s defense product is starting to “look interesting.”
Following its quarterly earnings report this week, we trimmed back our price target for Marvell to $115 from $130 but upped our rating to One from Two. Needham reduced its price target to $100 from $120 but kept its Buy rating on the shares. Raymond James to $110 from $130 and maintained its Outperform rating. Stifel joined us at $115, while Wells Fargo and BofA both reset their price targets at $120.
Stifel resumed coverage of Vulcan Materials with a Buy rating and a fresh $287 target. The firm likes the long-term construction materials market structure, which it believes supports mid-to high-single-digit annual pricing growth in aggregates and mid-single digits in cement over the cycle.
CIBC lifted its Waste Management target to $247 from $227 but kept a Neutral rating on the shares.
This Week's Portfolio Videos
We cover a lot of ground during the week in our Daily Rundowns. If you happened to miss one or more of them, here are some helpful links:
Monday, March 3: Where to Focus as S&P 500 Faces Key Level
Tuesday, March 4: How to Handle Trump Tariff Anxiety
Wednesday, March 5: Major Revenue Boost Hints at Good Things for These 5 Holdings
Key Global Economic Readings
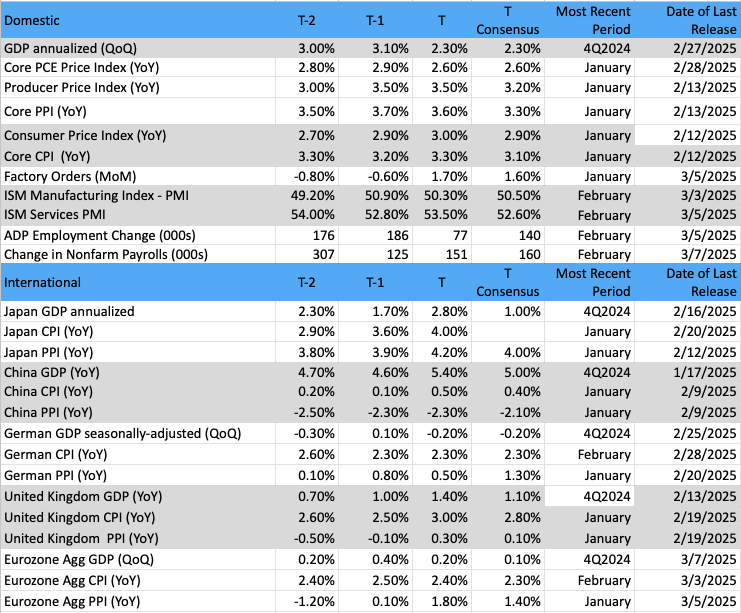
(Note: T is the most recent period, T-1 is the prior period's reading and T-2 is two periods back, the intent being to illustrate any trends)
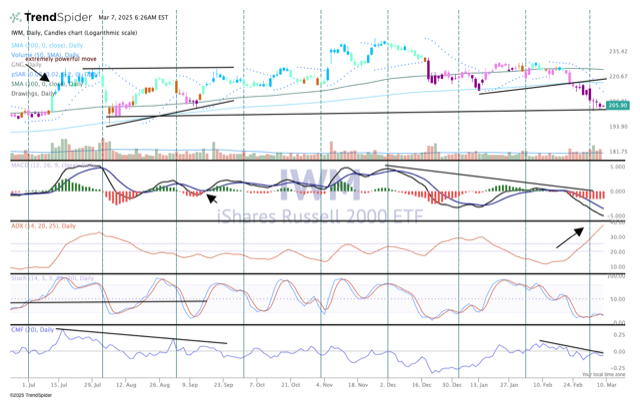
Chart of the Week: iShares Russell 2000 ETF
We have often seen leadership from the small-caps define trends for the stock market. The massive iShares Russell 2000 Index ETF IWM is the one we like to track to find further evidence of support by the bulls or the bears. This index ETF tends to lead on the way up or the way down. Most recently the weakness in the Russell has worked to help push markets lower. Even though the large-cap indexes are not down nearly as much, the IWM has enormous influence.
Believe it or not, the IWM is nearly in bear market territory, about 17% off the recent highs in late 2024.
Every week on Mondays we call your attention the weekly chart of the S&P 500. This is a very important chart that tells us a great deal of information on how the market is trending, where the momentum is located, and how price is responding. In addition, we look at breadth figures to help us determine if the market is in a modest move up/down or something more serious in length.
The IWM, having 2,000 issues, tends to dominate the breadth, and when it is bad the IWM is often the culprit. Since hitting new highs in January, the cumulative volume breadth indicator (CVB, not shown) has steadily declined, and of course, the IWM is to blame. When does it all end? We need to watch one area of support on the IWM carefully. The $205 area is important to hold, or else we are likely to see levels below $200 tested in short order.
The indicators are flat or bearish on the IWM. Notice the ADX has soared. This tells us the strength of the trend but not the direction. Since we know it is down and the ADX is at 40 then we can assume this downtrend strength is powerful. Money is steadily declining; the candles are purple, which tells us fully bearish on the GoNoGo composite of indicators.
Even if the IWM rallies to say $220 there is more heavy resistance, and if it should turn lower than a lower high in place, we are likely to see a continuation of the bear market condition.
Other charts we shared with you this week were:
Monday, March 3: S&P 500 - Disturbing Trend Hints at Lower Lows Ahead
Monday, March 3: Elastic NV (ESTC) - Elastic Expands as Money Flows In
Tuesday, March 4: Lockheed Martin (LMT) - A Holding Rallies Back, But Remains Bearish
Wednesday, March 5: Marvell (MRVL) - How Marvell Looks Heading Into Earnings
Thursday, March 6: Costco (COST) - Investors Brace for Earnings from Costco
The Week Ahead
During the weekend, we will continue to monitor policy and tariff news in Washington and what that could mean for uncertainty in the market. One item we are expecting to hear about over the weekend is Mexico’s response to recent Trump tariffs. Our concern is a comment from President Trump on Friday that tariffs could go up as time goes on. How much of that is posturing as Trump looks to strike deals remains to be seen ahead of other tariffs pending on copper and aluminum, and the expected April 2 implementation of reciprocal tariffs.
Given concerns over the speed of the economy following recent updates to the Atlanta Fed GDPNow, we will continue to parse the oncoming economic data closely. There are four indicators we will be focusing on more next week, including the latest NFIB Small Business Survey, February CPI and PPI, and the preliminary March reading for the University of Michigan Consumer Sentiment Index.
With the NFIB Small Business Optimism Index, we’ll be interested in the headline figure but more so in the collected comments about new order activity, hiring activity, and inflation pressures. What is said about tariffs and how survey respondents are handling them will also be key items of interest.
Based on the jump-up in February PMI price data from ISM compared to January, we are not expecting to see any meaningful progress on inflation in the CPI and PPI reports out next week. We also saw average gas prices creep higher compared to January and similar movement in the FAO Food Price Index for February compared to the first month of 2025. The Cleveland Fed’s Inflation Nowcast sees core CPI rising a tad softer in February at 3.16% year over year compared to the market forecast of 3.2% versus January’s figure of 3.3%.
Turning to the University of Michigan Consumer Sentiment Index, remember it was the February findings that showed consumer inflation expectations rising to an over-one-year high of 4.3%, up sharply compared to January’s 3.3% and the 2.8% figure for December. With all of the tariff talk in recent weeks, we would not be surprised to see the preliminary March reading for that line item remain at lofty levels. Another sharp move higher, however, would be unsettling for the market and likely bring others around to questioning market expectations for three rate cuts this year.
One item we will not get next week is an update for the Atlanta Fed’s GDPNow Model. It was last updated on March 6 to -2.4%, and the next update is scheduled for Monday, March 17. That will include not only all of next week’s data but also the February Employment Report. What’s notable about that timing is it comes just days before the Fed’s March policy meeting that concludes on March 19. The timing of that meeting also means we are entering the Fed’s blackout period, so other than Fed Chair Powell’s post-policy meeting comments, we have no Fed speakers until March 20 at the soonest.
Here's a closer look at the economic data coming at us next week:
U.S.
Tuesday, March 11
· NFIB Small Business Optimism Index – February (5 AM ET)
· JOLTS Job Openings & Job Quits – January (9 AM ET)
Wednesday, March 12
· MBA Mortgage Applications Index – Weekly (7:00 AM ET)
· Consumer Price Index – February (8:30 AM ET)
· EIA Crude Oil Inventories – Weekly (10:30 AM ET)
· Treasury Budget – February (2 PM ET)
Thursday, March 13
· Initial & Continuing Jobless Claims – Weekly (8:30 AM ET)
· Producer Price Index – February (8:30 AM ET)
· EIA Natural Gas Inventories – Weekly (10:30 AM ET)
Friday, March 14
· University of Michigan Consumer Sentiment Index (Prelim) – March (10:00 AM ET)
International
Monday, March 10
· Japan: Eco Watchers Survey – February
· Germany: Imports/Exports - January
Wednesday, March 12
· Japan: Producer Price Index – February
· Canada: Bank of Canada Interest Rate Decision
Thursday, March 13
· Eurozone: Industrial Production - January
Friday, March 14
· Germany: Inflation Rate (Final) – February
· UK: GDP, Industrial Production - January
We have an earnings reprieve of sorts next week as no portfolio companies are reporting. However, we will still dig into multiple earnings reports coming at us, especially ones from Ciena (CIEN) and Adobe (ADBE). We’ll also be collecting comments from retailers relating to the consumer but also tariffs and the potential impact on margins.
We do have portfolio names Applied Materials AMAT and Lockheed Martin LMT appearing at the Cantor Fitzgerald Global Technology Conference and JPMorgan’s Industrial Conference on March 12 and 13. Other companies will be presenting at those two conferences as well as other ones sponsored by Roth Capital. Here too, we will be collecting comments about what companies are seeing in their sectors but also the overall economy and how they are modeling potential tariff impacts. The big thing we will be listening for is EPS expectations for the coming quarters.
Here's a closer look at the earnings reports coming at us next week:
Monday, March 10
· Close: Mission Produce (AVO)
Tuesday, March 11
· Open: Ciena (CIEN), Dick’s Sporting Goods (DKS), Kohl’s (KSS), United Natural Foods (UNFI)
· Close: Stitch Fix (SFIX)
Wednesday, March 12
· Close: Adobe (ADBE), American Eagle (AEO), Calavo Growers (CWGW), SentinelOne (S)
Thursday, March 13
· Open: Dollar General (DG)
· Close: Ulta Beauty (ULTA)
Portfolio Investor Resource Guide
· Economic Data: Here's a List of Links to the Key Economic Data We Closely Watch
· Investing Terminology: 16 Key Terms Club Members Should Know
· 10-Ks: Want to Know About a Stock? Read the Company's Reports
· 10-Qs: Unlock the Numbers and Key Information Behind Your Stock With the 10-Q
· Income Statement: Our Cheat Sheet to Understanding This Financial Document
· Balance Sheet, Cash Flow Statements, and Dividends: How to Know If a Company Is Off-Kilter? Read Its Balance Sheet
· Valuation Metrics: Everyone Wants a Value. Here's How Investors Can Find
· Thematic Investing 101 Webinar
The Portfolio Ratings System
1 - Buy Now (BN): Stocks that look compelling to buy right now.
2 - Stockpile (SP): Positions we would add to on pullbacks or a successful test of technical support levels.
3 - Holding Pattern (HP): Stocks we are holding as we wait for a fresh catalyst to make our next move.
4 - Sell (S): Positions we intend to exit.
