Weekly Roundup: February Data Renew Concerns for the Economy and Earnings
Our cash and inverse ETF holdings help insulate us as we prepare for our next moves.
You've reached your free article limit
You've read 0 of 1 free Pro articles.
Coming into February, the market was concerned about the potential impact on the economy of President Trump's tariffs, earnings expectations, and the risk of uncertainty being injected into the market. A potential recipe for volatile market action following the strong January climb. While the market shrugged off the hotter-than-expected January CPI report and comments from Fed Chair Powell that the central bank would need to do more to get inflation under control, the start of February data and what it revealed about the economy, inflation, and tariff concerns weighed on stocks.
In last Friday’s Weekly Roundup, we shared our growing concerns about the market's multiple and slowing 2025 EPS growth prospects for the S&P 500. On Thursday of this week, several more factors added to those concerns after the S&P 500 finished Wednesday at a new record high. These included extremely low trading volume, excessive euphoria in the market, record-level individual investor sentiment, and an incrementally stretched market multiple. While the S&P 500 was not classically oversold given its relative strength index level, it was looking frothy and arguably priced to perfection.
At times like that, it doesn’t take much to disrupt the market, and that’s what unfolded during the balance of this abbreviated trading week.
One of the risks we shared with you earlier this week was the potential for companies, especially retailers and retail-facing ones, to issue below-consensus guidance as they factored potential tariffs into their outlook. While Walmart WMT didn’t bake that into its outlook, it did deliver softer-than-expected guidance for the coming year.
Friday brought the February Flash PMI report from S&P Global, and it painted a more revealing picture about how the overall economy performed as Trump stepped up his tariff comments. In our Alert discussing the report we ran through the puts and takes between findings for the Manufacturing and Service sectors, but the key takeaway was the economy neared stall speed in February due to uncertainty over tariffs as well as federal government policies. The same report confirmed rising input cost inflation pressures.
Building on those Friday findings, we learned the University of Michigan consumer sentiment index fell to 64.7 in February, a decline of 10% compared to January’s 71.1 figure. The same report crystalized the renewed pains of inflation and concerns over that picking up further in the coming months as the February Inflations Expectations figure jumped to 4.3% from 3.3% in January. The five-year inflation outlook in the survey was 3.5%, the highest since 1995.
The net effect led to the market’s retreat, which began on Thursday and accelerated on Friday, more than wiping out February gains for the S&P 500 and the S&P 500. Key support levels we are watching are the S&P 500’s 50-day moving average near 6010 and the 100-day MA near 5942. We’ll have a more detailed look at the technical setup for the S&P 500 early on Monday, February 24.
Multiple times over the last six months we’ve used extreme market volatility to enhance the The Street Pro Portfolio’s positioning for the medium to longer term. While we’ve had a setback with the portfolio’s performance, we are still positive on a year-to-date basis. More importantly, between our cash position and our two inverse ETF holdings we have roughly 11.5% of the portfolio’s assets in capital we can use to once again make some opportunistic moves.
Based on what we saw in S&P’s February Flash report, we recognize the market may get another batch of sobering data during the first week of March. That could bring about renewed concern about the speed of the economy and, in turn, earnings expectations. For that reason, we will continue to tread carefully, opting not to react to a nervous market but rather to compelling stock prices or when the uncertainty lifts. Given what we’re seeing emanating from Washington, we doubt the latter will happen in the next few days and that means we will continue to pick our spots carefully.
We will continue to focus on companies benefiting from multi-year tailwinds in their businesses driven by structural changes and those that have prospects to deliver superior EPS growth in the coming quarters. That includes leaning into the signals that we share with you each Saturday, and yes, we will have a fresh batch for you to peruse on February 22.
Catching Up on the Portfolio This Week
During the abbreviated market week, we made no trades in the portfolio, preferring instead to first digest Friday’s Flash February PMI report. As we discussed in our Alert, the findings of that report renewed market uncertainty, leading the market and the portfolio to lose ground week over week.
In that Alert, we noted and reiterated that we will be watching to see if key support levels for the S&P 500 hold as we refresh our shopping list of stocks following this week’s market action. We will be sharing that updated list and refreshed pick-up points with you very early next week. We will also continue to examine unwinding the portfolio’s position in Four-rated Trade Desk TTD. Should we see one of our shopping-list stocks offering better growth prospects and more compelling risk-to-reward opportunities, we may not wait for a rebound in deeply oversold TTD shares to emerge.
Now let’s review what Wall Street had to say about the portfolio’s holdings over the last few days.
Citi boosted its price target for Applied Materials AMAT to $202 from $194 and kept its Buy rating.
Keefe Bruyette pointed out Berkshire's BRK.A, BRK.B sales of Bank of America BAC shares are decelerating, with Warren Buffett’s entity still owning around 8.9% of outstanding BAC shares. Keefe Bruyette also reiterated its $59 price target for BAC shares.
Guggenheim boosted its Elastic ESTC price target to $130 from $120 as it expects GenAI use cases to drive continued acceleration in the company’s search business.
BofA upped its Morgan Stanley MS target to $160 from $153 as it continues to see a rebound in deal-making activity.
Ahead of next week’s earnings report, KeyBank upped its Nvidia NVDA target to $190 from $180. UBS reiterated its $185 target this week, sharing its view Nvidia should deliver solid results and guidance at or ahead of expectations.
ServiceNow NOW shares received a new Buy rating from Redburn Atlantic with a $1,140 target.
As we revised our price target for Universal Display OLED, so too did others across Wall Street. TD Cowen reduced its to $200 from $225, while Roth MKM boosted its to $213 from $207.
Jefferies raised its price target for Vulcan Materials VMC to $335 from $325.
This Week's Portfolio Videos
This week, with Chris Versace contending with Covid we did not have any Daily Rundowns. However, with Chris now on the mend, we expect the Daily Rundown to return on Monday.
Key Global Economic Readings
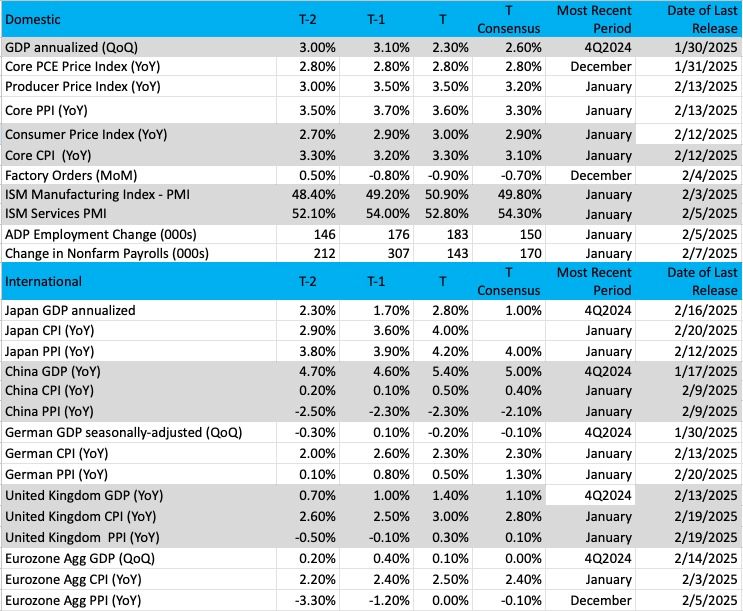
(Note: T is the most recent period, T-1 is the prior period's reading and T-2 is two periods back, the intent being to illustrate any trends)
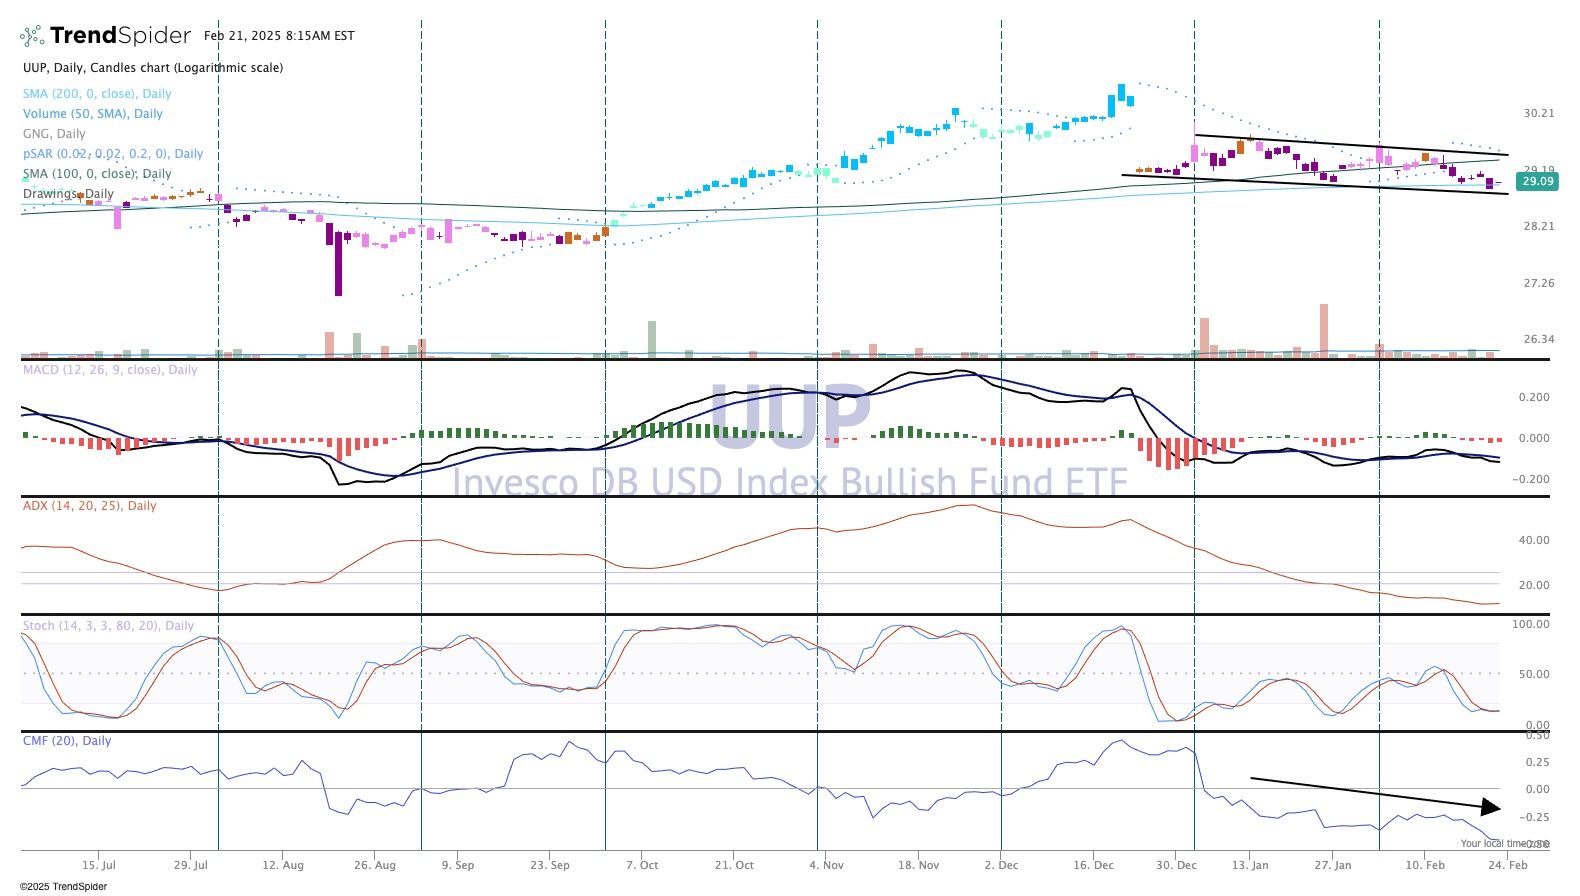
Chart of the Week: Invesco DB US Dollar Index Bullish Fund (UUP)
We have seen some weakness in the greenback lately, so what does it mean for the economy and inflation? The Invesco DB USD Index Bullish Fund UUP tracks the U.S. dollar relative to a basket of the six major world currencies (euro, yen, British pound, Canadian dollar, Swedish krona, and Swiss franc). The weights of the U.S. dollar currency have been fixed since 1973 but have heavy exposure to the euro, hence any positive moves in that currency reflect downside in the U.S. dollar. Investors choose the UUP looking for exposure to the dollar against this broad range of developed currencies.
The U.S. dollar, however, has implications for trade within our economy and can influence inflationary conditions (good or bad). A weak dollar means goods produced in the U.S. (and non-U.S. goods) become more expensive to U.S. consumers. This can push up prices substantially and create an inflation vacuum that is difficult to control. On the flip side, exporters of goods can sell their products at a discount to their competitors, as goods/services sent overseas are cheaper and priced more attractively. When the economy is struggling the Federal Reserve often weakens the dollar with dovish monetary policy to help stimulate business (at least temporarily).
What this all leads to is tracking the long-term performance of the dollar and how the currency stands to improve or hurt the U.S. economy. It is a double-edged sword with a strong dollar making it difficult to ship/sell goods overseas while a weak dollar can bring in swaths of inflation. It’s a balancing act.
The chart of the UUP shows the dollar is in a steady downtrend, which has been in place since mid-December. The greenback seems to understand the shift in Fed monetary policy from dovish to neutral and reflects the current state. A strong dollar with easing policy within a strong economy is bullish for the stock market until the inflationary winds start to blow. Momentum has been drained out of the greenback for now; notice the weakness in the bottom chart of money flow, and stochastics (momentum) is flat on its back.
While the UUP enjoyed a strong year in 2024 (up better than 15%) it is going to be a difficult road for the U.S. dollar if the economy slows down (starting to see that now), inflation rises (it is not coming down) and the Fed remains at current monetary policy levels.
Other charts we shared with you this week were:
Monday, February 17: S&P 500 – Dow Jones Industrial Average (DIA) - The Dow Offers Another Bullish Perspective
Tuesday, February 18: Apple (AAPL) - Apple Tries to Make a Stand
Wednesday, February 19: Universal Display (OLED) - This Frustrating Holding Is Still Trying to Find a Bottom
Thursday, February 20: ServiceNow (NOW) - Is Now the Time for This Portfolio Name?
The Week Ahead
We are back to a full week of trading as we close out February, but before we get there, we will be interested in Warren Buffett’s annual shareholder letter which will be published over the weekend. We’ll share our key takeaways with you as we kick off next week.
The last five trading days of the month will include the February print for Consumer Confidence, the January Personal Income & Spending figures as well as the Personal Consumption Expenditure (PCE) Price Index. With recent headlines on egg, beef and other rising prices, mixed with tariff tensions, we’ll be gauging how they impact the consumers’ outlook. Given the disappointing January report for Retail Sales and the $93 billion increase in total household debt to $18.04 trillion exiting 2024, we are not expecting January Personal Spending to knock anyone’s socks off.
As we know that is the Fed’s preferred inflation metric but as we’ve seen over the last seven trading days, even the Fed acknowledges inflation remains elevated and it has its work cut out. Here’s the thing, the Cleveland Fed’s Inflation Nowcast model sees the January core PCE price index rising to 2.66% year over year, down from December’s 2.8% print. If that’s the published figure, it would be the lowest one in the last seven months. Call us critical of the Cleveland Fed, but based on all the January inflation figures and other data, we’d be surprised if we see a drop of that magnitude.
Here's a closer look at the economic data coming at us next week:
U.S.
Tuesday, February 25
· FHFA Housing Price Index – December (9:00 AM ET)
· S&P Case Shiller Home Price Index – December (9:00 AM ET)
· Consumer Confidence – February (10:00 AM ET)
Wednesday, February 26
· MBA Mortgage Applications Index – Weekly (7:00 AM ET)
· New Home Sales – January (10:00 AM ET)
· EIA Crude Oil Inventories – Weekly (10:30 AM ET)
Thursday, February 27
· GDP (2nd Estimate) – Q4 2024 (8:30 AM ET)
· Initial & Continuing Jobless Claims – Weekly (8:30 AM ET)
· Durable Orders – January (8:30 AM ET)
· Pending Home Sales – January (10:00 AM ET)
· EIA Natural Gas Inventories – Weekly (10:30 AM ET)
Friday, February 28
· Personal Income & Spending, PCE Price Index – January (8:30 AM ET)
International
Monday, February 24
· China: Foreign Direct Investment – January
· Germany: Ifo Business Climate and Conditions – February
· Eurozone: Inflation Rate (Final) - January
Tuesday, February 25
· Germany: GDP (Final) – 4Q 2024
Wednesday, February 26
· Germany: GfK Consumer Confidence - March
Thursday, February 27
· Eurozone: Loans to Companies, Households – January
· Eurozone: Economic Sentiment, Consumer Confidence - February
Friday, February 28
· Germany: Retail Sales – January
· Germany: Inflation Rate (Prelim) – February
· Eurozone: ECB Consumer Inflation Expectations - January
TheStreet Pro Portfolio (and the rest of the market) have a rather important earnings report next week. Yes, we are talking about Nvidia NVDA, which is the second largest component in the S&P 500 at 6.55% of that basket, and the second largest for the Nasdaq 100 (NDX) at 8.36%. This means Nvidia’s results on Wednesday night are likely to influence how both market indexes close out the month. Given the recent rebound in NVDA shares, it’s fair to say expectations are running high, and CEO Jensen Huang will need to deliver a beat-and-raise quarter. The 2025 ramp in Big Tech capital spending as well as the expected revenue ramp at Super Micro Computer SMCI in the coming quarters suggest he is likely to deliver.
We also have Elastic NV ESTC reporting next Thursday, and we’ll be closely tracking its growth in subscription revenue, customer wins, and deferred revenue. We’ll also parse the reported figures to determine the company’s subscription revenue per customer, a figure that has been steadily growing over the last two years.
Outside of those two reports, we’ll continue to mine others coming at us next week for useful insights as it relates to our existing holdings and ones on our radar screen. Some of the ones we’ll be eyeing next week are Trex (TREX), Elanco Animal Health (ELAN), Home Depot (HD), Axon Enterprise (AXON), Salesforce (CRM), Dell (DEL) and HP (HPQ). With those last two, comments on the AI PC market will be top-of-mind topics for us given the portfolio’s position in Qualcomm QCOM.
Here's a closer look at the earnings reports coming at us next week:
Monday, February 24
· Open: Domino’s Pizza (DPZ), Owens Corning (OC)
· Close: Addus HomeCare (ADUS), Hims & Hers Health (HIMS), Navitas Semiconductor (MNTS), Realty Income (O), Trex (TREX)
Tuesday, February 25
· Open: American Tower (AMT), Elanco Animal Health (ELAN), Home Depot (HD), LGI Homes (LGIH), Sealed Air (SEE)
· Close: Axon (AXON), Boston Beer (SAM), Cava (CAVA), First Solar (FSLR), Instacart (CART), Workday (WDAY), Zip Recruiter (ZIP)
Wednesday, February 26
· Open: Anheuser-Busch InBev (BUD), Lowe’s (LOW), TJX Companies (TJX)
· Close: Agilent (A), eBay (EBAY), First Energy (FE), Heico (HEI), Nvidia (NVDA), Paramount Global (PARA), Salesforce (CRM), Snowflake (SNOW), Teladoc (TDOC), Universal Health (UHS)
Thursday, February 27
· Open: ADT (ADT), Cars.com (CARS), Norwegian Cruise Line (NCLH), Papa John’s (PZZA), Warner Bros. Discovery (WBD)
· Close: Dell (DELL), Elastic (ESTC), HP (HPQ), NetApp (NTAP), Redfin (REFN), Rocket Companies (RKT)
Friday, February 28
· Open: FuboTV (FUBO), Owens & Minor (OMI).
Portfolio Investor Resource Guide
· Economic Data: Here's a List of Links to the Key Economic Data We Closely Watch
· Investing Terminology: 16 Key Terms Club Members Should Know
· 10-Ks: Want to Know About a Stock? Read the Company's Reports
· 10-Qs: Unlock the Numbers and Key Information Behind Your Stock With the 10-Q
· Income Statement: Our Cheat Sheet to Understanding This Financial Document
· Balance sheet, Cash Flow Statements, and Dividends: How to Know If a Company Is Off-Kilter? Read Its Balance Sheet
· Valuation Metrics: Everyone Wants a Value. Here's How Investors Can Find
· Thematic Investing 101 Webinar
The Portfolio Ratings System
1 - Buy Now (BN): Stocks that look compelling to buy right now.
2 - Stockpile (SP): Positions we would add to on pullbacks or a successful test of technical support levels.
3 - Holding Pattern (HP): Stocks we are holding as we wait for a fresh catalyst to make our next move.
4 - Sell (S): Positions we intend to exit.
