Weekly Roundup: Enjoy the Rebound But Recognize Challenges Remain
Tea leaves indicate March-quarter earnings season could bring underwhelming guidance.
You've reached your free article limit
You've read 0 of 1 free Pro articles.
While stocks rallied nicely on Friday after hitting a cumulative 10% correction on Thursday, all the major market averages still finished lower for the week. The rebound from oversold levels mixed with our recent string of additions led TheStreet Pro Portfolio to close the year-to-date gap relative to the S&P 500.
Fueling this latest attempt is word the Republican funding bill to avert a government shutdown Froiday night is poised to pass, removing at least one concern on Wall Street’s list. Let’s remember, though, that while a market rebound is welcomed, other issues, including upcoming tariffs, next week’s Fed policy comments, and questions over June-quarter guidance could limit the market’s near-term gains.
Clearly seen in the chart below, the S&P 500 will face some initial resistance at the 200-day moving average and again at the almost intersecting 50-day and 100-day moving averages.
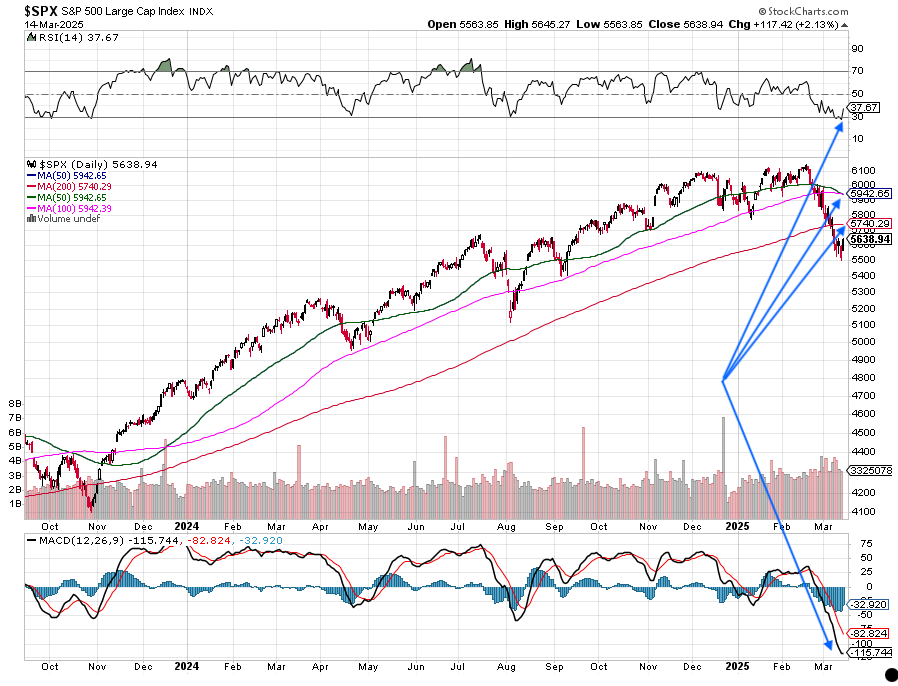
So, while the market had been overdue for a bounce and the one we saw on Friday could continue early next week, we continue to think it’s going to take more than a few positive data points to propel stocks dramatically higher on a sustained basis near term. A likely scenario is that even though the market has rallied out from being deeply oversold, it will likely remain volatile or choppy potentially through the first half of the March-quarter earnings season. Our thinking on this stems from what lies ahead over the next 4-5 weeks:
- The Flash and then the Final March PMI data
- Initial European Union tariffs that will escalate mid-month
- Trump reciprocal tariffs
- ADP’s March Employment Change Report
- The March Employment Report
- March CPI and PPI
- March-quarter earnings and June quarter guidance
That upcoming gauntlet will reflect the effects of the initial Trump tariffs and ensuing countermeasures as well as the next round of them. Given the timing, it means companies will have a better, but not complete picture of tariffs when March-quarter earnings season kicks off on April 11 beginning with big bank earnings, including those from JPMorgan Chase JPM. The pace of earnings reports will then accelerate over the following weeks with companies updating their forward guidance.
We’ve seen weaker-than-expected guidance from retailers and other companies over the last few weeks. Recent data have shown rising inflation expectations among consumers, which raises renewed questions about spending power. Pairing that with record consumer debt levels, the explosion in February layoffs captured in the latest data in the Challenger Job Cuts report, and overall uncertainty emanating from Washington, the likelihood is consumers are cutting back their spending. We discussed that in-depth on Thursday when we shared our updated plan for Three-rated Mastercard MA.
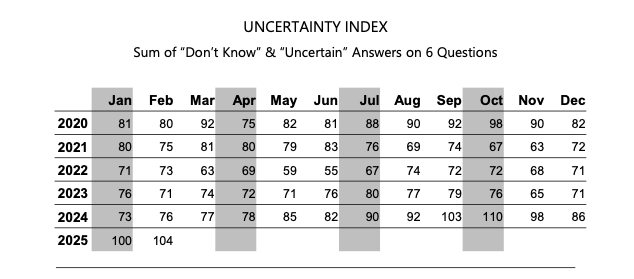
There are also reasons to question near-term business investment prospects. Tariff uncertainty for one, and the Atlanta Fed’s GDPNow model for the current quarter slipping into negative territory, for another. That helps explain why the Uncertainty Index found in the NFIB’s latest Small Business Optimism Index rose to its second-highest recorded level. As we’ve seen before, during periods of high uncertainty businesses, generally speaking, tend to pull back on hiring, spending, and investments. That’s another likely near-term headwind for the economy.
As we look ahead, expected Trump reciprocal tariffs targeted for April 2 as well as tariff countermeasures from China, Canada and now the European Union, in addition to those items laid out above, are leading us to question S&P 500 consensus EPS growth expectations for Q2 2025. The current consensus tallied by FactSet calls for those earnings to grow 9.2% compared to those for the Q1 2025 quarter. That’s a quicker pace than the 7.2% gain posted in the Q2 2024 quarter compared to Q1 2024 when the economy faced far fewer headwinds and uncertainties.
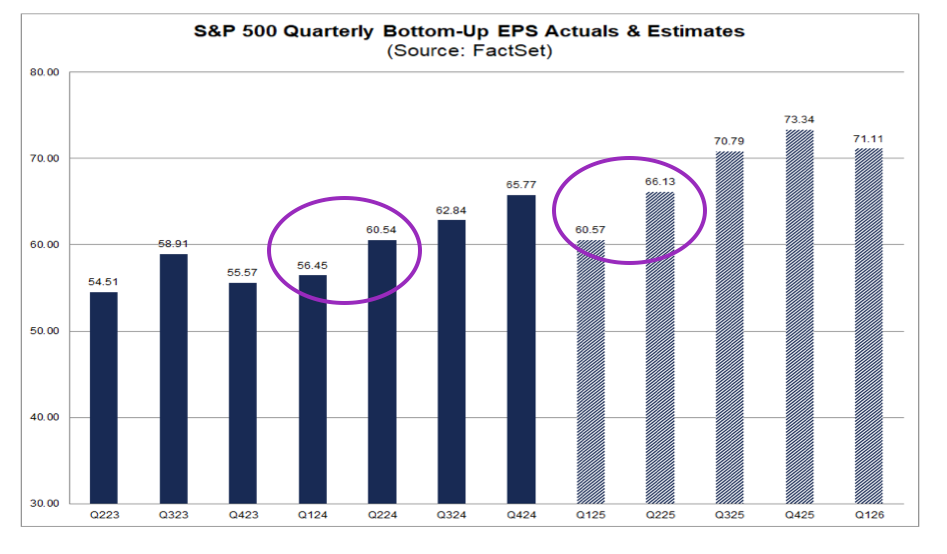
The likely scenario as it stands today is companies will issue more conservative guidance for Q2 2025 than the market expects. Should that play out, it would likely raise questions for the arguably even more aggressive ramp in EPS growth projected for H2 2025 (+13.8% compared to H1 2025 vs. the 9.9% achieved in H2 2024 compared to 1H 2024). Granted, some of that forecasted H2 2025 EPS acceleration may be tied to Trump tax cut hopium, but reality is pointing to progress on that front being a late Q2 2025 event. Given the potential timing, it doesn’t seem like many companies will be able to bake that expectation into their June-quarter guidance.
If the scenario laid out above unfolds and we see 2025 S&P 500 EPS deteriorate, odds are high it will reignite questions about the market multiple. Those 2025 EPS growth expectations have already shrunk to 11.6%, year over year, compared to forecasts of +14.4% in late January. As of Friday’s market close, the S&P 500 P/E multiple on current 2025 EPS expectations stood near 20.8x, down from its recent high of 22.7x on February 19.
Gaming it out, if we see 2025 S&P 500 EPS expectations shape up for something more like $265 than the current $271.20, still up some 9% compared to 2024, and if the market stands still, the S&P 500’s P/E multiple will expand. If we see the market rebound with the S&P 500 moving toward its resistance levels, it will expand even further. At the intersection of the 50-day and 200-day moving average, a $265 S&P 500 EPS figure for this year puts the P/E back near 22.4x. Not too far off from where it was when the S&P 500 peaked back on February 19 with a 35% chop to EPS growth expectations.
To be fair, a move back to that technical intersection for the S&P 500 equates to an 8% move higher from oversold levels that would push the market back into positive territory and likely drag the portfolio with it. The question we are pondering is this: Absent Trump delivering tax cuts or successful tariff negotiations, what’s the catalyst to fuel such a sustained move over the next several weeks?
That brings us back to potential Trump tax cuts or successful tariff negotiations. If we do get them, their size and timing will influence how Wall Street re-models corporate earnings in H2 2025 and 2026. But again, as of now, such developments are not likely until late Q2 2025. That suggests the start of the March-quarter earnings season could be a challenging time for the market.
What this means for us is we will continue to focus on companies benefiting from multiyear structural changes and spending that is happening, and are poised to deliver superior earnings growth, picking our spots as we do so. We will continue to listen to the data and be mindful of the market’s valuation and technical setup and should the situation arise, we will prudently harvest gains and raise cash when warranted. It also means that for now, we are inclined to keep the portfolio’s inverse ETF positions in play.
Catching Up on the Portfolio This Week
Following our moves from last week, which included picking up shares of American Express AXP, Axon Enterprise AXON, Eaton ETN, United Rentals URI, and the VanEck Uranium Nuclear Energy ETF NLR, we made some additional ones this week. On Tuesday we called up shares of Palantir PLTR from the Bullpen, starting that new position off just over $79. The following day we scooped up more shares of Palantir but also additional American Express, Axon, Dutch Bros BROS, Marvell MRVL, and ServiceNow NOW. On Friday, coming off Palantir’s AIPCon 6 event we upped our price target for the shares to $95 from $87 and explained why the event and related data points were supportive of our holdings in Elastic ESTC, ServiceNow, Nvidia NVDA, Marvell, and Eaton.
During the week, we also downgraded shares of Mastercard MA to a Three rating, sharing why expanding concerns about the consumer may lead us to use a rebound in the shares to dial back our exposure. In Friday’s video, we explained why the data found in the March preliminary reading of the Michigan Consumer Sentiment Index brought more support for that line of reasoning.
Applied Materials AMAT announced a new $10 billion share repurchase authorization, which adds to the $7.6 billion remaining at the close of its latest quarter. The semi-cap equipment maker also increased its quarterly dividend by 15% to $0.46 per share, and the first of that higher dividend will be paid on June 12 to shareholders of record on May 22.
The net result of our moves leaves the portfolio’s cash position near 6.6% of its assets with the balance spread across 30 positions, including our two inverse ETFs. Given our thoughts about the market’s likely prospects over the coming weeks, we will be paying close attention to its technical setup and the same is true for the portfolio’s holdings. While we could see the market rebound further, we may opt to boost our cash levels as we approach March-quarter earnings season given the potential for June-quarter guidance to underwhelm the market.
Now let’s turn to what Wall Street had to say about the portfolio’s holdings this week:
Morgan Stanley trimmed its Bank of America BAC price target by $1 to $56 and noted large-cap banks were oversold. Morgan also lowered its Apple AAPL price target to $252 from $275 chalking that move up to the delayed rollout of more advanced Siri features. The firm’s rationale is that could result in a slower than previously expected upgrade cycle.
KeyBanc upgraded Eaton shares to Overweight from Sector Weight following the company’s Investor Day this week. We shared our comments with members, which included reiterating our One rating and long-term $400 price target.
DA Davidson stepped up to the plate for Microsoft MSFT shares, upgrading them to a Buy rating with a $450 price target.
Mizuho trimmed its Nvidia NVDA price target to $168 from $175 but reiterated its Outperform rating on the shares. Meanwhile, BofA reiterated its Buy rating on NVDA and did the same for its $200 price target.
This Week's Portfolio Videos
We cover a lot of ground during the week in our Daily Rundowns. If you happened to miss one or more of them, here are some helpful links:
Monday, March 10: Trump’s 'Period of Transition' Ups Market Anxiety
Wednesday, March 12: 3 Holdings Offering Attractive Pick-Up Points
Thursday, March 13: What to Expect at Palantir’s AIPCon Event
Friday, March 14: How This Holding's Event Is Helping Drive a Market Rebound
Key Global Economic Readings
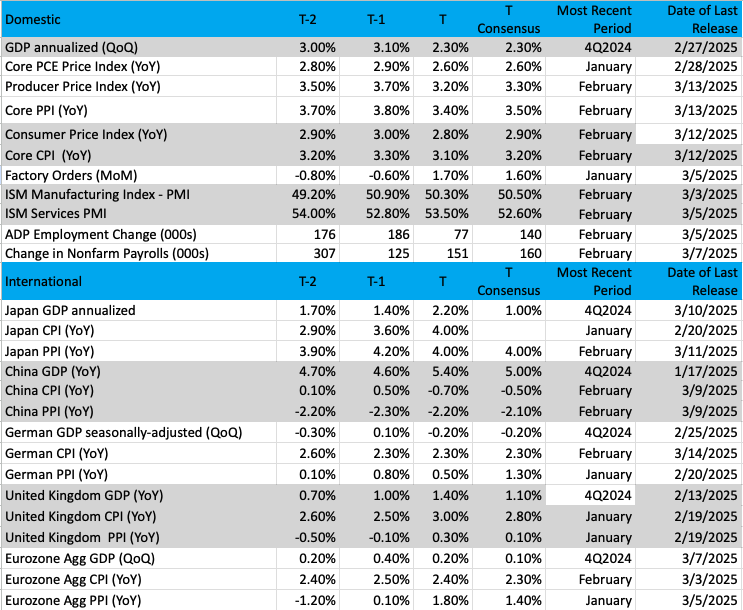
(Note: T is the most recent period, T-1 is the prior period's reading and T-2 is two periods back, the intent being to illustrate any trends)
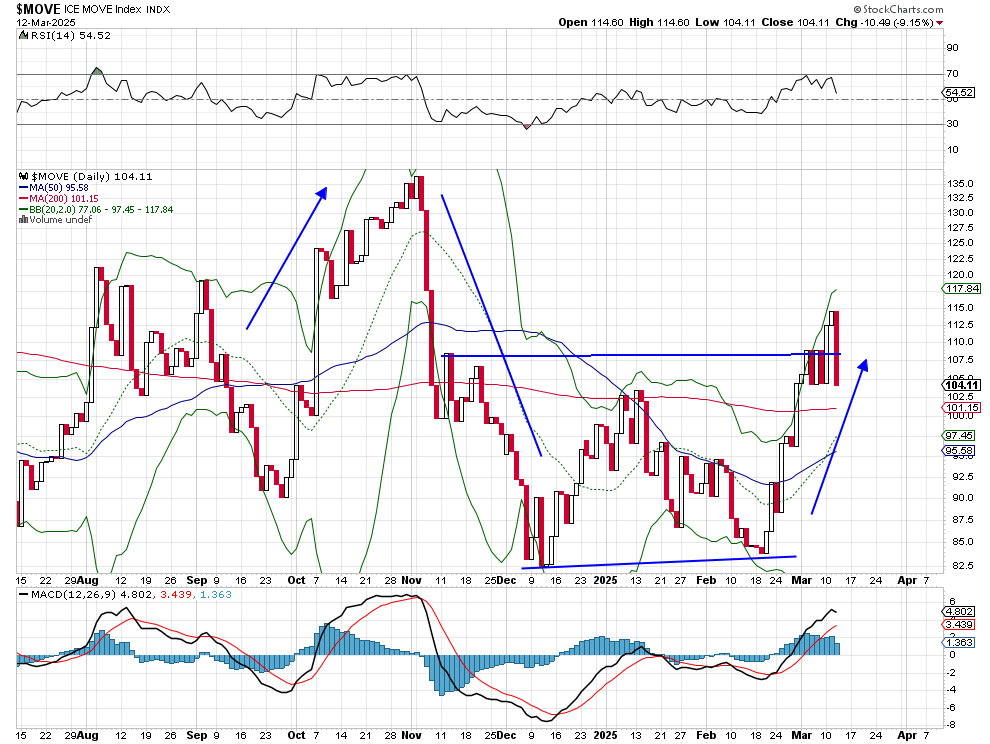
Chart of the Week: The Bond Market Option Volatility Estimate Index
We are going in a different direction with this week’s featured chart, but we think it will give you some understanding of the bond market's movements.
When we talk about rising volatility, it is simply a widening out of the range that contains a wider area of probabilities for prices to land. A common example would be if an index is priced to move in a four-point range and suddenly volatility rises by 50%, then we can see the index range expands to a six-point range, and yes that is up or down. But as investors, we are all risk averse, and that higher range to the downside feels much worse than the higher range to the upside (when the index moves within that range).
The bond market, like the stock market, has its own volatility index. For reference, the S&P 500 has the volatility index, or VIX, to measure the degree of price fluctuation over a 30-day period. For the bond market, we use the MOVE Index, or the Bond Market Option Volatility Estimate Index. This simply measures the height of past moves and implies how much volatility we can expect in the future, and market expectations of interest-rate movements.
What does an uptrend in the MOVE index imply? It means we can expect wider and larger interest-rate fluctuations. Conversely, when the MOVE is moving down or is nascent then we can expect tighter rate movement (smaller range).
Now, what is happening when bond market volatility is rising? We can point to several reasons like higher inflation being the biggest reason, high debt levels by the government (and deficits), and simply little interest in U.S. Treasury securities (it happens from time to time). A rise in the MOVE might indicate market uncertainty and worries over risk, with sentiment being poor as well.
The MOVE chart shows some powerful moves. Back in October and November 2024, there were some large swings up and down. The move in October made sense as interest rates were on the rise as "sticky inflation" remained stubborn. Rates came down in November a bit following the election results and the hope that interest rates would fall as a new administration would be in place.
Currently, the MOVE is in an uptrend, so we know the worry is on the side of higher rates. After peaking around 4.8% on the 10-year yield in January it seems the recent low of 4.1% looks firm (chart not shown). If the MOVE continues to rise then expect move instability in the bond market and erratic price moves up and down, which could unnerve many fixed-income investors, who are not used to that sort of undulation.
Other charts we shared with you this week were:
Monday, March 10: S&P 500 - Poor Action Translates Into Correction Territory
Monday, March 10: Amazon (AMZN) - Amazon Shows Major Corrective Move
Tuesday, March 11: Morgan Stanley (MS) - Morgan Stanley Can't Escape the Vice Grip of the Bear
Wednesday, March 12: Palantir (PLTR) - Time to Buy Palantir After Fall From Grace
Thursday, March 13: Eaton Corp. (ETN) - A Holding Battles With a Long-Term Support Level
The Week Ahead
If you were hoping for things to slow down a bit as we approach the end of March, we’re sorry to inform you that won’t be the case next week. We have some important consumer spending data coming, an update to the Atlanta Fed’s GDPNow model, the Fed’s policy meeting and next set of economic projections, as well as a few key earnings reports that will set the tone for the March-quarter earnings season. While we could see the market continue to rally early next week, subject to weekend developments, events on Wednesday and Thursday could bring back more choppy action. Let’s break it down.
Monday and Tuesday will bring a few more pieces of February data, including the Retail Sales, Industrial Production, and Housing Starts reports. These will build on the data for the second month of the year we’ve already received, including PMI, employment and inflation data, and updated consumer sentiment findings. They will also help round out the economic picture ahead of the Fed’s Wednesday policy statement.
Based on Fed Chair Powell’s most recent comments and what we've seen in the data, neither we nor Wall Street expect the Fed to deliver a rate cut next week. Still, we will be mining the Fed’s policy statement Wednesday afternoon, its updated set of economic projections, and Powell’s presser comments to gauge how it now sees the vector and velocity of the economy, inflation pressures, and tariff risks. We suspect Powell will reiterate the Fed’s dual mandate and the flexibility it has to respond to incoming data.
However, given the price data contained in the February PMI reports, the upswing in consumer inflation expectations, plus past comments the Fed will want to see sustained progress toward the Fed’s 2% target, the likely message will be there is no rate cut on the near-term horizon. The latest look at the CME FedWatch tool shows the market factoring in another 25-basis point rate cut at the Fed’s June policy meeting and another one to two before the end of the year.
Back in December, the Fed’s set of economic projections showed two 25-basis point rate cuts on the table for this year. That was way before more recent pricing data and the start of Trump’s tariffs. Should next week’s projection updates show fewer cuts compared to December, that could take some wind out of the market.
Here's a closer look at the economic data coming at us next week:
U.S.
Monday, March 17
· Empire State Manufacturing Index – March (8:30 AM ET)
· Retail Sales – February (8:30 AM ET)
· Business Inventories – January (10:00 AM ET)
· NAHB Housing Market Index – March (10:00 AM ET)
Tuesday, March 18
· Housing Starts & Building Permits – February (8:30 AM ET)
· Import/Export Prices – February (8:30 AM ET)
· Industrial Production & Capacity Utilization – February (9:15 AM ET)
Wednesday, March 19
· MBA Mortgage Applications Index – Weekly (7:00 AM ET)
· EIA Crude Oil Inventories – Weekly (10:30 AM ET)
· FOMC Rate Decision and Economic Projections (2 PM ET)
Thursday, March 20
· Initial & Continuing Jobless Claims – Weekly (8:30 AM ET)
· Philadelphia Fed Index – March (8:30 AM ET)
· Existing Home Sales – February (10:00 AM ET)
· Leading Indicators – February (10:00 AM ET)
· EIA Natural Gas Inventories – Weekly (10:30 AM ET)
International
Monday, March 17
· China: Retail Sales, Fixed Asset Investment - February
Tuesday, March 18
· Eurozone: ZEW Economic Sentiment Index - March
Wednesday, March 19
· Japan: Machinery Orders, Industrial Production – January
· Eurozone: Inflation Rate (Final) – February
· Eurozone: Wage Growth and Labor Cost Index – Q4 2024
Thursday, March 20
· Germany: Producer Price Index – February
· UK: Bank of England Interest Rate Decision
Friday, March 21
· Japan: Inflation Rate – February
· Canada: Retail Sales (Preliminary) - February
· Eurozone: Consumer Confidence (Flash) - March
While the volume of earnings reports coming at us will be much smaller than we’ve seen in recent weeks, we recognize comments from Darden Restaurants (DRI), FedEx (FDX), Micron (MU), and Nike (NKE) will be ones that influence expectations for the March-quarter earnings season. We’ll be focusing on demand and margin comments as well as what these companies say about inflation pressures and the impact of tariffs.
We’ll also look to see if they confirm our thinking about the risk of June-quarter guidance underwhelming Wall Street expectations. The same goes for any comments about 2025 expectations. That will see us revisit quarterly 2025 consensus EPS expectations for the S&P 500 from FactSet on Friday. Here's a closer look at the earnings reports coming at us next week:
Monday, March 17
· Open: Science Applications (SAIC)
Wednesday, March 19
· Open: General Mills (GIS), Kingsoft Cloud (KC), Signet Jewelers (SIG)
· Close: Five Below (FIVE), Super Micro Computer (SMCI)
Thursday, March 20
· Open: Darden Restaurants (DRI)
· Close: FedEx (FDX), Lennar (LEN), Micron (MU), Nike (NKE)
Portfolio Investor Resource Guide
· Economic Data: Here's a List of Links to the Key Economic Data We Closely Watch
· Investing Terminology: 16 Key Terms Club Members Should Know
· 10-Ks: Want to Know About a Stock? Read the Company's Reports
· 10-Qs: Unlock the Numbers and Key Information Behind Your Stock With the 10-Q
· Income Statement: Our Cheat Sheet to Understanding This Financial Document
· Balance Sheet, Cash Flow Statements, and Dividends: How to Know If a Company Is Off-Kilter? Read Its Balance Sheet
· Valuation Metrics: Everyone Wants a Value. Here's How Investors Can Find
· Thematic Investing 101 Webinar
The Portfolio Ratings System
1 - Buy Now (BN): Stocks that look compelling to buy right now.
2 - Stockpile (SP): Positions we would add to on pullbacks or a successful test of technical support levels.
3 - Holding Pattern (HP): Stocks we are holding as we wait for a fresh catalyst to make our next move.
4 - Sell (S): Positions we intend to exit.
