Weekly Roundup: As VIX Spikes, Are 2 Stocks Quietly Signaling a Bottom?
Uncertainty weighed on the market and Portfolio this week, one where we added to three holdings, and locked in meaningful gains on two others.
You've reached your free article limit
You've read 0 of 1 free Pro articles.
While the S&P 500 closed the week on a positive note (the Nasdaq Composite was the lone market index to close out Friday in the red), it wasn’t enough to erase the declines earlier in the week. The net impact led the S&P 500 to shed 1.4% this week, while the Nasdaq lost 2.1%. While the Pro Portfolio fared better on a relative basis, it too gave up some ground. The one major market indicator that climbed week over week? The CBOE Volatility Index, which rose more than 19% to finish at 21.23, marking its highest end-of-week reading since November 21.
We’ve often discussed how the resetting of consensus expectations, be it consensus EPS figures for the S&P 500 or a particular company, Fed rate cuts, or, as we saw last year, international trade, can be a challenging time. This time around, we have some of those factors but also renewed geopolitical tensions, and as we discussed in Friday’s opening comments, the knee-jerk AI-related reaction on a shifting list of sectors. Factor in investor sentiment flashing “Fear” and the uptrend in the Volatility Index, and it’s led to some extreme swings, overreactions, and, in several cases, overcorrections.
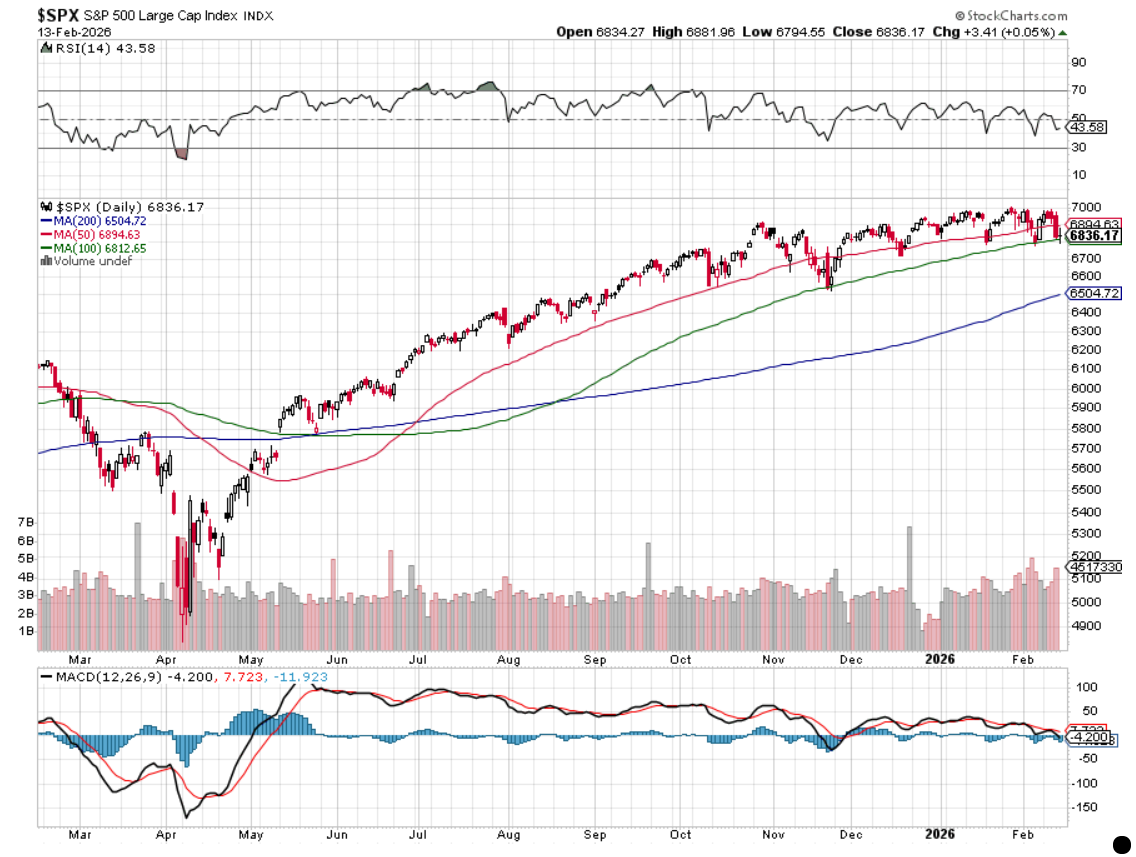
Like last week, we saw the S&P 500 move below its 50-day moving average and tag its 100-day moving average this week, but unlike last week, it didn’t rebound sharply to close the week above the 50-day. In looking at the S&P 500 over the last two and a half months, it’s trading in a range between 6800 and 7000 following the substantial move off the April 2025 lows.
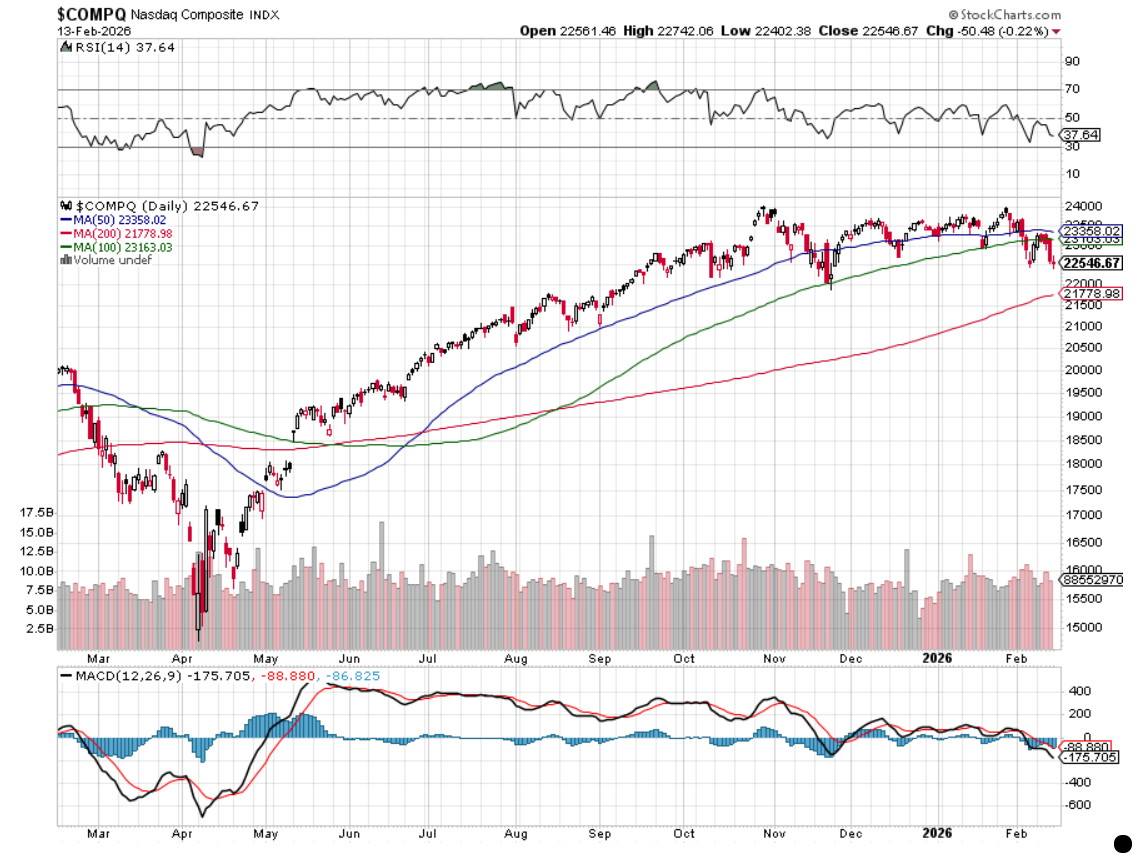
When we look at a similar one-year chart for the Nasdaq Composite, complete with its 50-day, 100-day, and 200-day moving averages, we see a different picture. It’s one we can attribute to the knee-jerk reaction to AI on software and other sectors, with investors later than we were in realizing the headwind memory shortages will have on smartphone and other consumer electronic shipments. Apple’s (AAPL) latest setback with its AI-enabled Siri added to things as well.
However, as we touch on below, we are started to see some of the really beaten-up stocks, such as ServiceNow (NOW) and Palantir (PLTR) , perk up late this week, potentially finding their footing. Over the long weekend, we’ll revisit their technical setups, but we may want to tread carefully until we see a firmer setup in the Nasdaq. While we would relish a rebound in NOW and PLTR shares, we’d rather not get head-faked either. Between now and the Bernstein Insight Conference on February 25 and the Morgan Stanley Technology, Media, & Telecom Conference on March 3, we’ll be refreshing the technicals for the Nasdaq Composite as we assess oncoming data and earnings insights.
In Thursday’s Portfolio video, we discussed the level of investor fear in the market, and it didn’t change much on Friday. Should we see the level of fear step to extreme levels, the VIX pop near a reading of 27 or higher, and the S&P 500 retest its 100-day moving average, that’s a combination that could lead us to put some capital to work in a quicker fashion.
The other catalyst for such action would be for some of the uncertainty drivers to be resolved. However, our thinking is certain of these, such as U.S-Iran tensions and AI-related sector concerns, will take more time to be resolved. The former could take up to a month or more, while for the latter, we will need to hear upbeat comments from pressured companies in the upcoming wave of investor conferences and further step-ups in key metrics, like backlogs, deferred revenue, and total contract value.
Our assessment is that improving technicals will help battered stocks rebound somewhat, but the corresponding companies will need to deliver metrics that erase AI-related worries. As we approach those events, we’ll be busy collecting data and other tea leaves that will indicate what we’re likely to hear, so we can position ourselves accordingly.
When we come back from the long weekend, we’ll start the day off with 8 Key Items Shaping the Stock Market and share an updated table of consensus EPS figures, RSI, and beta levels, and a few other things for the Portfolio’s holdings.
Enjoy your weekend, Saturday’s Signals alert, and we’ll see you back here bright and early Tuesday morning.
Catching Up on the Portfolio This Week
The week-over-week decline in the market was felt inside the Portfolio and its holdings. However, strong gains in Eaton (ETN) , Welltower (WELL) , SuRo Capital (SSSS) , Waste Management (WM) , and Arista Networks (ANET) , as well ServiceNow (NOW) and Axon (AXON) perking up, minimized that impact. The Portfolio’s EPS Diplomats strategy contributed to that effort as well.
As we move past the halfway mark for the current quarter, the EPS Diplomats basket is up 13.1%,making it a strong outperformer relative to the S&P 500. Despite the drag of Credo (CRDO) and Carvana (CVNA) , outsized moves in Lumentum (LITE) , SiTime (SITM) , and the basket's gold plays are more than compensating.
Turning to actions taken this past week, we added to our holdings of SuRo Capital on Monday and picked up more shares of Microsoft (MSFT) and Axon on Tuesday. Thursday, we took advantage of the parabolic move in Eaton shares to lock in a nice gain of more than 37%, and we did the same on Friday with Welltower with a robust gain just shy of 26%.
Netting those moves out, the Portfolio’s cash position stood around 7.9% of its assets. We’ll remain on watch for holdings that have made demonstrative moves and have crossed into a deeply oversold condition. Still, as we discussed in Thursday’s Portfolio video, we are also keeping a close a watch on indicators that would signal when investor fear is high, and the overreaction in stocks like ServiceNow, Palantir (PLTR) and others has ended or is nearing its end.
By the end of next week, ~85% of the S&P 500 will have reported, and as the pace of quarterly reporting slows, we will see an uptick in investor conferences. In some cases, management presentations at those events will allow us to check in on demand patterns and other key metrics. For our existing holdings, those will be nice touch points, but we will also be using what we learn to contemplate some new additions to the Bullpen and potentially the Portfolio.
Now let’s see what others on Wall Street had to say about the Portfolio’s holdings during the week:
Monday: Wedbush added shares of ServiceNow to its AI 30 List, the one that powers the Dan Ives Wedbush AI Revolution ETF (IVES) . Bernstein nudged its Costco (COST) price target to $1,155 from $1,146.
Tuesday: Deutsche Bank trimmed its Marvell (MRVL) price target to $120 from $125, while Evercore ISI increased its Costco target to $1,050 from $1,025. Rosenblatt Securities lifted its Arista Networks (ANET) target to $165 from $140. Daiwa Securities upgraded Palantir shares to Buy from Neutral with a $180 target.
Wednesday: Following a fresh round of supply chain channel checks, UBS increased its Nvidia (NVDA) target to $245 from $235.
Thursday: UBS boosted its Welltower price target to $240 from $228, while Cantor Fitzgerald lifted its target to $230 from $204.
Friday: Morgan Stanley nudged its Dutch Bros (BROS) price target to $85 from $82 and took its target for Arista Networks to $165 from $159. Goldman Sachs and UBS increased their Arista targets to $188 and $177, respectively, from $165 and 155. The bigger move was at Evercore ISI as it took its ANET target to $200 from $175. Citi lowered its BROS target by $1 to $81.
This Week's Portfolio Videos
We cover a lot of ground during the week in our videos. If you happened to miss one or more of them, here are some helpful links:
Monday, February 9: Is the Market Nearing its Bottom?
Tuesday, February 10: Why We Bought More Microsoft, Axon
Wednesday, February 11: Stocks & Markets Podcast: The Hidden Forces Driving the New Gold Rush
Thursday, February 12: When to Get Greedy as AI Fear Drives Move Lower
Key Global Economic Readings
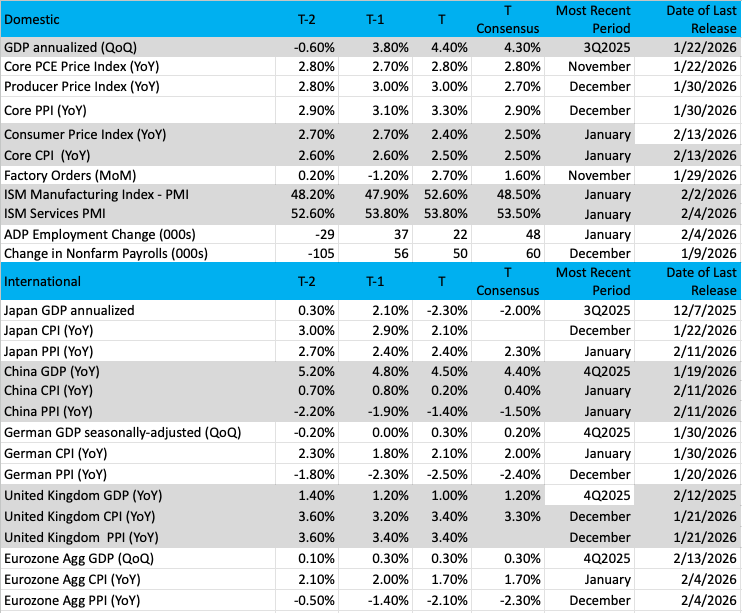
(Note: T is the most recent period, T-1 is the prior period's reading, and T-2 is two periods back, the intent being to illustrate any trends.)
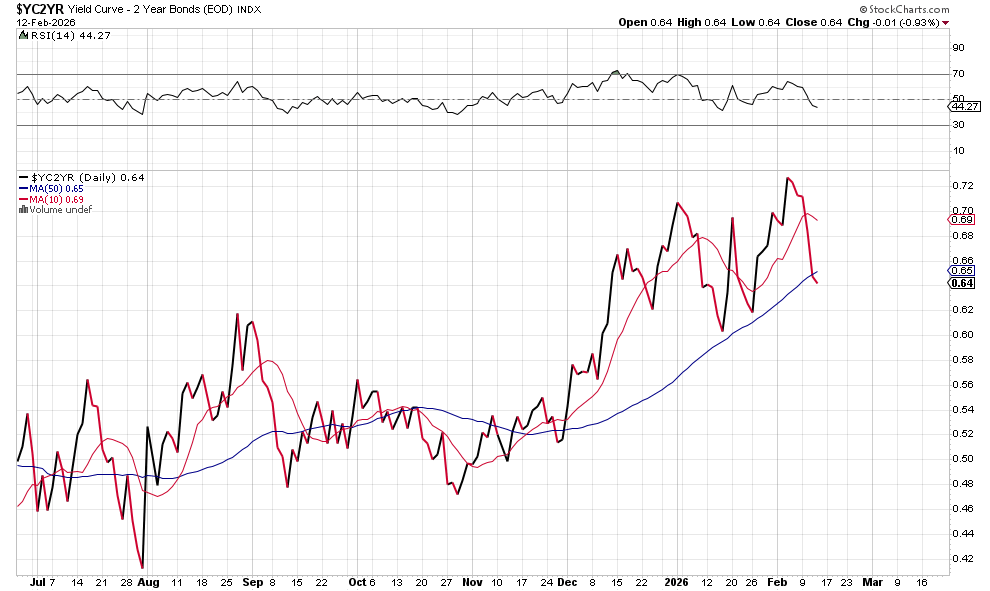
Chart of the Week: The 2/10 Yield Curve
As stock investors, we rarely pay too much attention to what is happening in the bond market. Yet we should understand that the bond market dwarfs the size of the stock market. By some estimates, the bond market is about 20-30% larger than its sister exchange (stocks) and is often considered a prime indicator of economic performance and inflation. Remember, bond investors hate inflation; it is like Kryptonite to Superman.
So, while we may not care much about a $20 billion bond offering by Alphabet (GOOGL) or a daily auction by the Treasury selling bonds, we should always be aware of what is going on there to understand the health and well-being of the economy.
The yield curve is a good way to analyze what is happening in the bond market. Without getting too technical, a positive-sloping (or normal) yield curve often signals a strong economy, rising inflation, higher rates, and rewards investors who prefer lending long term. We often see this curve sloping upward during economic expansion.
We can analyze various maturities across the yield curve; some have a special "relationship" that can be very predictive. Take the 2/10 curve, analyzing the 2-year yield over the 10-year yield. This comparison is talked about frequently in financial media as it is a true representation of market expectations for growth and inflation. A wide spread is seen as positive, which means growth is likely, while a flat or negative slope (not common) can predict a slowdown at best or a recession at worst.
Sentiment is an important factor in determining the success of stock market traders and investors. When people are feeling good about their jobs, security, family, health, and finances, they tend to spend and invest more of their wealth. But if there are hardships due to economic failure, inflation, or recession, then consumers/investors pull back.
We look at the 2-year yield as that is a good representation of where inflation might be currently. The Federal Reserve pays very close attention and uses this yield to determine if inflation expectations are well-anchored. On the other hand, the 10-year is a good yield to help us determine if growth is strong or not. Mortgage rates are sensitive to the 10-year, and as we know, a mortgage is often the biggest debt load for homeowners. If the 10-year yield is pushing lower, it means financing costs for homeowners are also dropping, which can be a positive long term (lower rate on your mortgage).
Which brings us to the 2/10 yield curve spread. The chart below shows the 2/10 spread with some volatility since December, but it is sloping upward and positive. No doubt this curve reflects recent economic strength (Q3 was 4.4% and Q4 estimates are high, too) and forecasts for strong growth into the future.
Lastly, we should understand what a healthy spread level should be. Look to the right, and we see the current spread is 0.64. Simply put, this means the differential between the two yields is 0.64, with the 2-year lower than the 10-year. If the spread remains positive, then we can assume the economy is growing. A negative slope might imply a recession is on the way. We are clearly not there today.
Other charts we shared with you this week were:
Monday, February 9: S&P 500 - Amazing Turnaround Catches Bears Napping
Monday, February 9: TJX Companies (TJX) - 'Big Money Favorite' Enjoys a Strong Push Higher
Tuesday, February 10: Dutch Bros (BROS) - Dutch Bros Needs a Jolt of Caffeine
Wednesday, February 11: First Trust Nasdaq Cybersecurity ETF (CIBR) - Here's the Critical Price to Watch for CIBR Bulls
Thursday, February 12: Arista Networks (ANET) - This Tech Name Could Explode Higher After Earnings
The Week Ahead
Enjoy the long weekend, as it once again means we will compress five days of data, earnings, Fed speakers, and other developments into four days next week. As you can see below, the week’s economic data bring some incremental data on housing and the services sector, but the market’s attention will more than likely be focused on the numbers we get on Friday.
Following the tick lower in the headline January CPI data to 2.4% on a year-over-year basis, the market will be looking for some corroborating movement in the December PCE Price Index. As we parse those figures as well as Personal Income & Spending data for the month, we’ll be more focused on the revelations revealed in the Flash February PMI report from S&P Global.
Here's a closer look at the economic data coming at us next week:
U.S.
Tuesday, February 17
ADP Employment Change - Weekly (8:15 AM ET)
Empire Manufacturing Index – February (8:30 AM ET)
NAHB Housing Market Index – February (10:00 AM ET)
Wednesday, February 18
MBA Mortgage Applications Index – Weekly (7:00 AM ET)
Housing Starts & Building Permits – November, December (8:30 AM ET)
Durable Orders – December (8:30 AM ET)
NY Fed Services Activity Index – February (8:30 AM ET)
Industrial Production & Capacity Utilization – January (9:15 AM ET)
EIA Crude Oil Inventories – Weekly (10:30 AM ET)
Thursday, February 19
Initial & Continuing Jobless Claims – Weekly (8:30 AM ET)
Imports/Exports – December (8:30 AM ET)
Philly Fed Manufacturing Index – February (8:30 AM ET)
Retail & Wholesale Inventories – December (8:30 AM ET)
Pending Home Sales – January (10:00 AM ET)
EIA Natural Gas Inventories – Weekly (10:30 AM ET)
Friday, February 20
Personal Income & Spending- December (8:30 AM ET)
PCE Price Index – December (8:30 AM ET)
GDP – Q4 2025 (8:30 AM ET)
S&P Flash Manufacturing & Services PMI – February (9:45 AM ET)
New Home Sales – November, December (10:00 AM ET)
Michigan Consumer Sentiment Index (Final) – February (10:00 AM ET
International
Monday, February 16
Eurozone: Industrial Production – December
Tuesday, February 17
China: Foreign Direct Investment – January
Germany: Inflation Rate – January
UK: Employment Change and Unemployment Rate – December
Eurozone: ZEW Economic Sentiment Index - February
Wednesday, February 18
Japan: Exports/Imports - January
UK: Inflation Rate - January
Thursday, February 19
Japan: Machinery Orders - December
Friday, February 20
Japan: S&P Flash Manufacturing & Services PMI – February
Japan: Inflation Rate - January
Eurozone: HCOB Flash Manufacturing & Services PMI - February
UK: S&P Flash Manufacturing & Services PMI – February
Germany: Producer Price Index - January
UK: Retail Sales - January
We will see a further widening out in the types of companies reporting next week, as we near the final legs of the current earnings season. The only Portfolio holding reporting next week is Labcorp (LH) , and given how that is on Tuesday morning, we’ll look to use the balance of the week to revisit the Bullpen and existing holdings that are becoming more compelling on a risk-to-reward basis. We’ll also continue to connect the dots from other companies reporting back to the Portfolio’s positions where appropriate.
The one earnings report that is most likely to move the market next week will be Walmart (WMT) . We’ll use that to benchmark Costco’s (COST) recent monthly comp sales figures as well as revisit expectations about the consumer in 2026. We’ll also be interested in what it says about its advertising and digital shopping businesses, things we’ll be sizing up for Amazon (AMZN) .
Outside of corporate earnings, United Rentals (URI) will present at the Citi Global Industrial Tech & Mobility Conference on February 17. The same day, Eaton’s (ETN) management team will present at the Barclays Industrial Select Conference.
Here's a closer look at the earnings reports coming at us next week:
Tuesday, February 17
Open: Ceva (CEVA), CNH Industrial (CNHI), Fluor (FLR), Labcorp (LH), Vulcan Materials (VMC),
Close: Caesars Entertainment (CZR), Palo-Alto Networks (PANW), Toll Brothers (TOL).
Wednesday, February 18
Open: Analog Devices (ADI), Cinemark (CNK), Dana (DAN), Equinox Gold (EQX), Fresh Del Monte (FDP), Insulet (PODD), Wingstop (WING),
Close: American States Water (AWR), American Water Works (AWK), Carvana (CVNA), Cheesecake Factory (CAKE), DoorDash (DAH), Jack in the Box (JACK), Kinross Gold (KGC), Molson Coors (TAP), Omnicom (OMC),
Thursday, February 19
Open: GATX (GATX), Lemonade (LMND), Quanta Services (PWR), Visteon (VC), Walmart (WMT)
Close: Alarm.com (ALRM), AMN Healthcare (AMN), Con Edison (ED), Dropbox (DBX), Harmonic (HLIT), LegalZoom (LZ), Select Medical (SEM)
Friday, February 20
Open: Lamar Advertising (LAMR)
Portfolio Investor Resource Guide
Economic Data: Here's a List of Links to the Key Economic Data We Closely Watch
Investing Terminology: 16 Key Terms Club Members Should Know
10-Ks: Want to Know About a Stock? Read the Company's Reports
10-Qs: Unlock the Numbers and Key Information Behind Your Stock With the 10-Q
Income Statement: Our Cheat Sheet to Understanding This Financial Document
Balance Sheet, Cash Flow Statements, and Dividends: How to Know If a Company Is Off-Kilter? Read Its Balance Sheet
Valuation Metrics: Everyone Wants a Value. Here's How Investors Can Find
Thematic Investing 101 Webinar
Like the Benefits of ETFs? Let’s Talk About Models
The Portfolio Ratings System
1 - Buy Now (BN): Stocks that look compelling to buy right now.
2 - Stockpile (SP): Positions we would add to on pullbacks or a successful test of technical support levels.
3 - Holding Pattern (HP): Stocks we are holding as we wait for a fresh catalyst to make our next move.
4 - Sell (S): Positions we intend to exit.
Stocks & Markets Podcast Links
Some helpful links if you prefer to catch the podcast on the go, in the car, or wherever. Be sure to give it a like or thumbs up and leave a review if you’re so inclined. We’d appreciate it.
