Wednesday's Economic Data Reinforce Our Bullish Tilt on 3 Holdings
Let's take a close look at ADP job data, March manufacturing numbers, retail sales, inflation and all the implications.
You've reached your free article limit
You've read 0 of 1 free Pro articles.
 Economic Data
While the market continues to rebound Wednesday, lifting both the Pro Portfolio’s long individual stock positions as well as the bulk of the newly reconstituted EPS Diplomats basket, it would be a mistake to take our eye off the ball of today's March economic data.
This compilation is the first hard look at what was captured, snapped, or whatever you want to call it, since the start of the U.S.-Iran conflict, and the zoom higher in oil, gas, diesel, and other items we’ve been chin-wagging about with you the last few months.
ADP's March Employment Change Report
ADP found that private businesses in the U.S. added a net 62,000 jobs in March, extending the upwardly revised 66,000 in February and above market expectations of a 40,000 increase. Taking a look at the data from a trailing three-month basis, we see an upward slope in the pace of job creation to ~46K up from ~39K in February and ~8K in January.
On its own, that points to not a robust level of job creation, but certainly not an imploding one. And that’s not enough to spur the Fed into rate-cutting mode, especially given what we’ll discuss with you in the next two sections.
S&P Global's Final March Manufacturing PMI
The final findings from S&P tend not to be overly different than those found in its Flash report, and what we see is a pick-up in manufacturing activity in March, and an increase in new and order activity. However, that activity appears to be driven more by the buildup of potential safety stock given U.S.-Iran related headlines than by underlying demand.
Job creation was minimal in the manufacturing sector during March, but as we have been expecting, the jump in energy prices led to higher fuel prices, while tariffs continued to push up costs. As S&P put it:
"Overall input prices subsequently rose sharply, with inflation picking up to its highest level since last August. Wherever possible, firms increased their own charges in response to greater input costs. Factory gate prices rose at a noticeably quicker rate in March, with inflation reaching its highest in seven months."
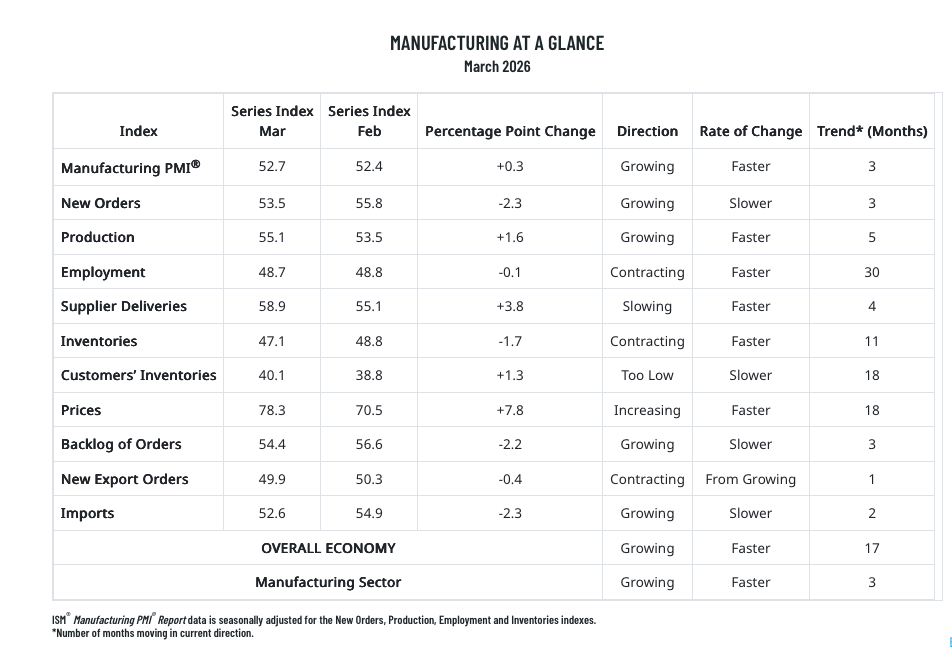
ISM’s March Manufacturing Index
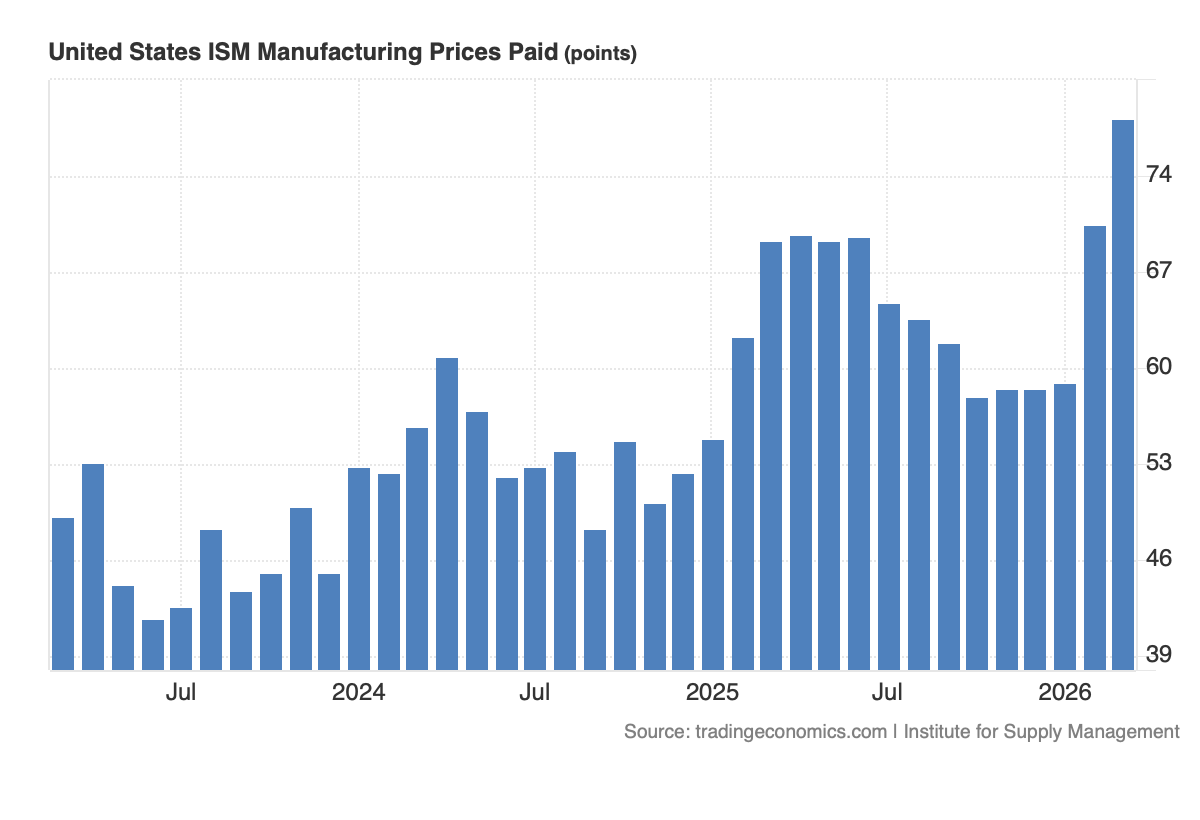
The bulk of the March manufacturing PMI data points published by ISM echoes those from S&P Global, but it’s hard to miss that jump in the Prices sub-component to 78.3.
To put some perspective around it, let’s take a look at where that indicator has been over the last three years.
What About February Retail Sales?
February headline Retail & Food Service sales accelerated to 3.7% on a year-over-year basis, up from 3.2% in February and 3.1% for the December 2025-February 2026 period on that same basis. Focusing on Retail only, that spending increased 3.5% compared to March 2025, and parsing the data, we find that the barometer of spending was the fastest in the trailing three-month period.
Where we saw upticks in the report’s categories were clothing, sporting goods and related areas, motor vehicles, and food service/restaurants. The data showed continued spending declines in furniture, department stores, gas stations, and grocery/food & beverage stores. We also see slower spending in building materials and general merchandise stores.
Our take is this bodes well for our position in TJX Cos. (TJX) , and we continue to see it well positioned as consumers contend with the pinch of higher gas and other prices. Remember in today’s opening comments, we discussed the impact of higher oil, gas, and diesel prices on food delivery costs.
And while it seems like almost forever ago now, when Costco (COST) reported its recent quarter, it included its February comp sales. Adjusted U.S. comps sales rose 6.0% in February compared to the 0.2% March decline for grocery stores, and the 1.2% gain for general merchandise stores, and the overall 3.5% year-over-year increase in Retail sales. While it may be a bit in the rearview mirror with Costco poised to deliver its March sales report on April 8, it’s still a nice piece of confirmation for Costco continuing to win consumer wallet share.
Putting It All Together
As we assemble the above pieces, let’s remember that the manufacturing economy accounts for 10%-15% of GDP, with the service economy picking up the balance. Between ADP’s March jobs figures and ISM’s still contracting manufacturing numbers in March, we will want to see a step up in ISM’s service employment indicators when that report is published on Monday (April 6). That will be after this Friday’s March Employment Report, which will be issued during a market holiday, but ISM’s data will help us better understand where the jobs are being created.
With both S&P Global and ISM finding a sharp increase in inflation pressures — again, not all that surprising — we are likely to see a combination of renewed inflation pressures from the March, April, and maybe May CPI and PPI data. That will hinge, as we’ve talked about, on where energy and related prices settle out in the coming weeks and months, but we are likely to see margin pressure emerge when companies report their March-quarter results.
Because of that renewed inflation pressure, which will cut into consumer spending, we should expect to see several categories in the monthly Retail Sales report weaken in March compared to February. That will have us keenly interested in comparing that March report against Costco’s March sales report. Based on our own trips to Costco during March, even though Costco continues to lap strong 2025 figures, we should see a nice positive sales comp.
We should also expect the March non-store retail sales line item to outperform the other categories, largely because of Amazon’s (AMZN) March 25-March 31 Big Spring Sale. And yes, we continue to see consumers pivoting toward Amazon as they contend with the surge in gas prices.
At the time of publication, TheStreet Pro Portfolio was long TJX, COST and AMZN.
