Weekly Roundup: Stocks Take a Trump Tumble, But We’re Still Beating the S&P 500
We prudently booked gains early this week and added a brand new Bullpen name.
You've reached your free article limit
You've read 0 of 1 free Pro articles.
Between the relative strength index (RSI) levels for the S&P 500 and the Nasdaq Composite, we entered this week with the stock market approaching overbought territory. At the same time, the Fear & Greed Index was nearing “Extreme Greed” even though both market indexes posted significant moves off their early April lows.
The message we were conveying was that it would not take much to see some short-term profit-taking by those whose time horizons were far shorter than ours at TheStreet Pro Portfolio. And that is what we saw unfold as the major market averages fell 2.4%-2.6%. The good news is that with four trading days left in May, the Pro Portfolio continues to outperform the S&P 500 on a year-to-date basis.
There were a few catalysts behind this week's move lower. These included the recent U.S. credit downgrade by Moody’s, fiscal concerns over Trump’s “big beautiful bill" that narrowly passed the House vote, inflation perking up per S&P Global’s Flash PMI data, and renewed Trump tariff threats on Friday toward the European Union. Perhaps the long weekend will bring calmer minds and trade conversation, but if it doesn’t there is reason to think we will see another round of conservative guidance and comments as companies report results, discuss the current quarter, and update expectations for the second half of 2025.
This means that, as we get set to close out May next week and get ready for the usual start-of-the-month data deluge, we will remain mindful of the market mood and the technical setup for the S&P 500. When we return from the holiday weekend on Tuesday, we will kick things off with a fresh technical look on the S&P 500. We’ll also bring everyone up to speed on any meaningful trade and related developments from the long weekend.
Ahead of that technical deep dive, we still see support for the S&P 500 between 5766 and 5773. However, we also see a gap below that near 5700. That’s about 2% or so lower than the S&P 500 closed on Friday, and we have to remember that pullbacks of 4% to 5% tend to happen a few times each year, on average. The midpoint of that 4% to 5% range from the S&P 500’s recent high of 5968.91 on May 19 is about 5700.
With those levels in mind, we’ll look to revisit our shopping list as well as one or two potential new candidates for the Pro Portfolio as some of the froth we’ve been talking about comes out of the market. We will continue to leverage our thematic and fundamental framework while heeding both market and individual stock technicals to make prudent decisions for the Portfolio and you.
Catching Up on the Portfolio This Week
On Tuesday, following significant moves over the last few weeks and our concern about the market becoming overbought, we did some prudent register ringing in shares of Axon Enterprise AXON, Dutch Bros BROS, Eaton ETN, First Trust Nasdaq Cybersecurity ETF CIBR, Microsoft MSFT, and ServiceNow NOW. Those trades boosted our cash level, and as we close out the week it is running around 14.5% of the pro Portfolio’s assets.
In Thursday’s video, we explained why our near-term plan was largely to sit on the sidelines as the market contends with a few headwinds that could see it go lower near-term. Staying on that path, on Friday we added SuRo Capital SSSS to the Bullpen, discussing potential entry points for the Pro Portfolio for this twin play on CoreWeave CRWV and ServiceTitan (TTAN) and the potentially brighter outlook for the IPO market.
Over the weekend and into next week, we will see what develops on the Trump tariff front, digest more retail earnings, and parse comments from other reporting companies and those making the investor conference rounds. We will be mindful of market conditions, but our plan remains the same — follow the data and position the Pro Portfolio accordingly given our medium-to long-term time horizon.
Now let’s see what Wall Street had to say this week about the Pro Portfolio’s holdings:
Truist lifted its Bank of America BAC price target to $51 from $47 following signs of better-than-expected loan growth and the pick-up in M&A activity. We recently boosted our BAC target to $50 from $45.
Erste Group upgraded Morgan Stanley MS to Buy from Hold, saying it sees the company's earnings in 2025 increasing more than revenue and its return on equity is significantly higher than its competitors. We recently boosted our MS target to $140 from $120.
Evercore ISI inched its Microsoft target to $515 from $500 and reiterated its Outperform rating.
KeyBanc upped shares of United Rentals URI to Overweight from Sector Weight with a $865 target. JPMorgan raised the firm's price target on URI to $920 from $780 and kept an Overweight rating. Following Dycom’s DY updated outlook, we shared we would look to review our current URI price target once we have the April Construction Spending report in hand on June 2.
JPMorgan lifted its rating and price target on Waste Management WM to Overweight and $277, from Neutral and $225.
This Week's Portfolio Videos
We cover a lot of ground during the week in our Daily Rundowns. If you happened to miss one or more of them, here are some helpful links:
Monday, March 19: Why We're Eagerly Awaiting This One Key Report
Tuesday, March 20: This Holding Looks Good as Tariff Impacts Show Up in Earnings
Tuesday, May 20: Why Now Was Time to Lock in Gains
Wednesday, March 21: TheStreet Stocks & Markets Podcast #6: The Next Market Catalyst With Jay Woods
Thursday, March 22: Costco Just Got a Major Boost From a Competitor
Key Global Economic Readings
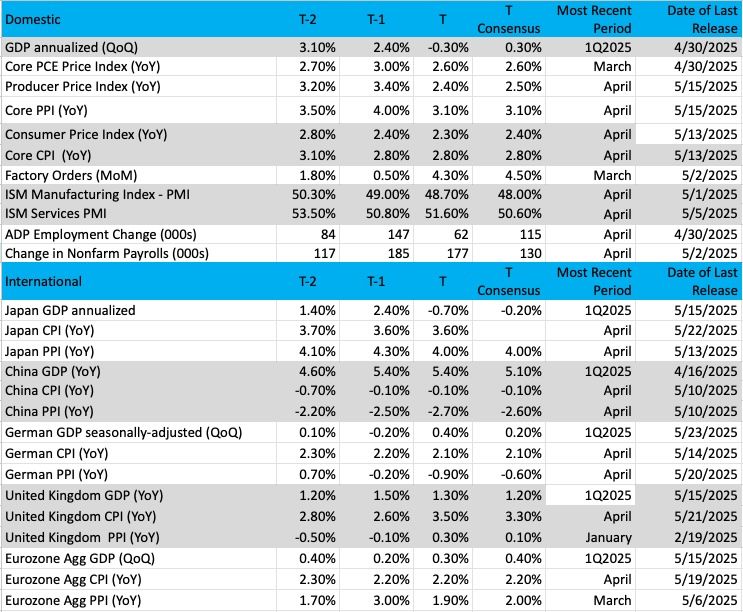
(Note: T is the most recent period, T-1 is the prior period's reading and T-2 is two periods back, the intent being to illustrate any trends)
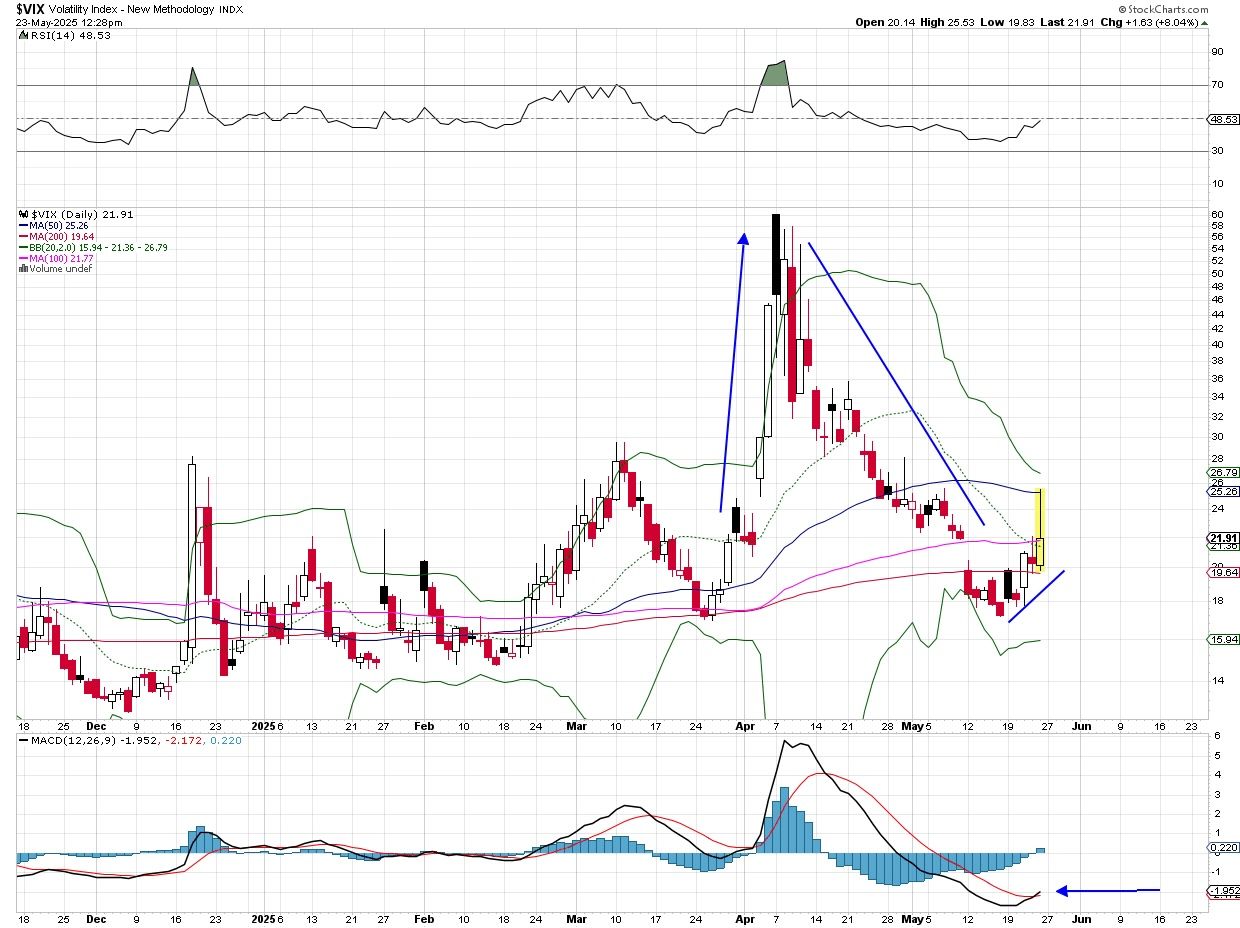
Chart of the Week: The Volatility Index
Market volatility is on the move, and we can track it using the volatility index, or the VIX for short. An up move in the VIX tells us market participants are feeling fearful about the near future and are either looking to sell holdings or add protection (shorting the market/stocks or buying put options). Sentiment can turn on a dime as we have seen over the past couple of months.
No question the cloud of trade policy with tariffs intersecting with still sticky inflation is causing some consternation and doubt. Remember, the market likes certainty and if there is a whiff of the opposite, many investors/traders will quickly head to the sidelines to wait things out.
It makes sense and is understandable why fear would be present, but is selling out at the first sign of trouble the right approach? We’re not so sure, as there have been many drops in the market recently that have been bought up aggressively by the dip buyers. Now, we do not know if this current pullback is going to the "one" that does not get bought, but certainly, we can look at the VIX chart to help give us some clues.
That massive surge in April sent shivers through all investors in stocks and bonds. A spike from 16 to 60 is rare in such a short period of time, in this case about nine trading sessions. But what goes up comes down as well and once cooler heads prevailed the volatility sellers were back to knock the VIX down.
The current situation, though, could prove troublesome if protection buyers continue to add insurance via put options. The recent uptrend from about 17 to 25 seems mild and moderately disruptive, but if the VIX starts trending higher this could be a good countertrend move for markets to move lower. That might set up just another "buy the dip" opportunity as bullish investors/traders sell stocks at precisely the wrong time.
Other charts we shared with you this week were:
Monday, March 19: S&P 500 - What's Next After Phenomenal Feat?
Monday, March 19: Elastic (ESTC) - Elastic Looks Stretched Out
Tuesday, March 20: Costco Wholesale (COST) - The Price Is Always Right for Costco
Wednesday, March 21: TJX Companies (TJX) - After TJX Reports, the Trend Looks Positive
Thursday, March 22: Labcorp Holdings (LH) - LabCorp Isn't Passing the Growth Test Yet
The Week Ahead
U.S. equity markets are closed on Monday, March 26, for Memorial Day, which means we have another compressed week of trading. While the number of trading days will be less, it looks like we'll once again be cramming five days of activity into four given the companies reporting next week, the publication of the Fed’s most recent FOMC meeting minutes, and the April PCE price index data.
Looking at the economic data and earnings calendars, you’ll see it's stacked toward the second half of the week, which also happens to be the end of May. In addition to those items, we’ll be closely following trade talk developments, especially between the U.S. and European Union, lest Trump’s proposed 50% tariff go into effect June 1.
We’ll also be keeping a watchful eye on the market’s setup, including paying close attention to what Helene Meisler has to say. We’ll also be mindful of Jay Woods’ view on the S&P 500 he shared during this week’s Stocks & Markets Podcast – if you missed it, you can either watch the conversation or read the transcript. Both are available here.
In terms of the April PCE price index data, given the inflation findings in S&P Global’s Flash May PMI report as well as comments from a growing list of companies that price increases are on the way, we’re not inclined to give it as much weight as usual. To us, more meaningful data to watch will come in early June when we get ISM’s May PMI data and what it says about inflation as well as the pace of job creation.
Here's a closer look at the economic data coming at us next week:
U.S.
Tuesday, March 27
· Durable Orders – April (8:30 AM ET)
· FHFA Housing Price Index – March (9:00 AM ET)
· S&P Case-Schiller Home Price Index – March (9:00 AM ET)
· Consumer Confidence – May (10:00 AM ET)
Wednesday, March 28
· MBA Mortgage Applications Index – Weekly (7:00 AM ET)
· GDP (2nd Estimate) – Q1 2025 (8:30 AM ET)
· FOMC Meeting Minutes (2 PM ET)
Thursday, March 29
· Initial & Continuing Jobless Claims – Weekly (8:30 AM ET)
· Pending Home Sales – April (10:00 AM ET)
· EIA Natural Gas Inventories – Weekly (10:30 AM ET)
· EIA Crude Oil Inventories – Weekly (12:00 PM ET)
Friday, March 30
· Personal Income & Spending, PCE Price Index – April (8:30 AM ET)
· University of Michigan Consumer Sentiment (Final) – May (10:00 AM ET)
International
Tuesday, March 27
· Japan: Leading Economic Index - March
· China: Industrial Profits – April
· Eurozone: Economic and Consumer Sentiment - May
Wednesday, March 28
· Eurozone: ECB Consumer Inflation Expectations - April
Thursday, March 29
· Japan: Consumer Confidence - May
Friday, March 30
· Eurozone: Loans to Companies - April
Next week brings another round of earnings reports from retailers, but as we discussed with Jay Woods on this week’s Stocks & Markets Podcast, we also have quarterly results from Pro Portfolio holdings Nvidia NVDA, Elastic ESTC, Marvell MRVL, and Costco COST. That means it will be a busy week for us, but we will still want to parse what we also hear from HP (HPQ), Dell (DELL), Best Buy (BBY), and Salesforce (CRM) about AI and data center, cloud, and AI PC demand.
With e.l.f. Beauty (ELF) sharing late this week that it will be boosting prices on some products, we expect we will be hearing more of the same from other retailers next week. We also wouldn’t be shocked to see them follow in the footsteps of Ross Stores (ROST), American Eagle Outfitters (AEO), and others that withdrew their guidance. We’ll also be listening for comments about the use of markdowns and promotions, which could weigh on margins but also signal consumers continue to tighten their belts.
Here's a closer look at the earnings reports coming at us next week:
Tuesday, March 27
· Open: AutoZone (AZO)
· Close: Box (BOX), Okta (OKTA)
Wednesday, March 28
· Open: Abercrombie & Fitch (ANF), Capri Holdings (CPRI), Dick’s Sporting Goods (DKS), Macy’s (M)
· Close: e.l.f. Beauty (ELF), HP (HPQ), Nvidia (NVDA), Salesforce (CRM)
Thursday, March 29
· Open: Bath & Body Works (BBWI), Best Buy (BBB), Burlington Stores (BURL), Foot Locker (FL), Hormel Foods (HRL), Kohl’s (KSS)
· Close: Ambarella (AMBA), American Eagle (AEO), Cooper (COO), Costco (COST), Dell (DELL), Elastic (ESTC), Gap (GPS), Marvell (MRVL), Ulta Beauty (ULTA), Zscaler (ZS)
Friday, March 30
· Open: Shoe Carnival (SCVL)
Portfolio Investor Resource Guide
· Economic Data: Here's a List of Links to the Key Economic Data We Closely Watch
· Investing Terminology: 16 Key Terms Club Members Should Know
· 10-Ks: Want to Know About a Stock? Read the Company's Reports
· 10-Qs: Unlock the Numbers and Key Information Behind Your Stock With the 10-Q
· Income Statement: Our Cheat Sheet to Understanding This Financial Document
· Balance Sheet, Cash Flow Statements, and Dividends: How to Know If a Company Is Off-Kilter? Read Its Balance Sheet
· Valuation Metrics: Everyone Wants a Value. Here's How Investors Can Find
· Thematic Investing 101 Webinar
The Portfolio Ratings System
1 - Buy Now (BN): Stocks that look compelling to buy right now.
2 - Stockpile (SP): Positions we would add to on pullbacks or a successful test of technical support levels.
3 - Holding Pattern (HP): Stocks we are holding as we wait for a fresh catalyst to make our next move.
4 - Sell (S): Positions we intend to exit.
