September Portfolio Roundup: Defying History to Build on Our Gains
During the month, we locked in big profits and made meaningful moves with an eye to what lies ahead.
You've reached your free article limit
You've read 0 of 1 free Pro articles.
With September ending in the middle of next week, we present our latest Monthly Roundup for the Pro Portfolio. With two trading days left in the month, the Portfolio has made great strides September to date, building on the gains registered in July and August.
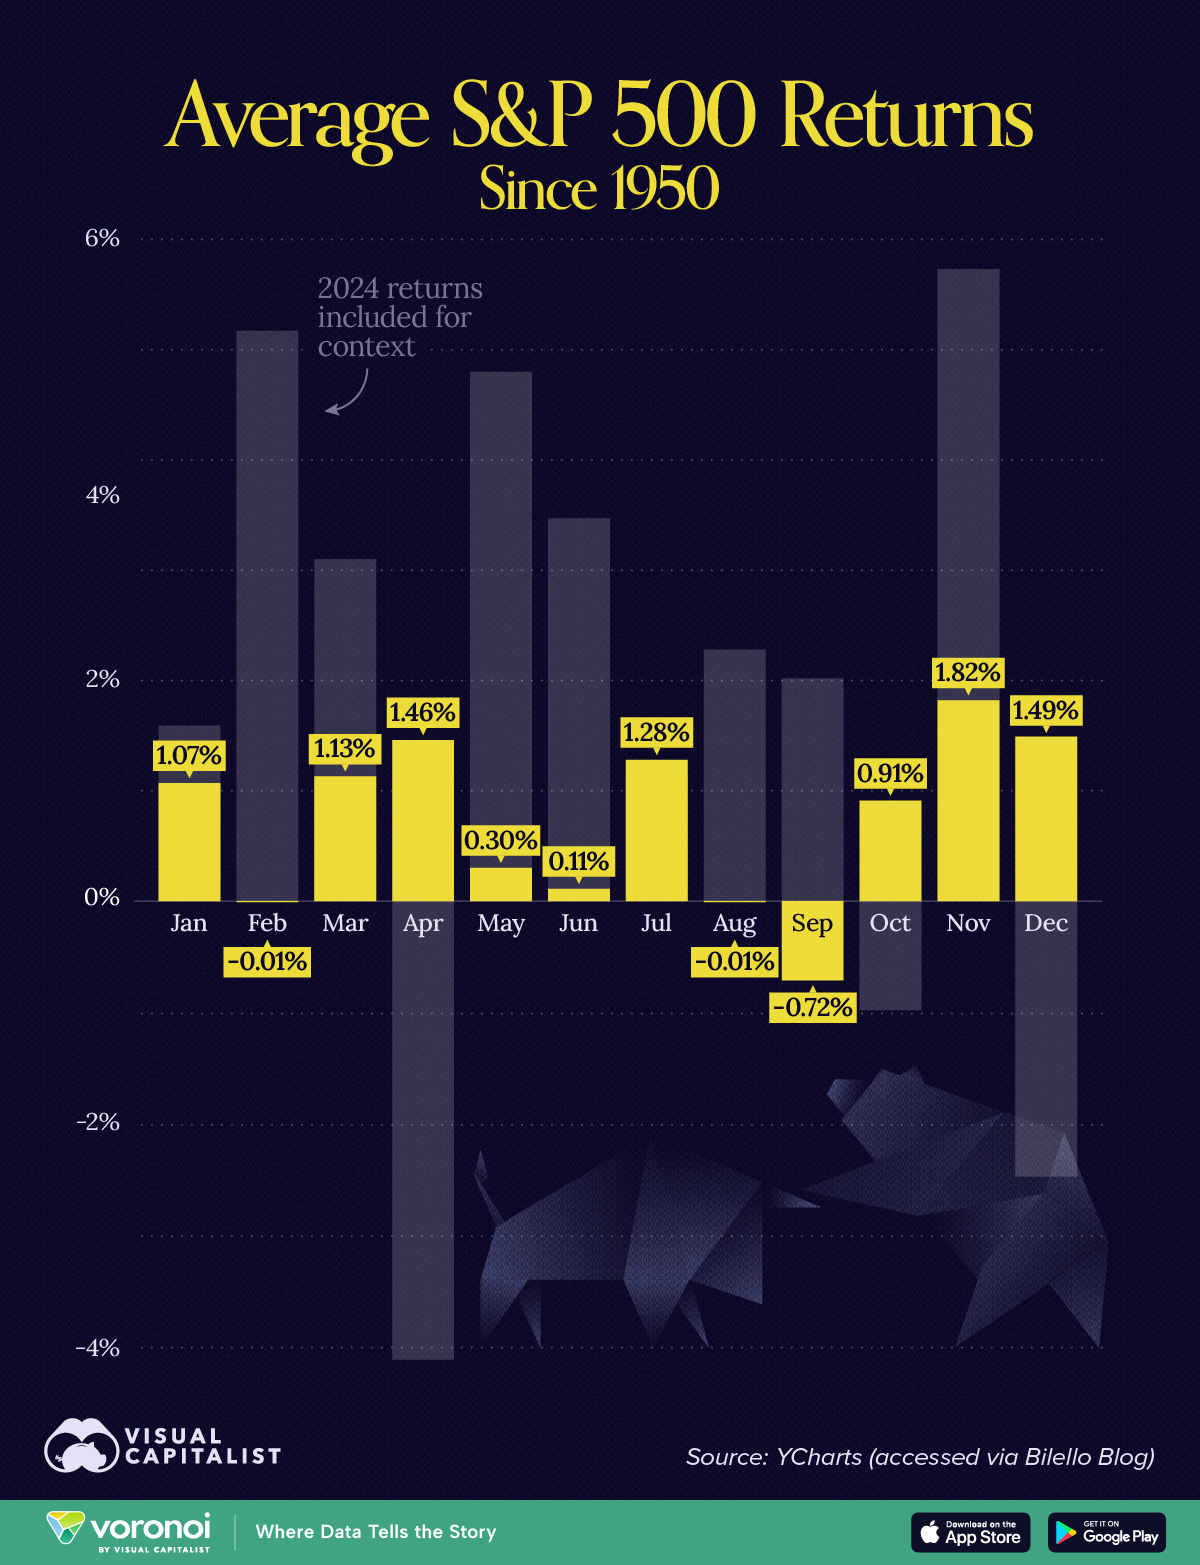
Helping deliver that performance was the better-than-anticipated market environment. Even though the market traded off this week, its performance September to date has bucked the typical move lower.
We attribute that to several factors, including positive investor conference commentary, multiple confirmation points for AI and data center demand, the Fed penciling in one more rate cut this year than the market expected, and both the domestic economy and the consumer performing better than expected. Those same factors led the S&P 500 and the Nasdaq Composite to venture into overbought conditions based on their relative strength index (RSI) levels, but both have since retreated from that condition.
We continue to think that for the market to power ahead in a sustained fashion from where it is today, we will need to see 2H 2025 and 2026 consensus EPS expectations for the S&P 500 move higher. That means the upcoming September quarter earnings season will be a critical time for us as we gauge that potential. With the pace of September quarter earnings not getting into the swing of things until October 14, we will continue to mine the earnings reports we get between now and then, connecting the dots back to the Portfolio along the way.
Also helping set the stage for that earnings season will be what the upcoming September data tells us. That includes not only key September data and what it says about key parts of the economy, but also revenue reports from Taiwan Semiconductor (TSM) , Foxconn and the like.
In most instances, the combination of those items along with those from the last few months would help prepare us for what’s ahead. This time around, however, we also face a potential government shutdown, which could throw a wrench into things, depending on whether it happens and, if so, for how long. In "The Coming Week" section below, we game out a few scenarios that we’ll be following as we move closer to next week’s deadline.
While a potential shutdown may add another ball in the air that we have to watch, we’ve been there before and we know what to do. By that, we mean continuing to follow the data and keeping one eye on the fundamentals and technicals for the market and the Portfolio, with our other eye on opportunities to pick up shares of quality companies benefitting from multi-year tailwinds, poised to deliver superior earnings growth, whose shares are trading at favorable risk-to-reward tradeoffs. In other words, it will be business as usual for us here at the Portfolio, following the same game plan that has allowed us to extend its year-to-date gains as we’ve moved through the current quarter.
Enjoy your weekend, and we’ll see you back here, bright and early on Monday.
Catching Up on the Portfolio in September
Following a string of week-over-week gains since early August, which took the Portfolio’s year-to-date gain to more than 12% from roughly 6% on August 1, we lost a wee bit of ground week over week. As we discussed above, that means we followed the S&P 500 and the Nasdaq Composite lower week over week. But for a month that is typically a challenging one for the markets, September 2025 has so far been a very good one for us.
Powering the Portfolio’s gains were outsized moves in the shares of Marvell (MRVL) , Alphabet (GOOGL) , Palantir (PLTR) and Apple (AAPL) . Other notable performers included our shares of Bank of America (BAC) , American Express (AXP) , Eaton (ETN) , Morgan Stanley (MS) , Universal Display (OLED) , Qualcomm (QCOM) , TJX Companies (TJX) and Vulcan Materials (VMC) , each of which is tracking ahead of the S&P 500 September to date.
Of course, we have to acknowledge that those gains were mitigated by the modest declines in Amazon (AMZN) , Axon (AXON) and Waste Management (WM) , but the real drag was from Dutch Bros (BROS) .
With two trading days left in the current quarter, the Portfolio has edged out the S&P 500 so far in September, narrowing the modest year-to-date gap between the two at the end of August. While we made several moves in September, we can trace the Portfolio’s improved performance during the month so far to those moves, but also the ones we made in late July and August. Those pre-September actions include adding to our holdings in the First Trust Nasdaq Cybersecurity ETF (CIBR) , American Express, ServiceNow (NOW) , SoRu Capital (SSSS) , Waste Management, Palantir and Axon.
So far this month, we picked up additional shares of Marvell and Palantir on September 3. We added to our holdings in Dutch Bros and Universal Display on September 18, and started our newest position in Two-rated Welltower (WELL) the same day. In the back half of the month, we scooped up more shares of Waste Management, and this week we did the same with Axon. We funded those buys through a combination of existing cash on hand, which stood at 10.35% of the Portfolio’s assets at the end of August, and some very profitable profit taking in the shares of Alphabet and Morgan Stanley. Moving through the month, we also raised our price targets on MS and GOOGL shares, as well as those for Apple, Bank of America and Palantir shares.
As we head for the door in the month of September, the Portfolio’s cash position stands near 8.5%, and we have 26 positions on hand. Upcoming dividend payments include those from Meta (META) , Universal Display and Nvidia (NVDA) next week, followed by ones from Marvell, American Express, TJX Companies (TJX) and Microsoft (MSFT) later in the December quarter. As more of our holdings announce upcoming dividend details, we’ll be sure to share them with you. And as those payments are received, we’ll alert you to the impact on the Portfolio’s cash position.
When it makes sense, we will continue to harvest gains in the Portfolio. We will prudently redistribute those winnings into well-positioned companies with favorable or better risk-to-reward profiles as we move into one of the seasonally strongest times of the year for the market.
This Week's Portfolio Videos
We cover a lot of ground during the week in our Daily Rundowns. If you happened to miss one or more of them, here are some helpful links:
Monday, September 22: Revisiting Our Apple Price Target After iPhone Update
Tuesday, September 23: Flash PMI Supports Fed’s Dovish Outlook
Wednesday, September 24: Stocks & Markets Podcast - Overbought and Staying That Way?
This Month’s Podcasts and Signals
Big discussions and insights are had during TheStreet Stocks & Markets Podcast, and in Signals, we share the latest news for the Pro Portfolio’s strategies. Here are some quick links to those conversations conducted over the last several weeks:
September 4: Frothy Valuations and Focusing on the Longer-Term With Ed Maguire
September 6: AI Is Reshaping Hiring, Swarms Come to Drone Warfare, and Other Investing Signals
September 10: Rate Cut Reaction, Healthcare Stocks, and Jaguar's Reboot
September 13: Koreans Turn to Ralph Lauren; AI for the Elderly & More Investing News
September 25: Stocks & Markets Podcast - Overbought and Staying That Way?
Some helpful links if you prefer to catch the podcast on the go, in the car or wherever. Be sure to give it a like or thumbs up and leave a review if you’re so inclined. We’d appreciate it.
Key Global Economic Readings
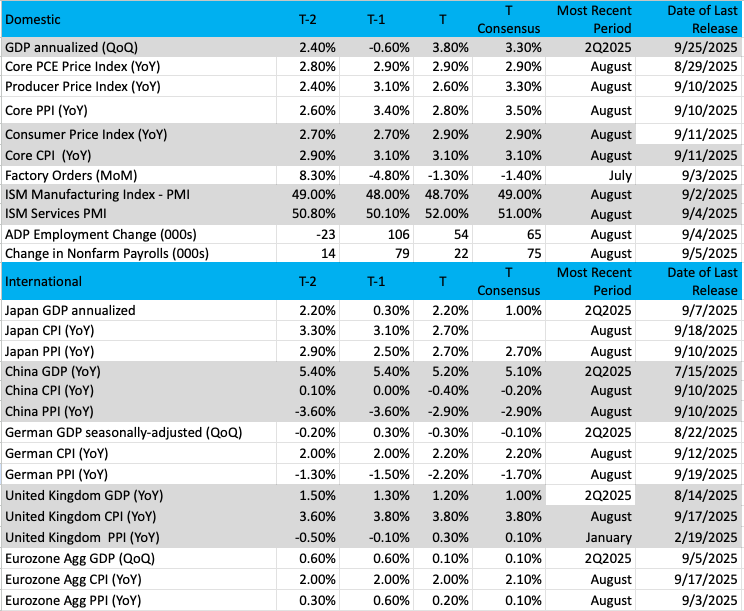
(Note: T is the most recent period, T-1 is the prior period's reading, and T-2 is two periods back, the intent being to illustrate any trends.)
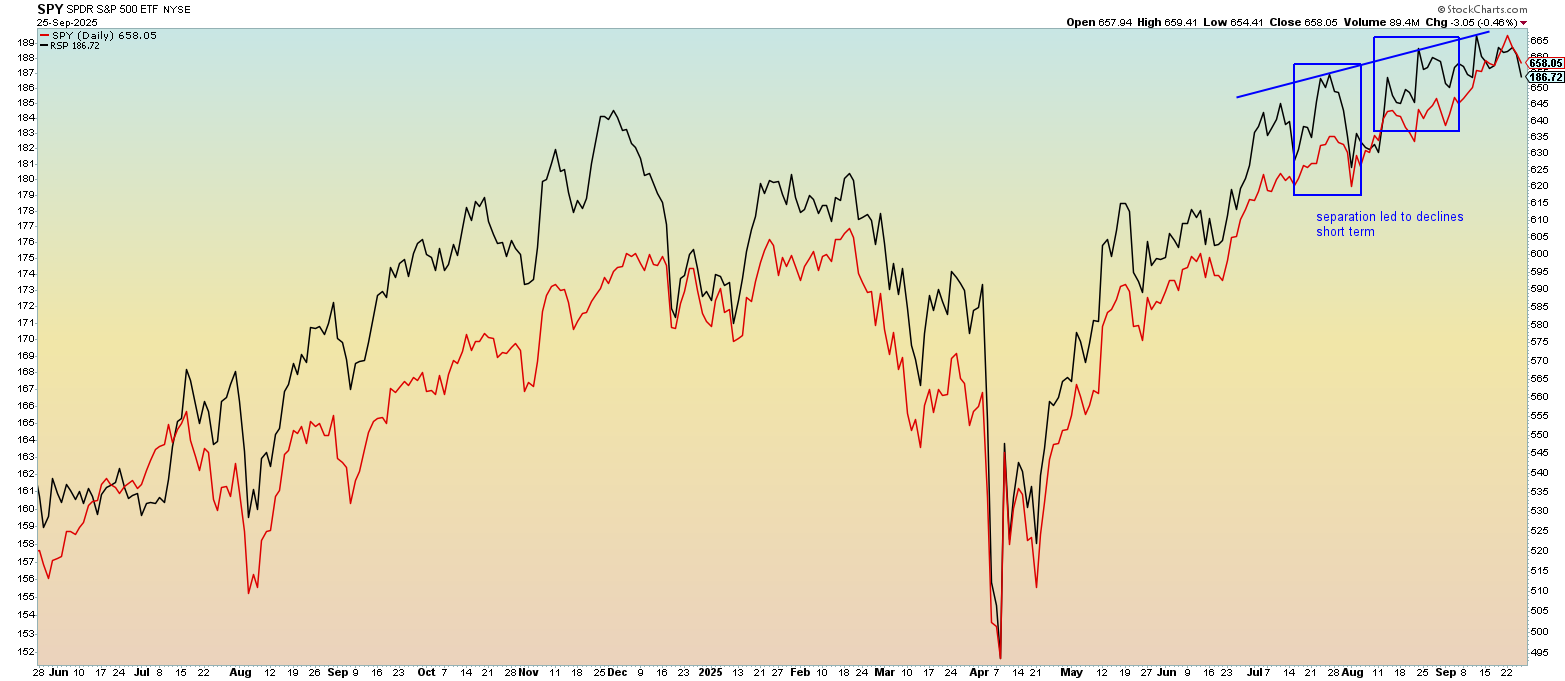
Chart of the Week: S&P 500 Market Cap Weighted vs. Equal Cap Weighting
It’s the end of the month, and we bring you our monthly look at the SPY versus RSP. As a refresher, the SPY ETF covers 500 stocks in the equity universe and calculates a value based on market capitalization weighting. The biggest and best stocks have the largest influence on the SPY (think Magnificent Seven names). The RSP, however, is what is known as an equal-weighted index. While the same 500 stocks are contained in the RSP as in the SPY, each member has an equal vote in determining the price of the RSP ETF. So, Robin Hood Markets (HOOD) has the same weighting in the RSP as Apple (AAPL) , though their market caps are quite different.
The reason we analyze the SPY against the RSP is to see where the money is flowing. When the SPY is outperforming, we can hypothesize that big money is flowing towards the higher-weighted names. This conclusion is accurate, as we see in the chart, when the black line is far above the red line, the biggest names (like those Magnificent Seven) are performing the best.
When the RSP is performing well, we can say there is broad and even distribution across the market. This situation is actually very healthy for markets and the economy in general, as evidenced by the fact that money stays in the market and is simply moved around to other areas of growth. If it’s not technology, it’s banking, or housing, or retail, etc.
As mentioned, when there is a wide separation of the SPY and RSP, it tends to eventually lead to a downfall of both ETFs. Recently, we witnessed some wide margins between the two ETFs, which have now led to a modest decline this week. Further, the SPY is performing worse than the RSP (down much more), which tells us that the top names in the SPY are going down at a much faster rate.
This is important information at the current time, telling us big money investors are distributing (selling) the big names for whatever reason (it doesn’t really matter why). If this bull market run continues, then buying the dip in these names into the end of the year will be the action to watch for. How long this divergence between RSP and SPY lasts is anyone’s guess, but when it turns, you want to be ready to buy.
Other charts we shared with you this week were:
Monday, September 22: S&P 500 - Bulls Have No Fear as Volatility Recedes
Monday, September 22: S&P 500: Welltower (WELL) - A Close Look at Our Newest Holding
Tuesday, September 23: Dutch Bros (BROS) - Can Dutch Bros Get Things Brewing?
Wednesday, September 24: Eaton Corp. (ETN) - Eaton Is Powering Up
Thursday, September 25: Costco (COST) - Here's How Costco Lines Up Before Earnings
The Week Ahead
We close out the last two days of September trading next week, which will bring a close to the current quarter. That means we will transition to October, and the final quarter of the year begins, which means we should start to receive September economic data points. We say “should” because some of those data points, like the September Employment Report, will hinge on whether we have a government shutdown… or not.
As of this Friday, Polymarket shows a 70% chance we have a government shutdown next week. There are several days to go until the September 30 deadline, and we will keep you abreast of meaningful developments. In the recent past, a short-term shutdown has been minor, but a protracted one, well, that could have greater implications for the economy and the market.
If we do get a government shutdown, because we have a Fed policy meeting that concludes on October 29, we would expect the market to lean that much further in the September data that is published. That includes next week’s September PMI reports from ISM and September jobs data from the likes of ADP and Challenger Grey. Indications are that we could see more mass firings via a reduction-in-force mechanism in the event of a government shutdown. If that were to happen, given the Fed’s greater focus on the employment market these days, that would likely increase the odds of two Fed rate cuts to come this year.
Continuing to game things out, if we avert a government shutdown and the data we get next week shows a sharp rebound in the number of jobs created in September and inflation pressures remain, that could present a Lucy-Charlie Brown football moment for the market for rate cut expectations. Adding to that possibility, following the economic data collected this week, the Atlanta Fed’s GDPNow model now pegs current quarter GDP at 3.9% while the New York Fed’s Nowcast model now puts GDP for the September quarter and the final quarter of the year both at 2.5%.
Subject to what happens in Washington, next week should also bring the next iteration of the monthly Construction Spending report. What that August data shows could give us a reason to revisit existing price targets for United Rentals (URI) , Vulcan Materials (VMC) and Eaton Corp (ETN) .
We'll keep watch on the data and its implications, so stay tuned.
Here's a closer look at the expected economic data coming at us next week:
U.S.
Monday, September 29
- Pending Home Sales – August (10:00 AM ET)
Tuesday, September 30
- S&P Case-Shiller Home Price Index – July (9:00 AM ET)
- FHFA Housing Price Index – July (9:00 AM ET)
- Consumer Confidence – September (10:00 AM ET)
Wednesday, October 1
- MBA Mortgage Applications Index – Weekly (7:00 AM ET)
- ADP Employment Change Report – September (8:15 AM ET)
- S&P Global Final Manufacturing PMI – September (9:45 AM ET)
- ISM Manufacturing PMI – September (10:00 AM ET)
- Construction Spending – August (10:00 AM ET)
- EIA Crude Oil Inventories – Weekly (10:30 AM ET)
Thursday, October 2
- Challenger Job Cuts – September (7:30 AM ET)
- Initial & Continuing Jobless Claims – Weekly (8:30 AM ET)
- Factory Orders – August (10:00 AM ET)
- EIA Natural Gas Inventories – Weekly (10:30 AM ET)
Friday, October 3
- Employment Report – September (8:30 AM ET)
- S&P Global Final Services PMI – September (9:45 AM ET)
- ISM Services PMI – September (10:00 AM ET)
International
Monday, September 29
- Japan: Leading Economic Index (Final) – July
- U.K.: Bank of England Consumer Credit – August
- Eurozone: Economic Sentiment & Consumer Confidence - September
Tuesday, September 30
- Japan: Industrial Production, Retail Sales – August
- China: NBS Manufacturing & Non-Manufacturing PMI – September
Wednesday, October 1
- Eurozone: HCOB Final Manufacturing PMI – September
- U.K.: S&P Global Final Manufacturing PMI – September
- Eurozone: Flash Inflation Rate - September
Thursday, October 2
- Japan: Consumer Confidence – September
- Eurozone: Unemployment Rate - August
Friday, October 3
- Japan: S&P Global Final Services PMI – September
- Eurozone: HCOB Final Services PMI – September
- U.K.: S&P Global Final Services PMI - September
As the vast majority of companies start to roll up their books in preparation for reporting in the coming weeks, next week we have another modest trickle of quarterly reports to wade through. We will do what we have done in recent weeks, continue to gather clues and connect the dots back to the Portfolio based on what is said by the likes of Jefferies (JEF), United Natural Foods (UNFI) , Nike (NKE) and ConAgra (CAG) about market demand for their products, inflation pressures and pricing decisions.
As we close out September and the current quarter, we will also be on watch for earnings pre-announcements. To the extent we get them, good or bad, we will tie them back to the Portfolio and its holdings, updating our investment mosaic as we do so.
Here's a closer look at the earnings reports coming at us next week:
Monday, September 29
- Open: Carnival (CCL)
- Close: Jefferies (JEF), Progress Software (PRGS), Vail Resorts (MTN)
Tuesday, September 30
- Open: Lamb Weston (LW), Paychex (PAYX), United Natural Foods (UNFI)
- Close: Nike (NKE)
Wednesday, October 1
- Open: Acuity (AYI), Cal-Maine Foods (CALM), Conagra (CAG)
Portfolio Investor Resource Guide
- Economic Data: Here's a List of Links to the Key Economic Data We Closely Watch
- Investing Terminology: 16 Key Terms Club Members Should Know
- 10-Ks: Want to Know About a Stock? Read the Company's Reports
- 10-Qs: Unlock the Numbers and Key Information Behind Your Stock With the 10-Q
- Income Statement -Our Cheat Sheet to Understanding This Financial Document
- Balance Sheet, Cash Flow Statements, and Dividends - How to Know If a Company Is Off-Kilter? Read Its Balance Sheet
- Valuation Metrics - Everyone Wants a Value. Here's How Investors Can Find
- Thematic Investing 101 Webinar
The Portfolio Ratings System
1 - Buy Now (BN): Stocks that look compelling to buy right now.
2 - Stockpile (SP): Positions we would add to on pullbacks or a successful test of technical support levels.
3 - Holding Pattern (HP): Stocks we are holding as we wait for a fresh catalyst to make our next move.
4 - Sell (S): Positions we intend to exit.
ONES
Amazon AMZN; $219.78; 881 shares; 3.50%; Sector: Consumer Discretionary
UPDATE: After being a modest drag on the Portfolio during August, shares of Amazon (AMZN) continued to move lower in September, leaving them down ever so slightly on a quarter-to-date basis. Despite that move lower that leaves the shares a modest drag on the Portfolio’s year-to-date performance, we are entering the seasonally strongest time of the year for the company’s retail-facing business, one that should benefit from its upcoming Prime Big Deal Days on October 7 to 8. The event is Amazon's fourth annual October sales event, providing Prime members with early holiday shopping deals, and it has become the unofficial start to the holiday shopping season. With consumers increasingly looking to stretch their spending dollars, digital shopping and Amazon are poised to benefit. With Amazon continuing to expand same-day delivery to more areas across the U.S. by year end, we see further share gains ahead. We also see Amazon continuing to benefit from AI and cloud adoption, as well as continued share gains for its high-margin digital advertising business. AWS continues to be capacity constrained, and there is a degree of lumpiness in the business from quarter to quarter. Much like we’ve seen with Microsoft (MSFT) , as Amazon adds cloud and data center capacity, we should see that business re-accelerate in the coming quarters and margins improve. Boosting our confidence in that was the continued increase in backlog levels for AWS to $195 billion exiting June, which was up 25% year over year. We’d also note that there was a re-acceleration in backlog growth compared to 20% in the March quarter. Given the influence of AWS on Amazon’s overall profitability, that improvement should drive overall margin improvement in the coming quarters. Longer-term, the ongoing shift in enterprise spending in IT toward cloud from on-premise spending, which currently accounts for the bulk of IT spending, bodes well for AWS, especially as AI adoption accelerates. It’s also fair to say that Amazon’s margin potential is greater this time around as its near-term investments bear fruit. We can make that argument given ongoing cost reduction efforts, but also the growing influence of its high-margin advertising business, which generated $15.7 billion in revenue during Q2 2025, up just shy of 50% over the last two years. More recent data show Amazon winning streaming video share, a positive for its advertising revenue stream. With more than 18% upside to our $260 target, we continue to rate AMZN shares a One, but if they move past $235, barring a catalyst to lift our price target, we may need to revisit our One rating.
September Month to Date Price Change: -4.0%; Yield: 0.0%
INVESTMENT THESIS: We believe the upside will result from Amazon's continued e-commerce dominance, AWS's continued leadership in the public cloud space and the ongoing growth of the company's advertising revenue stream, which feeds off Amazon's eCommerce business. Additionally, we think profitability will continue to improve as AWS and advertising account for a larger portion of total sales, as both these segments sport higher margins than the eCommerce operation. While we believe the increasing share of the revenue from these higher margin businesses will be key to driving profitability longer-term, we think margins on eCommerce stand to improve as the company's infrastructure is further built out and economies of scale further kick in. The embedded call option is that management is always looking to enter a new space and generate new revenue streams.
Target Price: Reiterate $260; Rating: One
Panic Point: $190
RISKS: High valuation exposes the stock to volatile swings, e-commerce has exposure to slower consumer spending and competition, management is not afraid to invest heavily, potential headwinds resulting from new e-commerce regulation in India, and management is not scared to invest aggressively for growth, which can at times cause volatile reactions as near-term concerns arise relating to the impact on margins.
Axon Enterprise AXON; $708.84; 283 shares; 3.63%; Sector: Aerospace & Defense
UPDATE: Shares of Axon (AXON) slumped hard near the end of September, which led the shares to close down more than 10% quarter to date. As we explained in our alert discussing that drop in the shares, the move lower was a combination of the higher beta associated with Axon’s shares, but more likely a knee-jerk reaction to competitor Motorola Solutions (MSI) receiving a fresh Neutral rating from Piper Sandler. In the alert, we discussed the expected 20% EPS CAGR over the 2024 to 2027 period and robust growth in Axon’s future contracted bookings, annual recurring revenue, and percentage of revenue from subscription plans. For us, the Axon story continues to be one centered on the mix shift toward the higher-margin, recurring revenue services business, as well as continued growth for its hardware business in federal, corporate and international markets. That led us to use the late September swoon to pick up more shares at $718.26. In H2 2025, we should see AI take a larger role in driving that shift, and it should also foster further growth in several key metrics that we track for the company. To that end, in late September, Axon entered into a definitive agreement to acquire Prepared, an AI-powered emergency communications platform that turns 911 calls into actionable intelligence and enables faster response. Prepared's technology synthesizes call audio, text, video, GPS and real-time translation into a single view, supporting more than 1,000 agencies across 49 states. We see the acquisition not only accelerating Axon’s AI initiatives but also expanding its reach in the public safety market.
September Month to Date Price Change: -5.1%; Yield: 0.0%
INVESTMENT THESIS: Axon Enterprise develops, manufactures and sells conducted energy devices and cloud-based digital evidence management software designed for use by law enforcement, corrections, military forces, private security personnel and private individuals for personal defense. The company operates in two segments: Taser (recently renamed Connected Devices) and Software & Sensors (recently renamed Software & Services). Taser develops and sells CEDs used for protecting users and virtual reality training. Software & Sensors manufactures fully integrated hardware and cloud-based software solutions such as body cameras, automated license plate reading, and digital evidence management systems. Axon delivers its products worldwide and gets most of its revenue from the United States. According to Mordor Intelligence, the wearable and body-worn cameras market on its own was valued at $1.62 billion in 2020 and is expected to reach $424.63 billion by 2026. Public safety organizations are increasingly adopting cloud solutions, leading to significant spending in this area. The digital spending in public safety is projected to reach $201 billion by 2027.
Target Price: Reiterate $860; Rating: One
Panic Point: $635
RISKS: Manufacturing and supply chain, competitive factors, government regulation, and technology change.
Costco Wholesale COST; $915.95; 218 shares; 3.61%; Sector: Consumer Staples
UPDATE: Despite the continued number of data points that indicate Costco (COST) continues to win consumer wallet share, COST shares remained a drag on the Portfolio’s September quarter performance. Even the company’s consensus-topping August quarter earnings report failed to spark the shares, but what we saw inside that report keeps us bullish. We’d point out a few things that the headline metrics don’t really show. First, if we look at the number of paid memberships to warehouse locations over the last several quarters, we see that the ratio is moving higher. Second, analyzing total sales to the number of paid memberships also shows an acceleration over the last few quarters. These two items tell us that as Costco continues to expand its footprint, it is not only winning new members, but in the current environment, those members are spending more at Costco. Costco also looks to accelerate that footprint expansion by adding 30 net new locations over the coming 12 months, a tad faster than the 24 it added over the last year. We see that effort continuing to drive membership higher, which will grow the membership fee revenue stream and increase Costco’s operating income along the way. Costco’s membership business model is a key differentiator between it and other retailers, very much the way that model differentiates American Express (AXP) from other credit card companies. The recurring nature of that business model, the step function higher in the membership fee revenue stream as more warehouses are added, and sky-high renewal rates will see us remain COST shareholders. Despite the market’s reaction to Costco’s earnings report, for us, the company’s story remains on track. We are maintaining our $1,200 price target on COST and our One rating, but based on those incoming reports, we may opt to adjust that target. In our view, there is little question that the pullback we’ve seen in COST shares since their June high near $1,055 is a nice place to pick up shares heading into what tends to be the biggest quarter of the year for the company.
September Month to Date Price Change: -2.9%; Yield: 0.57%
INVESTMENT THESIS: We like Costco's long-term prospects, driven by a club-based operating model that focuses on volumes, not margins, and therefore offers its customers a value proposition of everyday low prices. The strength of this model has created an incredibly loyal customer base with low churn and continued share gains in both brick-and-mortar and e-commerce. This is a global concept, evidenced by the strength of sales both in the U.S. and abroad, which includes an emerging China opportunity. We see the company's membership model as a key differentiator versus other retailers, and its plans to open additional warehouse locations in the coming quarters should drive retail volumes and the higher-margin membership fee income as well. We also appreciate management's approach to capital returns and their willingness to return cash.
Target Price: Reiterate $1,200; Rating: One
Panic Point: $925
RISKS: Inability to pass through higher costs, fuel prices, weaker consumer and membership churn.
Eaton Corp. ETN; $365.58; 593 shares; 3.92%; Sector: Industrials
UPDATE: Coming off a more than 40% rise in Eaton (ETN) during the April to July period, the shares gave back some of those gains and then some in August. Given our price target and the vibrant demand outlook, we reiterated our One rating, and subsequent confirmation points led ETN shares to rebound in September, landing them in a positive position on a quarter-to-date basis. As we see it, the outlook for data center infrastructure and the larger demand for electrical capacity remains shockingly strong. Companies will spend $375 billion globally in 2025 on AI infrastructure, investment bank UBS estimates. That is projected to rise to $500 billion next year. Brookfield Asset Management estimates that AI infrastructure will sop up $7 trillion over the next 10 years. Deloitte sees U.S. power sector investments reaching $1.4 trillion between 2025 and 2030. This six-year outlay is equivalent to the total capital expenditure of the U.S. power sector over the preceding 12 years, underscoring the challenge and the opportunity that lies ahead. The ICF projects significant increases in U.S. electricity demand over the next 25 years, with demand rising 25% by 2030 and 78% by 2050. In the near term, the U.S. Energy Information Administration (EIA) has raised its projections for electricity consumption in the country, citing a spike in power demand from commercial sectors — especially data centers — as a key driver. In its latest update of the Short-Term Energy Outlook (STEO), the EIA said it expects total U.S. electricity demand to rise from 4,097 billion kilowatt-hours (kWh) last year to 4,193 billion kWh in 2025, and 4,283 billion kWh in 2026. As we see the mix shift move toward AI data centers, we should see Eaton’s dollar per megawatt content rise, given greater power density, larger volumes of electrical equipment, but also greater cooling requirements. In our view, that is the driving story behind the opportunity in Eaton’s shares and one we aim to capture as shareholders. A more dovish Fed policy could be an added tailwind in the coming quarters as it would reduce project hurdle rates, fostering incremental construction activity. We recognize there will be some modest margin pressure, largely on the company’s Vehicle segment (10% of revenue), due to tariffs, but we will continue to evaluate that as trade deals are announced. Offsetting that is improving demand for the aerospace market, which accounts for 15% of Eaton’s revenue stream.
September Month to Date Price Change: -4.7%; Yield: 1.14%
INVESTMENT THESIS: Eaton is an intelligent power management company that makes products for data center, utilities, industrial, commercial, machine building, residential, aerospace and mobility markets. That business is positioned to capitalize on the mega trends of electrification, energy transition and digitalization. We see Eaton helping address the power pain point created by data center, EV charging infrastructure, and other drivers of electricity demand. Research estimates that data center power demand will grow 160% by 2030, accounting for 3% to 4% of global power, up from 1% to 2% today. Data centers will use 8% of U.S. power by 2030, compared with 3% in 2022.
Target Price: Reiterate $420; Rating: One
Panic Point: $325
RISKS: Raw material costs, labor costs, end market volatility, and government legislation.
Marvell Technology MRVL; $83.17; 2,890 shares; 4.35%; Sector: Technology
UPDATE: After falling more than 20% in August, Marvell (MRVL) shares rallied back in September, making them the Portfolio’s biggest gainer in September. That move resulted in MRVL shares becoming a positive contributor to the Portfolio’s quarter-to-date performance. We continue to receive data points supporting rising AI and data center capital spending, which bodes well for Marvell, as does the expected ramp later this year in the company’s proprietary AI silicon solutions. Meanwhile, rising AI adoption is expected to drive incremental capital spending levels, benefiting Marvell’s Enterprise Networking and Carrier Infrastructure Segments. During Ciena’s (CIEN) early September earnings call, management reaffirmed our thinking, sharing “ongoing accelerated customer demand as the network becomes fundamental to the underpinning, growth, and monetization of AI." Those and other data points helped lift Marvell’s share price, and that move accelerated when the company announced not only a new $5 billion share repurchase program, but that it entered an accelerated share repurchase agreement to repurchase $1 billion of its common stock. We see that as a vote of confidence by the company in its prospects laid out at its June custom silicon AI event, and it reinforces our bullish stance on this One-rated holding. That position was reinforced by the increased outlook for AI server unit growth this year issued by Micron (MU) this week, as well as Jabil’s (JBL) outlook for its Cloud & Data Center Infrastructure segment over the coming 12 months. Topping things off this week, we learned Marvell’s chairman and chief executive officer, president and COO, chief financial officer, and president of Data Center Group bought 27,200 shares combined worth more than $2.1 million. That’s a nice vote of confidence in this One rated stock. The next known catalyst for MRVL shares will be September revenue reports from Taiwan Semiconductor (TSM) and Foxconn. We will also be keeping a lookout for fresh data points about data center spending and AI adoption.
September Month to Date Price Change: -32.3%; Yield: 0.29%
INVESTMENT THESIS: Marvell is a fabless supplier of high-performance standard and semi-custom infrastructure semiconductor solutions. These solutions power the data economy, enabling the data center, carrier infrastructure, enterprise networking, consumer, and automotive/industrial end markets. With roughly 75% to 80% of Marvell's revenue stream tied to digital infrastructure, we see it continuing to benefit from rising content consumption and creation. Pointing to that rising demand that necessitates network densification and the build of digital infrastructure, Ericsson sees global monthly average usage per smartphone reach 46 gigabytes (GB) by the end of 2028 versus 19 GB in 2023 and 15 GB in 2022.
Target Price: Reiterate $115; Rating: One
Panic Point: $60
RISKS: Technology risk, customer risk, competition risk, reliance on manufacturing partners, and supply chain constraints.
Nvidia Corp. NVDA; $178.19; 1,255 shares; 4.04%; Sector: Technology
UPDATE: Shares of Nvidia (NVDA) recovered some of the ground they lost in August during September, leaving them up low double digits as we near the end of the current quarter. During the month, we shared multiple data points and signals that pointed to rising AI adoption as well as rising AI infrastructure spending. We also know capital spending on AI and data center infrastructure is moving higher in H2 2025 compared to H1 2025, with another leg up set for 2026 and 2027. Research firm Dell’Oro Group forecasts a compound annual growth rate (CAGR) of 21% worldwide, with capex hitting $1.2 trillion by 2029 — that's $200 billion more than it forecasted in February. Backstopping that outlook was Oracle’s (ORCL) massive RPO increase that it shared on September 9. To that, we can add comments this week from Open AI CEO Sam Altman, which reaffirmed the company’s $850 billion expansion plan, sharing that even that pace will “look slow” given surging demand. For context, that is nearly half of the $2 trillion in global AI infrastructure forecasted by HSBC and suggests that forecast is likely to prove to be conservative. It’s that outlook that keeps us bullish on NVDA shares. Because the Pro Portfolio has a sizable position in Nvidia, we are not likely to add to it. We’ll look for favorable risk-to-reward entry points for members who are underweight the shares. Upcoming data points we’ll be watching with an eye toward our current NVDA price target are September revenue reports from Taiwan Semiconductor and Foxconn, as well as capital spending comments from Big Tech during the September quarter earnings season.
September Month to Date Price Change: 2.3%; Yield: 0.02%
INVESTMENT THESIS: Nvidia is well-positioned to benefit from ramping AI and data center spending. The company pioneered accelerated computing to help solve the most challenging computational problems. Nvidia is now a full-stack computing infrastructure company with data-center-scale offerings that are reshaping the industry. The company's full stack includes the foundational CUDA programming model that runs on all Nvidia GPUs, as well as hundreds of domain-specific software libraries, software development kits, or SDKs, and Application Programming Interfaces, or APIs. This deep and broad software stack accelerates the performance and eases the deployment of Nvidia accelerated computing for computationally intensive workloads such as artificial intelligence, model training and inference, data analytics, scientific computing, and 3D graphics, with vertical-specific optimizations to address industries ranging from healthcare and telecom to automotive and manufacturing. Nvidia reports in two business segments: Compute & Networking and Graphics. The Compute & Networking segment (78% of revenue, 85% of operating income) is comprised of Data Center accelerated computing platforms and end-to-end networking platforms, including Quantum for InfiniBand and Spectrum for Ethernet; NVIDIA DRIVE automated-driving platform and automotive development agreements; Jetson robotics and other embedded platforms; Nvidia AI Enterprise and other software; and DGX Cloud software and services. The Graphics segment (22% of revenue, 15% of operating income) includes GeForce GPUs for gaming and PCs, the GeForce NOW game streaming service and related infrastructure; Quadro/NVIDIA RTX GPUs for enterprise workstation graphics; virtual GPU, or vGPU, software for cloud-based visual and virtual computing; automotive platforms for infotainment systems; and Omniverse Enterprise software for building and operating metaverse and 3D internet applications.
Target Price: $200; Rating One
Panic Point: $140
RISKS: Market and interest rate risk, credit risk, country risk and operational risk, including cybersecurity.
Palantir Technologies PLTR; $177.57; 1,100 shares; 3.53%; Sector: Financial Services
UPDATE: Coming off a very strong first seven months of 2025, Palantir (PLTR) shares took a breather in August, but resumed their upward trajectory in September. That upswing led PLTR shares to gain more than 25% quarter to date. Fortunately, the Portfolio added to its PLTR position in August and early September at $154.61 and $160.63, respectively. In late September, we once again lifted our PLTR price target to $205 following news that the U.K. military would buy more than $1 billion in software and services over the coming five years. This will be a nice boost to the company’s remaining performance obligations (RPOs) when it reports its current quarter, extending its multi-year runway. At the time, we noted that across the more than 26 price targets published by various Wall Street firms, the vast majority have not been updated since early August. This suggests we could see some catch-up activity in the coming weeks. Increasing that likelihood, Boeing (BA) announced that it will work with Palantir to bring artificial intelligence into its defense operations, spanning both military programs and manufacturing sites. The companies said Palantir will also contribute AI support for several classified and proprietary defense projects tied to sensitive military missions. We see that supporting a nice sequential improvement in Palantir’s bookings and remaining performance obligation metrics when it reports its next quarter. As PLTR notches additional wins, we will revisit our price target as needed.
September Month to Date Price Change: 13.3%; Yield: 0.0%
INVESTMENT THESIS: Palantir Technologies specializes in big data analytics and builds software platforms that help organizations integrate, analyze and make sense of vast amounts of data for both commercial and government clients. While much has been made about the company’s exposure to the federal government, its software is used across 90 industries, and the larger global government sector accounted for 55% of revenue last year. The balance was from the commercial sector. Exiting Q2 2025, Palantir’s Commercial remaining deal value (RDV) stood at $2.8 billion, up from $1.79 billion exiting 2024. We will continue to monitor Palantir’s RDV and deferred revenue metrics, but in our view, key items to watch will be the continued diversification of its customer base across industries and increasing revenue per customer. Both have made considerable progress in H1 2025, with Commercial revenue reaching 58% of total revenue in Q2 2025. Because we are still in the relatively early innings of AI adoption, we are inclined to be long-term owners of PLTR shares.
Target Price: $205; Rating: One
Panic Point: $145
RISKS: Economic and IT budget spending risk, technology risk, competition and competitive pressures and customer acquisition risk.
Qualcomm Inc. QCOM; $169.20; 1,220 shares; 3.73%; Sector: Technology
UPDATE: Shares of Qualcomm (QCOM) were a stronger performer for the Portfolio in August, and that continued in September. The back-to-back climb in the shares led them to expand their year-to-date move higher to roughly 10%. Qualcomm continues to target share gains in the Android smartphone market, but the teardown analysis of Apple’s iPhone 17, iPhone 17 Pro and iPhone 17 Pro Max models confirms Qualcomm content. That suggests the expected fall off in iPhone business may not be quite as fast as some of the doomsayers predicted. Meanwhile, updated guidance from Micron sees stronger demand in 2H 2025 for both the smartphone and PC markets. Our perspective has been that as Qualcomm makes progress with its diversification strategy into the AI PC, automotive and IoT markets, Wall Street would need to rethink how it values the shares. In late September, that strategy received a nice boost following the revelation at Qualcomm’s Snapdragon Summit that it will partner with Google (GOOGL) to leverage the Android ecosystem and Gemini to build a common platform across smartphones, PCs, auto and IoT devices. While this is certainly a positive development for Qualcomm, let’s remember the two are working on this, and that means formal products have yet to be announced. Given CEO Cristiano Amon’s comments that he’s “seen it,” this suggests we are likely to hear more about this effort in the coming months. While Google could hold its own event to showcase these efforts in the coming months, the annual CES trade show held in early January is a hotbed of new product announcements. That would make quite a splash. In terms of our QCOM price target, this fuels our thinking that Wall Street will need to eventually rethink how it values the shares. The accelerated diversification strategy will lead us to do the same as more details are revealed. With QCOM shares approaching our $180 target, our plan is to maintain that target while we wait for the September revenue reports from Taiwan Semiconductor and Foxconn. Should those show a strong seasonal ramp in smartphone production, we will likely need to raise our QCOM target.
September Month to Date Price Change: 5.3%; Yield: 2.10%
INVESTMENT THESIS: Qualcomm focuses on foundational technologies for the wireless industry, including 3G (third generation), 4G (fourth generation) and 5G (fifth generation) wireless technologies and processor technologies, including high-performance, low-power computing and on-device artificial intelligence technologies. As a connected processor company, its technology roadmap aims to enable the connected intelligent edge (the next generation of smart devices) across industries and applications beyond handsets, including automotive and the Internet of Things (IoT). Qualcomm has three reportable segments: QCT (Qualcomm CDMA Technologies) semiconductor business, which develops and supplies integrated circuits and system software based on 3G/4G/5G and other technologies for use in mobile devices; automotive systems for connectivity, digital cockpit, and ADAS/AD; and IoT, including consumer electronic devices, industrial devices, and edge networking products. QCT accounts for 80% to 85% of revenue. The QTL (Qualcomm Technology Licensing) licensing business grants licenses or otherwise provides rights to use portions of the company's intellectual property portfolio, which includes certain patent rights essential to and/or useful in the manufacture and sale of certain wireless products. QTL accounts for about 15% of Qualcomm's revenue but contributes a greater portion of the company's operating income. Our focus on QCOM shares is revenue diversification as part of management's intended strategy to lessen its reliance on the smartphone market by tapping into the AI PC, IoT, and automotive chip markets. We see this unfolding over the next few years, which should lead Wall Street to revisit how it values the shares. It is that opportunity we aim to capture by owning the shares over the longer term.
Target Price: $180; Rating: One
Panic Point: $135
RISKS: Customer risk, technology advancement, competition risk, third-party supplier, and manufacturing partner risk.
ServiceNow NOW; $936.00; 215 shares; 3.64%; Sector: Technology
UPDATE: Shares of ServiceNow (NOW) moved lower in July and bottomed further in early August before embarking on a rebound over the last several weeks. Despite that recovery, NOW shares remained a drag on our quarter-to-date performance. Still, the rebound off the early August low made our decision to add additional NOW shares at $877.52 on August 18 a profitable one. During September, we heard from the likes of Ciena (CIEN) , HP Enterprise (HPE) and others about the impact rising AI adoption is having on their businesses. We see that as confirmation points for enterprise adoption, a nice tailwind for ServiceNow’s business, and our shares. Consulting firm West Monroe finds that more than 9 in 10 executives expect AI adoption to increase technology budgets in the coming year, with software as a major culprit. The firm’s survey found that nearly half of organizations saw licensing and subscription costs for renewals and new contracts increase by more than the industry average of 10%. That speaks to the pricing lift AI is having, and we see it helping nudge margins higher at ServiceNow as it becomes a larger part of the company’s mix. When ServiceNow reports its September quarter, we’ll be looking for nice sequential gains in both current remaining performance obligations (RPOs) and noncurrent RPOs. Exiting the June quarter, those figures stood at $10.92 billion and $13 billion. With AI adoption still in its relatively early innings and CIOs increasing their spending on AI, we will remain owners of NOW shares.
September Month to Date Price Change: 2.0%; Yield: 0.0%
INVESTMENT THESIS: The addition of ServiceNow adds exposure to the enterprise as it deploys AI-enabled solutions across its enterprise workflow platform. The company’s “Now Platform” is a cloud-based solution with embedded AI and machine learning (ML) capabilities that help unify and digitize workflows, driving productivity. At the heart of it, the company’s platform automates workflows across an entire enterprise by connecting disparate departments, systems and silos in a seamless way to unlock productivity. ServiceNow counts more than 8,100 global customers, including 85% of the Fortune 500, with 97% of its revenue from subscriptions that have notched a 98% renewal rate. During the March 2025 quarter, ServiceNow also announced plans to acquire Moveworks, which offers front-end AI assistant and enterprise search technology, and Logik.ai, which provides AI-powered, and composable configure, price, and quote solutions for sales teams. We see these moves augmenting its offering and helping pave the way for further adoption of AI and subscription-based revenue.
Target Price: Reiterate $1,200; Rating: One
Panic Point: $825
RISKS: Industry and economic risk, competition and competitive pressures, and acquisition risk.
SuRo Capital SSSS; $8.84; 19,000 shares; 3.04%; Sector: Financial Services
UPDATE: Shares of SuRo Capital (SSSS) continued to gain ground in September, adding to its gain for the quarter. We would remind you that our SSSS play remains a total return one as SuRo continues to harvest its investment portfolio. Soon after we close the current quarter, we could see SuRo issue a preliminary update for its portfolio and a first look at its net asset value per share for the quarter. Based on that figure, we will revisit our current $10 target as needed and, in turn, our current One rating. Alongside that, SuRo could deliver its next dividend announcement. That payment should reflect the monetization of SuRo’s holdings in CoreWeave and GrabAGun Digital Holdings (PEW). Exiting the June quarter, those two positions accounted for about 26% of SuRo’s investment Portfolio. PEW shares were listed on the NYSE on July 16. We would not be surprised if SuRo paces its dividend payments in H2 2025 and, if need be, trues up its dividend obligation with a special payment late in the year. While we enjoy the SuRo dividend stream, two items we will be closely following are other companies in its portfolio filing to go public and the company’s reinvestment decisions. The former will determine 2026 dividend payments, while the latter will lay the groundwork for dividend payments further out. Should we see indications that the SuRo dividend stream is waning, that would be a signal for us to reconsider owning SSSS shares in the Portfolio. Remembering the company’s BDC structure, we do not see that happening in the next few quarters.
September Month to Date Price Change: 1.6%; Yield: 5.66%
INVESTMENT THESIS: SuRo Capital is a business development company (BDC) that invests in high-growth, venture-backed private companies. As SuRo monetizes those portfolio investments through either IPO or M&A transactions, it must pay out most of its earnings to shareholders in the form of dividends. What’s important to factor into our thinking is that SuRo’s strategy isn’t to hold public company investments but rather to monetize them following the lock-up expiration. Sometimes this can be immediate, and sometimes it can be in stages, but when that monetization occurs, it triggers dividend payments. And because a BDC must pay out at least 90% of its taxable income through dividends to shareholders, there is the possibility of a special dividend to hit that qualifying threshold late in the year. As we think about this, it means that we should focus on total return with SSSS, which is defined as capital gains in the shares plus dividends received while owning them. What this means is even if we see SSSS shares trade sideways or move lower, depending on the size of the dividend payments in the coming quarters, the position’s total return could still be sizable for the Pro Portfolio. SuRo portfolio holdings at the end of June included CoreWeave (CRWV) , ServiceTitan (TTAN), OpenAI, Liquid Death, Whoop and fintech company Plaid, as well as roughly 30 other holdings.
Target Price: $10; Rating: One
Panic Point: $7
RISKS: Industry and economic risk, competition and competitive pressures, and acquisition risk.
Universal Display OLED; $149.50; 1,478 shares; 4.00%; Sector: Technology
UPDATE: After moving lower in July and August, shares of Universal Display (OLED) rebounded in September, rising mid-single digits, making them an outperformer relative to the market. Despite that rebound, the shares remained a modest drag on the Portfolio’s September quarter-to-date performance. However, we remain bullish on the shares as the adoption of light-emitting diode display technologies across an expanding array of applications continues. After sitting on the sidelines the last few months, the combination of the move lower in the shares and the growing number of confirmation points led us to scoop up more OLED shares in mid-September. While we recognize this has been a frustrating position for some, the overwhelming preponderance of data points to the accelerating adoption of organic light-emitting diode displays and in increasingly larger formats for the smartphone market, as well as the PC and monitor markets. We see that accelerating as more foldable products come to market in the next year, and long term, the development of blue rounds out red and green, paving the way for the eventual general illumination market (white) — just like we saw with LEDs. In late September, UBS upgraded the shares of LG Display (LPL), citing an improving organic light-emitting diode outlook and faster-than-expected development on white organic light-emitting diode displays in 2H 2025 and 2026. LG Display is a known Universal Display customer, and we look forward to more details when LG Display reports its quarterly results in late October.
September Month to Date Price Change: 7.9%; Yield: 1.20%
INVESTMENT THESIS: Universal Display focuses on the development and commercialization of organic light-emitting diode (OLED) technologies and materials for use in display and solid-state lighting applications. OLED displays are capturing a growing share of the display market, especially in the mobile phone, television, monitor, wearable, tablet, notebook, personal computer, augmented reality (AR), virtual reality (VR), and automotive markets. This adoption reflects advantages over competing display technologies concerning power efficiency, contrast ratio, viewing angle, video response time, form factor, and manufacturing cost. Universal Display's business strategy is to develop new OLED materials and sell existing and new materials to product manufacturers for display applications, such as mobile phones, televisions, monitors, wearables, tablets, portable media devices, notebook computers, personal computers, and automotive applications, and specialty and general lighting products. The company also looks to license its OLED material, device design, and manufacturing technologies to those manufacturers. As such, Universal Display has a significant portfolio of proprietary OLED technologies and materials with more than 5,500 patents issued and pending worldwide.
Target Price: Reiterate $200; Rating: One
Panic Point: $120
RISKS: Patent and Intellectual property protection; maintaining OLED manufacturing and customer relationships; technology risk; market risk.
Waste Management WM; $218.69; 880 shares; 3.48%; Sector: Industrials
UPDATE: Shares of Waste Management (WM) continued to be a drag on the Portfolio in September, leading to their underperformance as we get ready to close out the current quarter. In August, we added to the Portfolio’s position at $225.06 mid-month and did so again at $218.19 on September 12 and a second time on September 23 at $215.98 when we upgraded the shares to a One rating. We continue to favor the company’s sticky residential waste business, which is benefiting from disciplined pricing and further automation efforts, especially as it completes other nip-and-tuck acquisitions. We also like the company’s move into the medical waste business, and we see the team replicating the consolidation and margin-enhancing strategies that have been a hallmark of the waste business. Near-term, those prospects will be driven by pricing actions taken in the core waste removal business and further automation across its residential fleet. Management also sees quicker progress in integrating WM Healthcare Solutions (the former Stericycle business) and now sees realized synergies toward the upper end of its $80 million to $100 million target for this year. We see that healthcare business benefiting from the growing medical testing market, which also keeps us upbeat on Labcorp (LH) shares. As Waste continues to focus on wringing cost out of its existing and acquired businesses, we see it in a good position to continue increasing its dividend like it has over the last 21 years. Should that continue as we expect, it would put Waste on a good trajectory to join the Dividend Aristocrats.
September Month to Date Price Change: -3.4%; Yield: 1.51%
INVESTMENT THESIS: Waste Management’s core business is the inelastic waste removal business for residential, enterprise and other customers. The company has built its footprint through a series of acquisitions and excelled at wringing costs out of them, driving free cash flow, dividends, and funding incremental acquisition activity. While the residential business is sticky, the commercial business should continue to benefit from non-residential construction activity. Margins should continue to inch higher due to disciplined pricing and increasing use of automation. We are in the early days of WM Healthcare Solutions, but we see the business growing as management integrates and cross-sells against its core business and flexes the ability to integrate nip-and-tuck acquisitions as it has at the core waste business. Here, too, we see room to consolidate a fragmented industry, which makes this a natural fit for Waste Management.
Target Price: $255; Rating: One
Panic Point: $190
RISKS: Industry and economic risk, competition and competitive pressures, and acquisition risk.
TWOS
Alphabet GOOGL; $246.54; 867 shares; 3.87%; Sector: Communication Services
UPDATE: Following the strong showing in Alphabet (GOOGL) shares in July and August, they remained a powerful force for the Portfolio in September following the favorable outcome with the Department of Justice. That led us to upsize our GOOGL price target to $250 from $220, and it also paved the way for a relationship between Google and Apple for Google’s Gemini or another model to power Apple’s upcoming AI updated Siri. Should Google win that slot, it would be a major affirmation point for its AI efforts. Even as we lifted our price target, we bowed to the Portfolio’s discipline and used the ensuing strength seen in GOOGL shares and the subsequent overbought condition to do some prudent register ringing. Even after those multiple trades that locked in some massive gains for the Portfolio during the first half of the month, the Portfolio continued to have a sizable exposure to this Two-rated stock. Reason being, we continue to see Alphabet benefiting from AI adoption, the continued shift to digital advertising and share gains at YouTube. We continue to see Google Cloud benefiting from enterprise cloud and AI adoption, especially as it integrates more AI agents into each of its cloud products. Per management, more than 85,000 enterprises, including LVMH, Salesforce and Singapore's DBS Bank, now build with Gemini, driving a 35x growth in Gemini usage year-over-year. Impressive, but so is the cloud backlog figure of $106 billion discussed on the Q2 2025 earnings call. That should allow for continued revenue growth even as the segment passed the $50 billion annual run rate figure in the June quarter. Meanwhile, the company continues to make strides in integrating its Gemini model in Search, Android and other areas, which confirms our view that Google remains a player in the AI space, especially when it comes to consumer adoption. When we get the September global search engine market share metrics, we’ll revisit our GOOGL price target. Based on the company’s margin guidance, we may need to do that again following Alphabet’s September quarter earnings report. A third reason for us to revisit our price target would be confirmation of reports that Meta (META) is discussing using Gemini to boost its ad targeting.
September Month to Date Price Change: 15.8%; Yield: 0.34%
INVESTMENT THESIS: We believe that while search and digital ad dominance are what will carry the shares in the near-to mid-term, longer-term, it is the company's artificial intelligence "moat" that will provide for new avenues of growth. Exiting the March 2025 quarter, Alphabet reported over 270 million paid subscriptions across YouTube and Google One. YouTube Music and Premium alone reached 125 million subscribers globally. AI is what has made the company's search, video and targeted ad capabilities best-in-class and is the driving force behind the company's success in voice (Google Home) and autonomous driving (Waymo). Furthermore, we believe it is this AI expertise that will also make the company more prevalent in other industries, including healthcare via its subsidiary Verily, as AI and machine learning continue to disrupt operations across industries. Exiting the March 2025 quarter, across all its products, Alphabet had 0.5 billion users using its Gemini models. Adding to our positive view of the company's future opportunities, we believe that Alphabet's free cash flow generation and solid balance sheet set it apart and are what will allow the company to continue taking chances on far-out, ground-breaking and potentially world-changing projects, as well as fund capital returns to shareholders. We will continue to monitor advertising spend as well as the competitive landscape for the company’s core Search and Advertising business.
Target Price: Reiterate $250; Rating: Two
Panic Point: $190
RISKS: Regulatory risk (data privacy), competition, and macroeconomic slowdown impacting consumers and therefore ad buyer activity.
American Express AXP; $341.68; 640 shares; 3.95%; Sector: Financial Services
UPDATE: Building on their August strength, American Express (AXP) shares climbed further in September, leading the shares to hold their own against the S&P 500 with just two trading days left in the current quarter. We benefitted handsomely from that aggregate move, given the AXP nibbles that led us to build out the Portfolio’s position during the first eight months of 2025 with a cost basis of just under $296. One catalyst for that continued climb in September was consumers continuing to open their wallets in August, but in our view, the far greater one was the long-awaited Platinum card refresh. Amex has shared that as it increases the annual membership fee to $895 from $695, it is packing on the perks. Across existing dining, hotel, and other travel benefits that included a hotel credit (upped to $600 from the prior $200), $200 Uber (UBER) cash, $120 credit for Uber One membership, and a $200 airline credit, the company added several new ones. These additions include a $200 credit with Oura Ring, a $300 credit with Lululemon (LULU) and a $400 per year credit with Resy. In full, if one were to partake in all of Amex’s Platinum card benefits (including my personal favorite, the $300 digital entertainment credit), the tally would be $3,500. When we first added AXP shares to the Portfolio, we discussed the power of the membership business model. In our view, the Platinum refresh speaks to that, but as investors, it also reminds us of Amex’s differentiated business model. For newer members, that differentiated business model is Amex, deriving 70% of its pretax income from net card fees. Those net card fees are tied to the number of cards enforced and the average fee per card. For newer members, that differentiated business model is Amex, deriving 70% of its pretax income from net card fees. Those net card fees are tied to the number of cards enforced and the average fee per card. We’ve seen a steady increase in both the number of cards in force and the average fee per card, which implies stronger premium card growth. That includes Amex’s Platinum cards, and in our view, the $200 increase is more than offset by the incremental benefits. We see that helping continue the trend of card and card fee growth in the coming quarters. To us, this means we should see a step function higher in card fee growth and EPS. With that in mind, for now, we will increase our AXP price target to $370 from $340. As we see the average card fee tick higher, we will review our price target and our current Two rating as needed, especially if the number of cards in force grows faster than expected. The continued strength in AXP shares landed them in overbought territory, closing out the quarter. In keeping with our Two rating, we see $315 as a nice place to pick up additional shares
September Month to Date Price Change: 3.1%; Yield: 0.96%
INVESTMENT THESIS: American Express is a globally integrated, membership-driven payments company, providing customers with access to products, insights, and experiences that enrich lives and build business success. The company has four reportable operating segments: U.S. Consumer Services (USCS), Commercial Services (CS), International Card Services (ICS), and Global Merchant and Network Services (GMNS). American Express targets the premium consumer space by continuing to deliver membership benefits that span our customers’ everyday spending, borrowing, travel, and lifestyle needs, expanding its roster of business partners around the globe, and developing a range of experiences that attract high-spending customers. In 2024, the company’s net card fee revenue accounted for 65% of its pre-tax income, which we see providing a differentiated business model that should continue to grow as Amex wins new card members and drives its average fee per card higher.
Target Price: Reiterate $370; Rating: Two
Panic Point: $295
RISKS: Slowdown in consumer spending, competition, membership growth, merchant acceptance, and lack of new product innovation.
Apple AAPL; $255.46; 825 shares; 3.81%; Sector: Technology
UPDATE: Shares of Apple (AAPL) were among the Portfolio’s top performers over the last several weeks. Combined with their July and August move higher, with two trading days left in September, AAPL shares are up more than 20% quarter to date. Following the favorable outcome for Google with the Department of Justice, we boosted our AAPL price target to $250 from $235 ahead of the company’s iPhone 17 event. That ruling cleared the way for Google to continue to pay Apple for search engine placement, removing a potential income statement concern for Apple. Reports put Google’s payment to Apple between $15 billion and $20 billion, and the ruling also allows Apple to renew the deal each year, which gives Apple more leverage in search engine negotiations, given its device install base. We suspect we could see a similar relationship struck between the two companies as Google positions Gemini to help Apple address its AI needs. We will see how this develops and revisit accordingly. In terms of Apple’s new iPhone models, while we would characterize them as modest improvements, initial reception has been favorable. With AAPL shares hovering above our $250 price target, our plan is to revisit that target as we move past the initial excitement for these models and determine if they are kickstarting the anticipated iPhone upgrade cycle. We continue to think the debut of Apple’s long-awaited AI-enhanced Siri will trigger that cycle, and it’s something we aim to participate in as shareholders. That upgrade cycle should benefit Apple’s higher-margin Services business, one that has helped smooth the company’s profit and EPS generation.
September Month to Date Price Change: 10.0%; Yield: 0.41%
INVESTMENT THESIS: While we acknowledge that near-to-midterm performance remains heavily influenced by iPhone sales, the dynamic is shifting as investors finally place greater emphasis on Services growth. We are bullish on the 5G upgrade cycle and believe longer-term upside will continue to come as Services revenue grows its share of overall sales. Services provide for a recurring revenue stream at higher margins, a factor that serves to reduce earnings volatility while allowing for a higher percentage of sales to fall to the bottom line; as a result, we believe that Services growth and the installed base are much more important than how many devices the company can sell in each 90-day period. In addition to improved profitability, we also believe the transparent nature of this revenue stream will demand an expanded price-to-earnings multiple as segment sales grow. Furthermore, we believe that Apple's desire to push deeper into the healthcare arena will help make its devices invaluable as more life-changing features are added and the company works to democratize health records.
Target Price: Reiterate $250; Rating: Two
Panic Point: $205
RISKS: Slowdown in consumer spending, competition, lack of new product innovation, elongated replacement cycles, and failure to execute on Services growth initiatives.
Bank of America Corp. BAC; $52.21; 4,410 shares; 4.16%; Sector: Financial Services
UPDATE: Following a strong move in August, shares of Bank of America (BAC) rose further in September, fueled by increased investment banking activity. That double-digit quarterly gain left the shares up almost 19% on a year-to-date basis as we approach the end of September. The IPO market is expected to heat up further in the December quarter, with Barclays calling for 20 to low-20s tech-related IPOs by the end of the year, with more to come in 2026. BofA has also benefited from increased M&A activity, given its market position. That includes being the eventual recipient of one of Wall Street’s largest fees ever. BofA, which advised Norfolk Southern (NSC) on its sale to Union Pacific (UNP) , is set to earn an estimated $130 million fee. Bank of America wouldn’t be paid the bulk of its fee until the deal closes, which is expected to be in early 2027. However, we see that putting a nice notch in the BofA investment banking belt, and one that could help the company move up in the league tables. Following the flurry of deals in September, we lifted our BAC price target to $60 on September 19, but based on the level of deal flow for both IPOs and M&A activity, we will review and adjust that target as necessary. With BAC shares exhibiting an overbought condition, we reiterate our Two rating. Our new panic point level for the shares is $44, up from $39, and our revised pick-up level is near $47, between the current 50-day and 100-day moving averages.
September Month to Date Price Change: 2.9%; Yield: 2.15%
INVESTMENT THESIS: Bank of America is one of the world's leading financial institutions, serving individual consumers, small- and middle-market businesses and large corporations with a full range of banking, investing, asset management and other financial and risk management products and services. The company provides unmatched convenience in the United States, serving approximately 67 million consumers and small business clients with approximately 3,900 retail financial centers, approximately 16,000 ATMs, and award-winning digital banking with approximately 56 million verified digital users. Bank of America is a global leader in wealth management, corporate and investment banking, and trading across a broad range of asset classes, serving corporations, governments, institutions and individuals around the world. Bank of America offers industry-leading support to approximately 3 million small business households through a suite of innovative, easy-to-use online products and services. The company serves clients through operations across the United States, its territories, and approximately 35 countries. From a reporting perspective, the company's business breaks down as follows: Net Interest Income breakdown: Consumer Banking 57%, Global Banking 23%, Global Wealth & Investment Management 14%, and Global Markets 6%; Income Before Tax breakdown: Consumer Banking 42%, Global Banking 27%, Global Wealth & Investment Management 16%, and Global Markets 15%. Bank of America pays a quarterly dividend of $0.26 per share, up from $0.18 a few years ago.
Target Price: $60; Rating: Two
Panic Point: $44
RISKS: Financial markets, fiscal, monetary and regulatory policies, economic conditions and credit ratings.
Dutch Bros BROS; $53.10; 3,258 shares; 3.13%; Sector: Consumer Cyclical
UPDATE: Shares of Dutch Bros (BROS) have been a weight on the Portfolio’s performance during the current quarter, a sharp reversal from the positive force they were during the first half of 2025. We attribute the September quarter-to-date performance to the renewed concerns over consumer spending amid ongoing inflation pressures and uncertainty over the jobs market. However, as we have seen time and time again, the key to companies like Dutch Bros is geographic expansion. In early August, alongside its quarterly results, Dutch reiterated its 2,029 total shop count target for 2029. During the June quarter, Dutch Bros opened 31 new system locations, expanding into its 19th state (Indiana). That put the company’s total system count at 1,043 compared to 982 exiting 2024. Based on management’s target of at least 160 new shops this year, we should see roughly 100 shops open in H2 2025. Applying some simple math, if Dutch Bros exits 2025 with a shop count near 1,142, that means the pace of openings will need to accelerate in 2026 and 2027 to hit its 2,029 shop count by 2029. To us, that footprint expansion with the added layering of an expanded food offering starting next year points to continued revenue, profit dollars and EPS growth. That keeps us bullish on BROS shares, especially since a more favorable rate environment could accelerate that expansion. Following the September Fed meeting, we scooped up more BROS shares at $58.59. If margins hold up better than expected in H2 2025, that would give us a reason to revisit our price target. On that front, we will continue to follow key inputs, including dairy, coffee, sugar and cocoa prices. One knock that we’ve identified is the lack of communication from the management team, which can make the shares volatile at times. Until the management team decides to call more attention to its footprint expansion, we’re willing to put up with fluctuations in BROS shares so long as that footprint expansion story remains intact. Toward the end of the September quarter, the BROS management team seems to be getting the message, given meetings with research firms that culminated in bullish comments and price target reiterations.
September Month to Date Price Change: -26.1%; Yield: 0.0%
INVESTMENT THESIS: Dutch Bros is an operator and franchisor of drive-thru shops that focus on serving high-quality, hand-crafted beverages with unparalleled speed and superior service. Coffee-based beverages make up about 50% of the menu mix, and about 25% of the menu mix is based upon the company’s proprietary Blue Rebel energy drink, which is highly customizable with flavors and modifiers and can be served blended or over ice. The energy platform helps unlock the afternoon day part and broadens the company’s appeal. The remaining 25% of the menu mix is a wide variety of teas, lemonades, sodas and smoothies. The company’s west-to-east expansion is a time-tested strategy that should drive revenue and EPS growth over the next several years. Leveraging that footprint expansion and low-single-digit comp sales growth, management reiterated its long-term guidance of around 20% annual revenue growth. Helping support that guidance, the company confirmed it will introduce an expanded food menu in 2026. Dutch Bros is slated to enter the consumer-packaged goods (CPG) space in a deal with Trilliant Food & Nutrition.
Target Price: Reiterate $85; Rating: Two
Panic Point: $48
RISKS: Commodity risks, labor costs, interest rate risk, and inflation.
First Trust Nasdaq Cybersecurity ETF CIBR; $75.81; 2,248 shares; 3.08%; Sector: Cybersecurity
UPDATE: Shares of the First Trust Nasdaq Cybersecurity (CIBR) ETF have been a positive contributor to the Portfolio so far in September, which helps offset their net decline in July and August. Each time we note ripped-from-the-headlines confirmation points for the Pro Portfolio and its underlying strategy, one constant is the signals for cybersecurity demand. Artificial intelligence will super-charge familiar threats in 2025 and beyond, putting new wrinkles on old security challenges such as phishing, insider threats and ransomware. Entering this year, research firm Gartner expected cybersecurity spending would rise $212 billion, but during August the firm increased that to $213 billion. It also forecasts cybersecurity spending accelerating in 2026 as it sees a concerted enterprise effort to shore up cloud security capabilities, particularly in relation to AI workloads. By 2028, Gartner sees that spending approaching $300 billion, and it’s that multiyear outlook that keeps us owners of CIBR shares. We continue to favor the diversified exposure this ETF brings to the Portfolio. We have room to expand the Pro Portfolio’s exposure to CIBR should we see a wider market pullback emerge. If such an event unfolded, CIBR shares near $72 would make for a wonderful addition, which also happens to be our established pick-up point. For now, our $63 panic point remains, but as CIBR shares move higher, we’ll lift that level in a commensurate manner. Catalysts we will be watching include subsequent M&A activity in the space as well as September quarter results from key constituents, including CrowdStrike (CRWD) , Palo Alto Networks (PANW) , Infosys (INFH), Cloudflare (NET) and CyberArk (CYBR) .
September Month to Date Price Change: 3.7%; Yield: 0.02%
INVESTMENT THESIS: The First Trust Nasdaq Cybersecurity ETF seeks investment results that correspond generally to the price and yield (before the fund's fees and expenses) of an equity index called the Nasdaq CTA Cybersecurity Index. The Nasdaq CTA Cybersecurity Index is designed to track the performance of companies engaged in the cybersecurity segment of the technology and industrial sectors. It includes companies primarily involved in the building, implementation and management of security protocols applied to private and public networks, computers and mobile devices to protect the integrity of data and network operations. To be included in the index, a security must be listed on an index-eligible global stock exchange and classified as a cybersecurity company as determined by the Consumer Technology Association. Each security must have a worldwide market capitalization of $250 million, have a minimum three-month average daily dollar trading volume of $1 million, and have a minimum free float of 20%.
Target Price: Reiterate $85; Rating: Two
Panic Point: $63
RISKS: Cybersecurity spending, technology and product development, the timing of the product sales cycle, new products, and services in response to rapid technological changes and market developments, as well as evolving security threats.
Labcorp Holdings Inc. LH; $280.61; 710 shares; 3.60%; Sector: Healthcare
UPDATE: Following a strong month of outperformance relative to the larger market, shares of Labcorp (LH) were little changed during September. Quarter to date, LH shares have been a solid performer with their mid single-digit gain. While it may not be a sexy business or one that generates much in the way of headlines, the company remains a well-positioned play for our Aging of the Population investing theme. During Labcorp’s presentation at the Morgan Stanley Global Health Conference this month, Chairman and CEO Adam Schechter chalked the company’s increased volume to two main factors: an aging population and newly available tests that help understand patients' diseases better. Management also shared that its strategy to lean into specialty testing is driving not only testing volumes in those categories but also broader testing volumes as well. The company also has a significant number of biomarkers for people who want to do some type of functional health assessment and understand many different aspects of their health. Exiting the June quarter, Labcorp’s trailing 12-month orders accelerated to $3.34 billion, up from $3.15 billion three months earlier, leaving its total backlog at $8.71 billion compared to $8.18 billion. That, along with some additional nip-and-tuck acquisitions completed in July, August and again in September, backs management's raised outlook for 2025. Management sees its top line rising 7.5% to 8.6% year over year, compared to 6.7% to 8.0% at the end of March. That increase and continued margin improvement prospects led us to boost our LH price target to $300 from $265 back in mid-July. We see support for the shares near $270 and $261, but we also see a gap in the chart that would close near $255. Closing that gap would bring a more favorable pickup point for the Portfolio and members. With just under 3.6% of the Portfolio’s assets in LH shares, a pullback to that level could lead us to round out that position size.
September Month to Date Price Change: 0.9%; Yield: 1.03%
INVESTMENT THESIS: Labcorp is a global leader in innovative and comprehensive laboratory services that provide vital information to help doctors, hospitals, pharmaceutical companies, researchers and patients make clear and confident decisions. By leveraging its diagnostics and drug development capabilities, the company provides insights and accelerates innovations to improve health and improve lives. The company is organized under two segments, consisting of Diagnostics Laboratories (Dx), which includes routine testing and specialty/esoteric testing, and Biopharma Laboratory Services (BLS), consisting of Early Development Research Laboratories and Central Laboratory Services. Our attraction to LH shares stems from the combination of the aging population driving diagnostic testing growth and the increasing array of diagnostic testing as well. That combination is expected to drive the healthcare testing services market to $12.6 billion by 2029, from $7.4 billion in 2024, according to Markets and Markets. To augment its position in oncology, women's health, autoimmune diseases and neurology, the company has been expanding through acquisitions and partnerships with health systems and regional and local labs.
Target Price: Reiterate $300; Rating: Two
Panic Point: $228
RISKS: Macroeconomic factors, changes in healthcare reimbursement models and products, government regulations, product discontinuations or recalls.
Meta Platforms META; $743.75; 283 shares; 3.81%; Sector: Communication Services
UPDATE: Shares of Meta (META) crossed into the black on a quarter-to-date basis in September, pushing their year-to-date return past the 25% level. Despite the net modest move in the shares, September was a busy month for the company, starting with CEO Mark Zuckerberg sharing that it would spend “at least” $600 billion in U.S. data centers and related infrastructure through 2028. Based on July comments, Meta would spend $66 billion to $72 billion this year and a “similarly significant” amount in 2026, which suggests a step up in spending in 2027 and 2028. The U.S. Army selected Anduril-Meta to develop a prototype for a new battlefield headset. We see that supporting Meta’s R&D efforts in AR/VR and subsequent consumer products. Shortly thereafter, it was announced that Meta’s AI model Llama was approved for use in U.S. government agencies as part of the OneGov strategy. That, along with Meta’s efforts to license news and other content to use across its products, suggests it is aiming to further improve its AI models. With that in mind, we are not surprised Meta introduced new features to its Facebook Dating service, including “a dating assistant chatbot within the service that will give a user personalized help in their dating journey.” Mid-month, Meta unveiled new smart glasses with a built-in display at its annual Connect event, with a retail price tag of $800. Given the price tag compared to the $299 starting price for the Ray-Ban line and $399 for the sportier Oakley glasses, we suspect a more limited market for this new model, but we will keep an open mind. Because we are still in the early innings of Meta’s leveraging AI to drive pricing, productivity, and margins higher, which suggests more benefits to come in subsequent quarters, we will remain META owners to capture further gains. We should see further improvement in margins in the coming quarters, but higher expenses will be a headwind as Meta invests further in AI capacity and talent. However, we see this as another instance of the company investing today to drive its business and profits higher in the coming quarters. Part of that includes the further expansion of its ad platform to include WhatsApp and, to a larger extent, Threads, but also increasing AI’s role in automating and streamlining its larger advertising revenue stream. Per management, we are in the early innings of those strategies, and that suggests more benefits to come in subsequent quarters. We read that as greater profit and EPS dollars ahead, and that will keep us invested in META shares. We will continue to monitor digital ad spending, Meta’s monetization efforts, and the impact of internal AI adoption on margins. Based on the Portfolio’s position size, we have a rather full plate of META shares, but we will continue to look for nice entry points for newer members and those with smaller position sizes.
September Month to Date Price Change: 0.7%; Yield: 0.28%
INVESTMENT THESIS: Meta segments its business between Family of App Products, which includes Facebook, Instagram, Messenger, Threads, and WhatsApp, and Reality Labs Products, which includes its metaverse and investments and future product R&D. Family of Apps accounts for about 99% of company revenue and 100% of company operating profit. Substantially all of Meta’s revenue is currently generated from advertising on Facebook and Instagram. Family daily active people (DAP) were 3.48 billion on average for the June 2025 quarter. Meta expects to spend $66 billion to $72 billion on capex in 2025, a significant increase year over year, with most of this spending focused on AI infrastructure and initiatives. Meta is positioned to benefit from the ongoing shift toward digital advertising and the adoption of AI across its product offerings. We recognize Meta is ramping up capital spending as part of the current AI arms race, but we see that as an investment that should drive productivity in its core advertising business. As the company harvests that investment, we could see a step up in margins, much like we saw in 2023.
Target Price: $850; Rating: Two
Panic Point: $625
RISKS: Ability to add and retain users and user engagement; marketing spend; new products or changes to existing ones; competitive risk, geopolitical risk.
Microsoft Corp. MSFT; $511.46; 370 shares; 3.42%; Sector: Technology
UPDATE: Shares of Microsoft (MSFT) were little changed in September, which leaves us with only a modest gain in the shares quarter to date. Still, as we see it, that modest gain nudges the shares higher on a year-to-date basis, keeping them well ahead of the S&P 500. In keeping with our Two rating and our $600 price target, we are evaluating levels at which we would put capital to work as the company continues to monetize its ramping cloud capacity, grow its subscription revenue base, and benefit from the accelerating mix shift to AI PCs. Backing our view to consider adding more shares, the company’s commercial booking moved past $100 billion for the first time in the June quarter. That was a 37% year-on-year increase, but it was only part of the story. The company’s commercial remaining performance obligation (RPO) ballooned 35% to $368 billion. Quite impressive, but it was the comment made during the earnings call that roughly 35% of that RPO figure will be recognized as revenue in the next 12 months that really caught our attention. In our view, the key to MSFT shares breaking out of the $500 to $530 range they have been in over the last three months will be Microsoft delivering further margin expansion as it monetizes its RPOs. Late in September, Google and Qualcomm teased a tie-up that would expand the Android ecosystem to the PC and other markets. This development could restrain MSFT shares in the short term, but as we pointed out in our note discussing this development, over the last several years, Microsoft has increasingly become an enterprise and cloud-centric company rather than a consumer one. We were reminded of that with the announcement this month that the U.S. House of Representatives plans to begin using Microsoft Copilot. While we wait to see how Microsoft responds to this Google-Qualcomm challenge, we’ll get ready to collect our next quarterly dividend. In mid-September, Microsoft announced a 9.6% increase in its quarterly dividend to $0.91 per share, which will be paid on December 11 to shareholders of record on November 20. That is the company’s 14th consecutive annual dividend increase, and given what we see ahead, we would be surprised if it is the last. We will also continue to monitor the evolving relationship between Microsoft and OpenAI as the latter addresses its corporate structure with an eye toward eventually becoming a public entity.
September Month to Date Price Change: 0.9%; Yield: 0.71%
INVESTMENT THESIS: We believe the cloud to be a secular growth trend and that the upside to the shares will result from Microsoft's hybrid cloud leadership as the company grabs market share in this expanding industry. While companies may look to build out multi-cloud environments, Microsoft's Azure offering will be a prime choice thanks to its decision to provide the same "stack" used in the public cloud to companies for their on-premises data centers. Additionally, we would note that hybrid environments are currently the preference for most companies because they allow them to maintain critical data in-house while taking advantage of the agility and scalability provided by public clouds. Outside of the cloud opportunity, we maintain a positive view on the company's growing gaming business, which we believe is becoming an increasingly prominent factor in the Microsoft growth story as gaming becomes more mainstream, management works to convert its gaming revenue from a one-time license purchase to a recurring subscription model, and as technologies like augmented/virtual reality evolve. Finally, as it relates to LinkedIn and other subscription-based services such as O365 and various Dynamics products, we continue to value them highly for their recurring revenue streams, which, we remind members, provide for greater transparency of future earnings.
Target Price: $600; Rating: Two
Panic Point: $450
RISKS: Slowdown in IT spending, competition, and cannibalization of on-premises business by the cloud.
Morgan Stanley MS; $160.11; 1,400 shares; 4.05%; Sector: Financial Services
UPDATE: Building on the move we saw in Morgan Stanley (MS) shares during the earlier part of Q3 2025, the September performance led the shares to a robust double-digit gain quarter-to-date. That share price performance reflected growing momentum in the IPO market and increased M&A activity. Even though we locked in some big MS gains when the shares became overbought late in the month, we lifted our price target to $170 from $150. The IPO market is expected to heat up further in the December quarter, with Barclays calling for 20 to low-20s tech-related IPOs by the end of the year, with more to come in 2026. Nvidia backed Lambda, a cloud computing company that provides hardware and services for artificial intelligence hyperscalers, labs and enterprises, is preparing to launch an IPO as soon as the first half of 2026, and Morgan Stanley is one of the named banks in the transaction. Based on the level of deal flow for both IPOs and M&A activity in the coming months, we will continue to review and adjust our MS target as necessary. Near-term, with the RSI level for MS shares over 70, indicating an overbought condition, we cannot recommend adding shares to your holdings at current levels, hence, we continue to rate the shares a Two. Our pick-up point for the shares is $147, and our panic point has been lifted to $135.
September Month to Date Price Change: 6.4%; Yield: 2.50%
INVESTMENT THESIS: Morgan Stanley reports in three business segments: Institutional Securities (42% of trailing 12-month revenue, 38% of trailing 12-month Income Before Tax), Wealth Management (48%, 55%), and Investment Management (10%, 6%). While the IPO window has yet to reopen, the potential IPO class for 2025 continues to build with recent additions including Klarna and StubHub. That would be a boon to private equity firms and others that have been nursing IPO candidates during the dark period and a positive for Morgan Stanley's investment banking business. Expected deregulation under the Trump administration is a potential catalyst for Morgan's M&A business. Meanwhile, folks continuing to be behind in retirement savings bodes well for Morgan Stanley's wealth management business in the coming quarters, while continued market volatility bodes well for its equity trading business.
Target Price: $170; Rating: Two
Panic Point: $135
RISKS: Market and interest rate risk, credit risk, country risk, and operational risk, including cybersecurity.
TJX Companies TJX; $143.09; 687 shares; 1.78%; Sector: Financial Services
UPDATE: Our position in the shares of TJX Companies (TJX) that we began on July 1 started slow out of the gate, but their August performance and continued strength in September more than made up for that. Quarter to date, TJX shares are up low double-digits, putting them well ahead of the S&P 500. Over the course of the quarter, we continued to receive signals that the consumer was becoming increasingly selective when it came to spending, opting to cut back on spending and switching to lower-priced products. We continue to see TJX as well-positioned with consumers feeling the pinch of higher prices and remaining selective and value-driven, even though they will spend where it matters. The August Retail Sales report, which showed a surge in clothing sales and home furnishings, bodes well for TJX’s reporting segments. On the topic of tariffs, around 90% of what TJX buys is from third parties, taking advantage of closeouts from brands, manufacturers and other retailers, or in some cases, manufacturing overruns. As such, for around 90% of its merchandise, TJX is not the direct importer, and that makes the TJX business model different than most retailers'. That combination sets the company up rather well from a value-driven consumer perspective as we head into the holiday shopping season. As we move deeper into H2 2025, toward that holiday shopping season, we would welcome the opportunity to boost the Portfolio’s exposure to TJX, but in keeping with our Two rating, we will remain disciplined investors. We continue to see a gap in the chart that would be filled at $134, but also very strong support between $130 to $134, better known as the 50-day and 100-day moving averages.
September Month to Date Price Change: 4.7%; Yield: 1.19%
INVESTMENT THESIS: The TJX Companies is the leading off-price apparel and home fashions retailer in the United States and worldwide. It has over 5,000 stores and six branded e-commerce sites that offer a rapidly changing assortment of quality, fashionable, brand-name and designer merchandise at prices generally 20% to 60% below full-price retailers’ regular prices on comparable merchandise. The company operates in four segments: Marmaxx and HomeGoods, both in the U.S.; TJX Canada, and TJX International. TJX looks to capitalize on opportunities to acquire merchandise at substantial discounts that regularly arise from the production and flow of inventory in the apparel and home fashions marketplace. These opportunities include, among others, closeouts from brands, manufacturers, and other retailers; special production direct from brands and factories; order cancellations; and manufacturer overruns. We see that positioning TJX extremely well, as consumers feel the pinch of ongoing inflation pressures and their efforts to stretch the disposable spending dollars they do have, including tapping discounted shopping locations.
Target Price: $150; Rating: Two
Panic Point: $115
RISKS: Operational, strategic buying and competitive risks, as well as consumer spending patterns.
United Rentals URI; $947.27; 235 shares; 4.03%; Sector: Industrials
UPDATE: Following a string of months in which they moved meaningfully higher, the shares of United Rentals (URI) took a breather in September. Despite that performance, the shares have been a robust performer for the Portfolio, given their near 25% move higher quarter to date. We continue to see the company benefiting from nonresidential construction activity, due in part to data center construction as well as that for re-shoring efforts. Should the Fed continue to move monetary policy in a more dovish direction, that should reduce project hurdle rates, potentially leading to a stronger nonresidential construction market in 2026. We will continue to keep a close watch on the domestic housing market, as a rebound in demand would be another positive demand driver for United’s business and our shares. We will revisit our price target once we have the August Construction Spending report in hand.
September Month to Date Price Change: -0.9%; Yield: 0.76%
INVESTMENT THESIS: United Rentals, the largest equipment rental company in the world, operates throughout the United States and Canada, and has a limited presence in Europe, Australia and New Zealand. It serves industrial and other non-construction, commercial (or private non-residential) construction, and residential construction. Industrial and other non-construction rentals represented approximately 50% of rental revenue, primarily reflecting rentals to manufacturers, energy companies, chemical companies, paper mills, railroads, shipbuilders, utilities, retailers and infrastructure entities; commercial construction rentals represented approximately 46% of rental revenue, primarily reflecting rentals related to the construction and remodeling of facilities for office space, lodging, healthcare, entertainment and other commercial purposes; and residential rentals around 4% of revenue. We see the company benefiting on three fronts — the seasonal uptick in construction spending, the release of funds and projects associated with the five-year Biden administration infrastructure bill, data center construction and other re-shoring projects, and the company's nip-and-tuck acquisition strategy that should further enhance its geographic footprint.
Target Price: Reiterate $1,000; Rating: Two
Panic Point: $740
RISKS: Industry and economic risk, competition and competitive pressures, and acquisition risk.
Vulcan Materials Company VMC; $299.29; 613 shares; 2.8%; Sector: Building Materials
UPDATE: Shares of Vulcan Materials (VMC) have been a steady performer throughout the September quarter, which lifted the shares into the low double digits as we get ready to close out the current quarter. We see further upside ahead as the company continues to realize margin and bottom-line benefits from higher year-over-year gross profit per ton metrics in H2 2025 and 2026. Normally, the second half of the year drives more than half of Vulcan's annual sales and 53% to 55% of its adjusted EBITDA for the year. Given the inclement weather experienced in H1 2025, we are likely to see H2 2025 account for a larger-than-usual piece of annual revenue as catch-up activity is augmented by new highway construction and other drivers of non-residential construction activity, including data center. We continue to see a gap in the chart near $275, which coincides with the 100-day moving average. A pullback in the shares to that level would see us become incrementally bullish, but we also continue to evaluate incoming data. That includes the soon-to-be-published August Construction Spending report, and it could lead us to revisit our current price target. We recognize that before too long, we will be approaching the seasonally weaker time of year for Vulcan’s business. As we assess the expected winter weather and its potential impact on Vulcan, we will also follow the Fed’s monetary policy moves and what that could mean for construction activity in 2026.
September Month to Date Price Change: 2.8%; Yield: 0.65%
INVESTMENT THESIS: Vulcan Materials operates primarily in the U.S. and is the nation's largest supplier of construction aggregates (primarily crushed stone, sand, and gravel), a major producer of asphalt mix and ready-mixed concrete, and a supplier of construction paving services. Its products are the indispensable materials used in building homes, offices, places of worship, schools, hospitals and factories, as well as vital infrastructure, including highways, bridges, roads, ports and harbors, water systems, campuses, dams, airports and rail networks. Ramping spending associated with the Biden administration infrastructure law should drive demand for Vulcan's products over the coming years. Vulcan has historically complemented its organic growth prospects by acquiring businesses to expand its geographic reach and product scope. Since 2014, the company has acquired more than two dozen companies, including the 2021 acquisition of U.S. Concrete. That combination has allowed the company to deliver steady top and bottom-line growth over the last decade, with only a modest decline when the pandemic hit in 2020.
Target Price: Reiterate $310; Rating: Two
Panic Point: $240
RISKS: General economic and business conditions; dependence on the construction industry; timing of federal, state and local funding for infrastructure; changes in the level of spending for private residential and private nonresidential construction.
Welltower Inc. WELL; $174.90; 330 shares; 1.04%; Sector: Real Estate
UPDATE: In the first half of September, we revisited then Bullpen resident Welltower Inc. (WELL) , updating figures tied to the demographic shift associated with an aging population. Some call this shift the "Silver Tsunami," but we see it as a powerful force when examined against the looming shortage of senior housing. Following the Fed’s September rate cut and updated set of economic projections that signal a move toward a more dovish policy stance, we called up WELL shares to the Portfolio with a $190 price target. Given the upside to our price target, we are starting the position with a Two rating. Should WELL shares either fall back to support near the 100-day moving average, near $159, or if the company can achieve stronger-than-expected margin gains that drive faster net operating income (NOI) and funds from operations (FFO), prompting us to revisit our price target, we would look to reconsider our initial rating for the shares. A pullback to that $157 level would also see us become more aggressive in the shares. Because of the favorable demographic tailwind and lower interest rate path that should reduce construction costs over time, as well as bring REIT stocks back into favor, our intent is to be long-term holders of WELL shares. Our plan will be to build the position size methodically, increasing the Portfolio’s dividend stream along the way. We look forward to Welltower announcing its next quarterly dividend payments, which, if history holds, should be in late October.
September Month to Date Price Change: 5.2%; Yield: 1.69%
INVESTMENT THESIS: Welltower, a real estate investment trust (REIT), owns interests in properties concentrated in major, high-growth markets in the United States, Canada and the United Kingdom, consisting of seniors housing, post-acute communities, and outpatient medical properties. We see the company benefiting from the intersection of the demographic shift that is the aging population and the looming pain point that is the shortage of inventory for senior housing, which fell below 1% in Q2 2025, according to the National Investment Center for Seniors Housing & Care. Over the next five years, more than 4 million boomers will hit age 80, and that’s in addition to the roughly 4% of the U.S. population that is 80-plus years old in 2024. As this demographic shift unfolds, we should see a relatively steady growth rate in Welltower’s revenue, NOI and FFO, which, in turn, given its REIT status, should drive its payable dividend stream higher. Because of the favorable demographic tailwind and lower interest rate path telegraphed by the Federal Reserve, which should reduce construction costs over time, as well as bring REIT stocks back into favor, our intent is to be long-term holders of WELL shares. Our plan will be to build the position size methodically, increasing the Portfolio’s dividend stream along the way.
Target Price: $190; Rating: Two
Panic Point: $141
RISKS: Operational risk, operator and tenant risk, competitive risks, and acquisition risk.
