S&P 500 Chart Offers Plenty to Be Worried About
Even as earnings season arrives, investors and traders approach with skepticism.
You've reached your free article limit
You've read 0 of 1 free Pro articles.
When all else fails, retreat.
That seems to be the message of the markets as the recent touch of the long-term trend line (broken purple line below) has now become a battleground (yellow box). No question, the market is bearish right here and it could actually be a longer-term condition. Every rally has been sold and even after that monster move up on April 9 the indexes are slowly fading that move.
Volume levels are elevated again and with prices moving downward that means heavy distribution is at hand. Notice in pane 3 the trend is starting to accelerate as shown by the ADX. Remember, this indicator simply tells us the power of the move, not the direction.
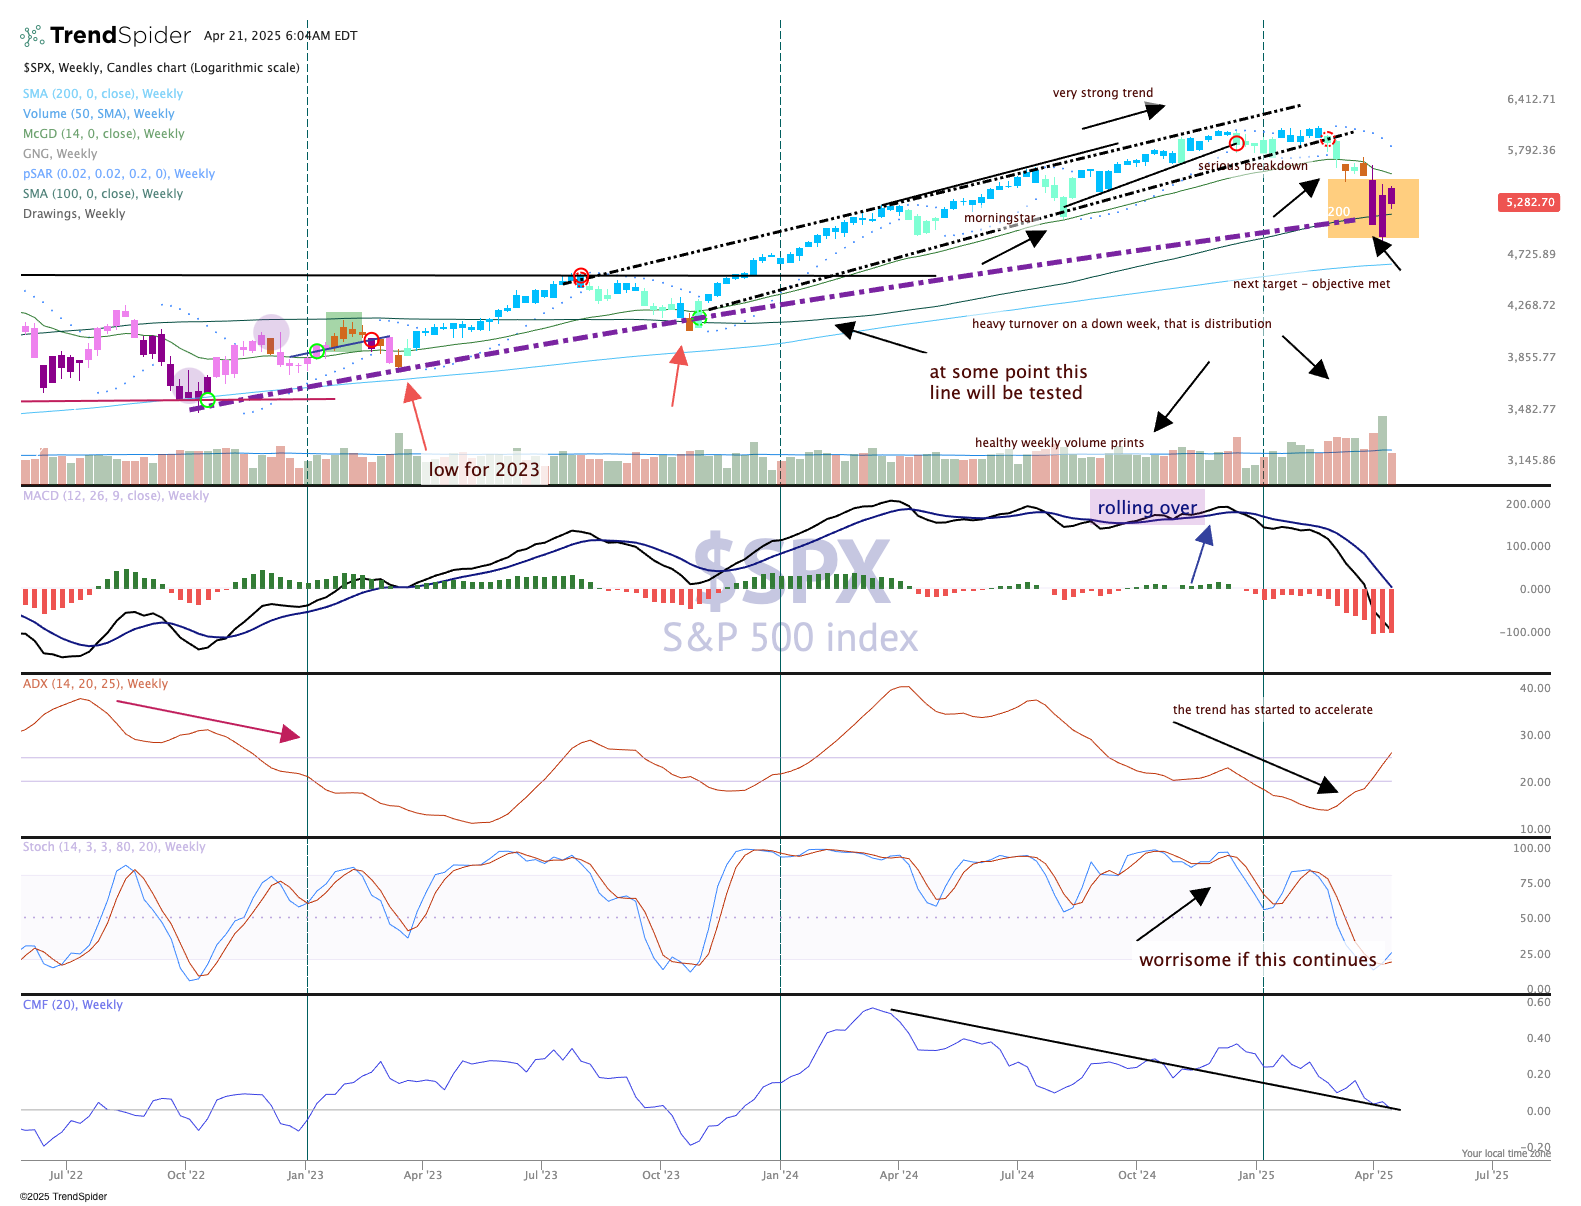
We use other tools to identify which way the market is going. Chaikin money flow is poor and is now at levels not seen since late 2023. MACD (moving average convergence divergence) is deep in a bearish signal as well. There is nothing positive on the chart here as another purple candle is printed (that is bearish).
With only eight days remaining in April, the indexes are down 5% or more across the board. It is going to take some heavy lifting to push into positive territory before April 30.
