Our Trading Game Plan as We Close Out February
Ahead of next week’s data deluge, here's our take on January PCE and personal income and spending.
You've reached your free article limit
You've read 0 of 1 free Pro articles.
Before we dig into our take on this morning’s January Personal Income & Spending data and the January Personal Consumption Expenditures (PCE) price index, we’ll first reiterate our view that this data is a bit in the rear-view mirror category at this point. Next week’s February data will be more insightful and has the potential to be more disruptive.
Why's that?
Much like the few pieces of February data we’ve already received, it will include initial reactions to Trump tariffs. That means we will be mindful of any potential pull-forward in activity, watching the direction of new order activity, and being very cognizant of what’s shared about input and output costs, job creation, and wages.
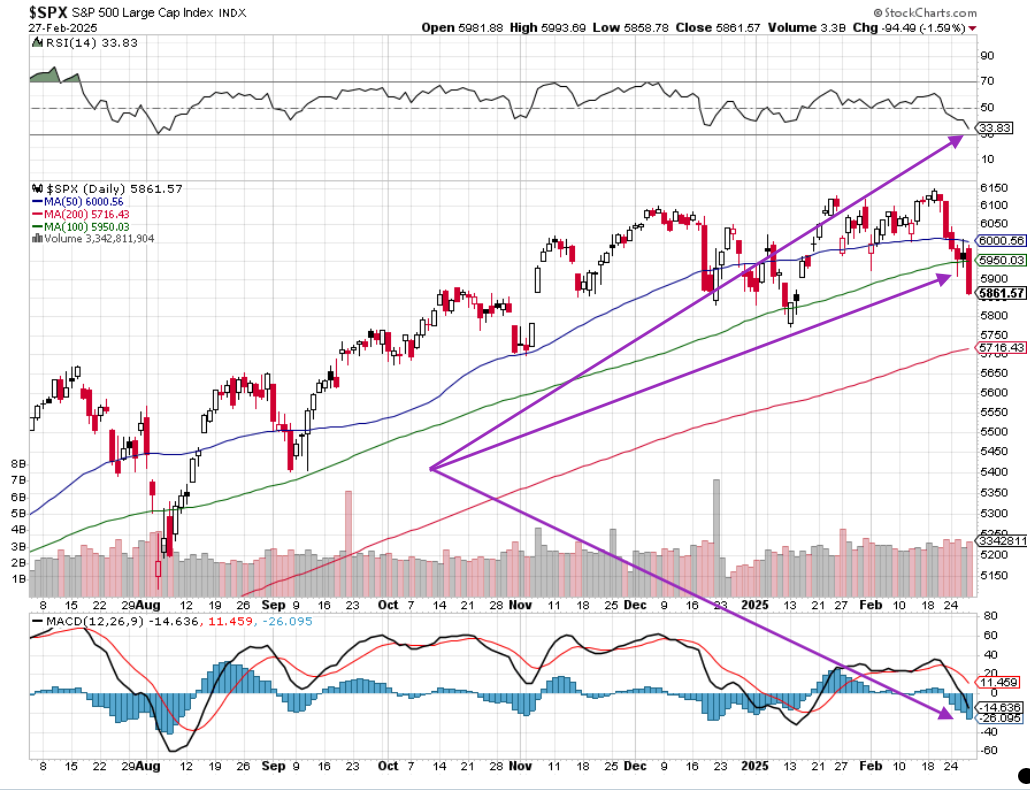
As such, we will tread carefully today as well as early next week, waiting for that data to be absorbed by the market before making any moves. When we look at the S&P 500, yesterday’s late-day selloff pushed the index below its 100-day moving average, and as we can see in the chart below it’s yet to be oversold. What's more, as Bob Lang would point out, its MACD (moving average convergence/divergence) has rolled over, but so far, it isn’t oversold either.
Should the S&P 500 push closer to being oversold, as we saw in August, that would likely bring about more pressure on stocks, but barring anything unforeseen, it would be a better spot to deploy more of the The Street Pro Portfolio’s cash. At the same time, with Trump tariffs on Mexico and Canada expected to start next week and another round of tit-for-tat tariff hikes between Trump and China, we will want to be extra careful to avoid being head-faked in the short-term and jumping the gun in putting capital to work.
January PCE Price Index
Turning our attention to the Fed’s preferred inflation gauge, the PCE Price index, the headline figure dipped to 2.5% on a year-over-year basis, from 2.6% in December, matching market expectations. Two thoughts on that. First we have to consider it laps the 2.61% figure posted in January 2024, and second, the January 2025 reading of 2.5% is still on par with November’s reading and higher than the 2.1%-2.4% figures for June-October 2024. Let’s also remember the January data are before Trump tariff talk and, based on our comments above, you can see why we consider it a bit "rear-view mirror-ish."
The core PCE price index figures also dipped as expected to 2.6% from 2.9% in December, hitting the lowest year-over-year increase in some time. However, here too we have to recognize that the figure laps the January 2024 one of 3.1%, and the data behind it was collected ahead of Trump tariff talk. Sticking with the core PCE price index, but shifting to a sequential view, the January figure accelerated to 0.3%, in line with expectations, but up from 0.2% in December and November’s 0.1% figure, putting it back at the highest level in 2024. That’s acceleration the Fed isn’t going to miss, and again, it comes before any tariff-related impact.
To sum it up, while the January PCE price index data show some improvement, it’s rather cosmetic and doesn’t reflect Trump tariffs. For that reason, we’ll be more keyed into what we learn next week in the final February PMI reports.
January Personal Income & Spending
Coming into this report we said we did not expect to see a positive surprise in January Personal Spending given recent comments from Walmart WMT and Home Depot HD, but also the increase in consumer debt levels for December. There is also the typical post-holiday sobering up as shopping bills come due. Well, January Personal Spending fell 0.2% compared to December, missing the expected 0.1% increase. Spending on durable goods plummeted by 3.0% while spending on nondurable goods edged down by 0.2%. Spending on services continued to increase, rising 0.3% but at a slower clip compared to 0.7% the previous month.
The bright spot in this data set was the 0.9% jump in personal income, a stronger print compared to the 0.3% market forecast and the highest increase in the last 12 months. It also laps a strong January 2024 personal income figure. The surprise in the January 2025 print can be traced back to the wage uptick we identified in the January ADP Employment Change Report as well as the one in the January Employment Report. As a reminder, average hourly earnings rose 0.5% sequentially in January, quite a bit faster than the 0.3%-0.4% month-over-month gains for September to December of last year.
We suspect the corresponding boost in the savings rate will be used to address post-holiday consumer debt levels, but we will want to watch the savings rate and consumer debt levels to tell if folks are addressing their personal balance sheets or just pulling back on spending given concerns over inflation pressures and the economy.
