October Monthly Roundup: Another Month of Outperformance for the Pro Portfolio
We continued to benefit from prior moves, while we added to multiple holdings, started a new position, and closed an extremely profitable one.
You've reached your free article limit
You've read 0 of 1 free Pro articles.
While it may be hard to fathom, despite all the headline drama we encountered over the last few weeks, October was the sixth consecutive month of gains for the S&P 500, and the seventh for the Pro Portfolio and the Nasdaq Composite. We chalk up our winning streak to navigating the evolving landscape by following the data, leaning into the thematic and other strategies we use to manage the Portfolio and position it for where capital is being spent while remaining disciplined investors.
We’ve come a long way, but looking ahead, we still have the government shutdown to contend with and an increasingly bifurcated consumer amid growing layoff activity. Meanwhile, questions about a December rate cut have been renewed following Fed Chair Powell’s “far from it” comment this week. While U.S.-China trade tensions seemed to thaw this week, things appear to remain heated between the U.S. and Venezuela, and there is speculation about other trade deals to come over the next few weeks.
As we plot those developments and course correct as needed, we will be keeping close tabs on consumer spending as we gear up for the year-end holiday shopping season. We will also be mindful that we could see a bout of hedge-fund redemptions, year-end profit taking, and tax management weigh on some widely held and profitable positions. That could also bring some opportunities for us, even though historically speaking, we are now in one of the strongest times of the year for the market. We’ll keep our wits about us and be on guard so that line of thinking doesn’t cause us to be hoodwinked as we navigate the last months of 2025.
As you’ll read below, October was a very busy, but also very profitable one for the Pro Portfolio. Enjoy Halloween and the weekend, but rest up because we will hit the ground running next week on multiple fronts. And with that in mind, we’ll see you back here, bright and early on Monday. Enjoy!
Catching Up on the Portfolio This Month
During October, we reaped the benefits of moves we made in August, September, and earlier in the month. That resulted in the Pro Portfolio outperforming the S&P 500 in October, but also to close the year-to-date gap between the two, and to exit October with a record level of assets. We’ll take a moment to enjoy that, but just a moment. We know the race is far from over, and the coming weeks will bring much to do as we prepare for the end of 2025 and the quarters to follow.
Driving the Pro Portfolio’s October progress were strong performances from Alphabet (GOOGL) , Amazon (AMZN) , SuRo Capital (SSSS) , Palantir (PLTR) , Qualcomm (QCOM) , Nvidia (NVDA) , Marvell (MRVL) , and American Express (AXP) , as well as a meaningful rebound in Dutch Bros (BROS) shares. Those gains were partly offset by declines in Meta Platforms (META) , Waste Management (WM) , and Labcorp (LH) , although this week we used those pullbacks to add to each of those three positions, as well as to SuRo Capital.
Those weren’t the only moves we made in October. We also added to our Costco (COST) position on October 9, Dutch Bros on October 10, and Axon (AXON) on October 16. We not only put cash to work, we also heeded our portfolio discipline and locked in some very large gains early in the month by trimming back our Marvell position. Later in the month, we did the same with Qualcomm on October 27, and a few days later with Nvidia and Microsoft (MSFT) .
We took more decisive action on October 30, when we closed out the Pro Portfolio’s position in Vulcan Materials (VMC) , a step that locked in an aggregate gain of just over 60%.
In terms of new blood for the Pro Portfolio, on October 8, we started a new position in Arista Networks (ANET) with a $180 target. In short order, we picked up some additional shares following an overreaction to a networking announcement by Nvidia. We have ample room to grow this position, and for that, we’ll follow our standard playbook.
In addition to those trades, we also made multiple price target revisions — all higher. We took our SuRo Capital target to $12 from $10, lifted Welltower's to $205 from $190, and upsized Palantir's to $220 from $205. This week, we increased our Alphabet target to $320 from $250 following its impressive September-quarter results. As we prepared for Halloween, we increased our price targets on October 31, taking our Apple's to $305 after raising it to $275 earlier in the month. We also lifted our target for Amazon to $310 and revised our price targets for Nvidia and Marvell to $230 and $125, respectively, to reflect a step up in 2026 AI and data center capital spending as well as Amazon’s bullish comments on Trainium chips.
We added shares of Hershey (HSY) to the Bullpen in early October as a potential play on falling commodity prices and recent price increases by the candy company. Concerns over consumer spending and corresponding demand led us to stay on the sidelines with HSY during the month, a good move given the subsequent double-digit drop in the shares. Even though the shares closed October with a deep oversold condition, we’ll continue to tread carefully with this Bullpen resident given the recent rebound in cocoa prices.
Following all of the October action, we exited the month with 26 holdings in the Portfolio – the same number we entered with. Cash levels are ~8.9% of the Portfolio’s assets, which give us a nice war chest as we move through the balance of the current earnings season to potentially pick up other names on our shopping list, such as Welltower, Arista Networks, United Rentals (URI) , and TJX Companies (TJX) , should the right opportunity present itself.
We also have room for another name in the Pro Portfolio, but as you’ve come to expect, we’ll strike when the time and risk-to-reward trade-off is right. With that in mind, we’ll continue the work we started in October, examining potential plays for robots, including surgical ones.
This Month’s Podcasts and Signals
Big discussions and insights are had during TheStreet Stocks & Markets Podcast, and in Signals, we share the latest news for the Pro Portfolio’s strategies. Here are some quick links to those conversations conducted over the last several weeks:
October 1: Government Shutdowns and the Market With Louis Llanes
October 4: Harrods Hack, Living for Next Check, Old Vs. Young & More Investing News
October 8: Our Best Picks for the Rest of 2025
October 11: Instagram TV, Pricey Groceries, the Nuclear Push, and More Investing News
October 15: The Next Market Catalysts With Noah Weidner
October 18: AI Police Reports, Auto Woe$, Disney Disruption & More Investing News
October 22: Product Returns and the Economy With ReturnPro's CEO
October 25: GM Cans EV Vans, L’Oréal Gets AI Makeover, More Investing News
October 28: Black Rock Coffee (BRCB) - Coffee Talk With Black Rock Coffee CEO Mark Davis
Some helpful links if you prefer to catch the podcast on the go, in the car, or wherever. Be sure to give it a like or thumbs up and leave a review if you’re so inclined. We’d appreciate it.
Key Global Economic Readings
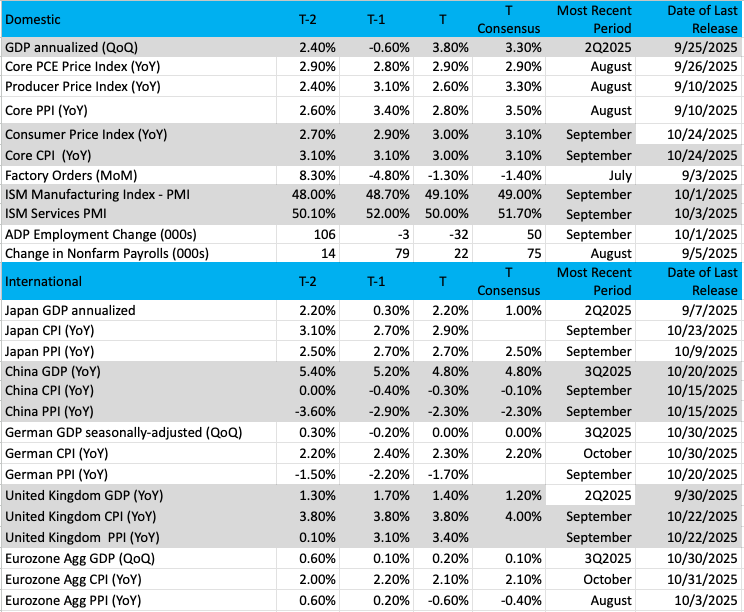
(Note: T is the most recent period, T-1 is the prior period's reading, and T-2 is two periods back, the intent being to illustrate any trends.)
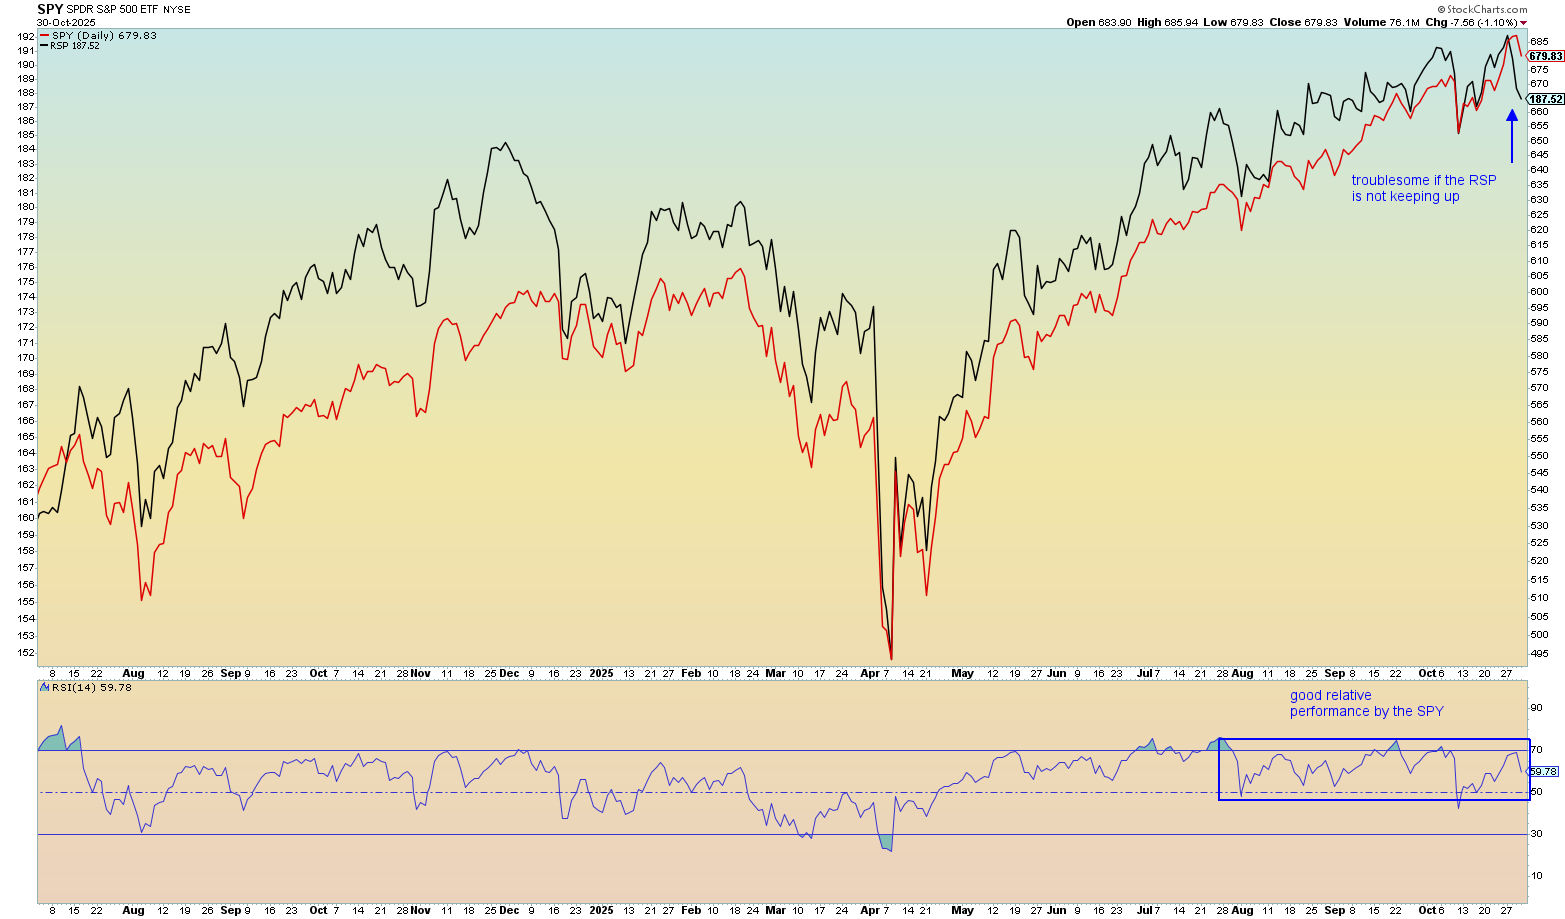
Chart of the Week: S&P 500 – Market Cap vs. Equal Weighted
In our monthly look at the (SPY) / (RSP) comparison, we can see that the SPY is clearly outperforming the RSP. Recall, the RSP ETF is an equal-weighted vehicle that pays no mind to the size of the companies involved. Hence, each component gets one vote, whereas the SPY is a cap-weighted index that favors the biggest market cap companies like Alphabet, Amazon, Apple, Nvidia, and the like.
Clearly, these big names (and not only these) have performed admirably, showing good relative strength. We can see the strong performance of the SPY simply by looking at the RSI chart at the bottom, which compares the SPY to the RSP. No question, the SPY has been performing well since the spring, but there have been moments of better results by the RSP.
What is so important about analyzing these two ETFs? If the RSP is doing better than the SPY, then we can conclude that this ETF shows broad participation by all sectors and groups in the market. This creates a healthier and even safer environment if uncertainty rises and volatility enters the market. If money is in one place and leaves it may just find a home elsewhere within the market, or so the theory goes.
With the SPY doing well, we know many investors are hiding out in the big names, and it is going to be difficult to get them to move money around if returns are "easier" to achieve in those bigger names.
Without a doubt, the bulls would like to see better action from all groups, which would spur better performance by the RSP. After 10 months’ time, the RSP is only up about 7% in 2025 vs. the SPY's return of 16%. Let’s just say the RSP has a lot of catching up to do to satisfy the bulls.
Other charts we shared with you this week were:
Monday, October 27: S&P 500: Bulls Show Where the Power Lies
Monday, October 27: First Trust Nasdaq Cybersecurity ETF (CIBR): Nothing Wrong with Cybersecurity Names
Tuesday, October 28: Microsoft (MSFT): Can Microsoft Hit $600?
Wednesday, October 29: Nvidia (NVDA): Nvidia Has a Dominant Pattern
Thursday, October 30: Amazon (AMZN): Will Amazon Deliver the Goods Tonight?
The Week Ahead
After you digest the tricks, treats, and other Halloween shenanigans, as well as weekend football, we have another jam-packed week in front of us as several pieces of October economic data come our way, and earnings season continues.
Revisiting comments from Fed Chair Powell following the October cut to the Fed funds rate, we will be very mindful of what next week’s data have to show on inflation and job creation. We’ll also be paying close attention to what is said about the dynamic between input and output costs and tracking the trend in new order figures. What we’re looking to see is whether inflation remains elevated and the degree to which job creation slowed in October. What we learn will help us contemplate the odds of another rate cut before we close out 2025.
Over the weekend, we will continue to track developments in Washington when it comes to ending the current government shutdown. Market prediction now sees the shutdown lasting 44-45 days, compared to 36 days on October 15. As we’ve shared before, the longer the shutdown, the greater the speedbump to the larger economy and consumer spending.
Here's a closer look at the economic data coming at us next week:
U.S.
Monday, November 3
· S&P Global Manufacturing PMI – October (9:45 AM ET)
· ISM Manufacturing PMI – October (10:00 AM ET)
· Construction Spending – September (10:00 AM ET)
Tuesday, November 4
· Factory Orders – September (10:00 AM ET)
· JOLTS Job Openings & Job Quits – September (11 AM ET)
Wednesday, November 5
· MBA Mortgage Applications Index – Weekly (7:00 AM ET)
· ADP Employment Change Report – October (8:15 AM ET)
· S&P Global Services PMI – October (9:45 AM ET)
· ISM Services PMI – October (10:00 AM ET)
· EIA Crude Oil Inventories – Weekly (10:30 AM ET)
Thursday, November 6
· Initial & Continuing Jobless Claims – Weekly (8:30 AM ET)
· Challenger Job Cuts – October (8:30 AM ET)
· Productivity & Unit Labor Cost (Prelim) – Q3 2025 (8:30 AM ET)
· Wholesale Inventories – September (10:00 AM ET)
· EIA Natural Gas Inventories – Weekly (10:30 AM ET)
Friday, November 7
· Employment Report – October (8:30 AM ET)
· University of Michigan Consumer Sentiment Index (Prelim) – November (10:00 AM ET)
· Consumer Credit – September (3 PM ET)
International
Monday, November 3
· China: RatingDog Manufacturing PMI – October
· Eurozone: HCOB Manufacturing PMI – October
· UK: S&P Global Manufacturing PMI – October
Tuesday, November 4
· Japan: S&P Global Manufacturing PMI - October
Wednesday, November 5
· China: RatingDog Service PMI – October
· Eurozone: HCOB Service PMI – October
· UK: S&P Global Service PMI – October
· Eurozone: Producer Price Index - September
Thursday, November 6
· Japan: S&P Global Service PMI - October
· Eurozone: Retail Sales – September
· UK: Bank of England Interest Rate Decision
Friday, November 7
· China: Imports/ Exports – October
· Germany: Imports/Exports - September
This past week, 10 Pro Portfolio constituents reported their quarterly results, and as hard as it may be to believe, next week, we have another eight coming our way. By the end of next week, we will have just four holdings – Costco, Marvell, Nvidia, and TJX – yet to report. All should report their quarterly results and provide a fresh look at their business before Thanksgiving.
Mixed in with the economic data coming, it’s going to be a busy week, but rest assured, we have you covered. On the one hand, just like we did this week, it means we’ll revisit position price targets, panic points, and ratings as required. On the other hand, we’ll continue to “connect the dots” we collect across the volume of other companies reporting. One benefit, albeit a minor one, that we have is that after this week’s bonanza, there are no significant holdings in the S&P 500 reporting next week. Also, Chris will be back in NYC next week with Freedom Capital’s Jay Woods returning to the Stocks & Market Podcast.
Here's a closer look at the earnings reports coming at us next week:
Monday, November 3
· Open: Freshpet (FRPT), Idexx Labs (IDXX), onsemi (ON).
· Close: Air Lease (AL), Clorox (CLX), Denny’s (DENN), Harmonic (HLIT), IAC Inc. (IAC), Navitas Semiconductor (NVTS), Palantir Technologies (PLTR), Qorvo (QRVO), Realty Income (O).
Tuesday, November 4
· Open: ADM (ADM), ADT (ADT), Eaton (ETN), Ferrari (RACE), First Watch Restaurant Group (FWRG), Henry Schein (HSIC), Hertz Global (HTZ), Marriott (MAR), Martin Marietta (MLM), Molson Coors (TAP), Shopify (SHOP), Spotify (SPOT), Stanley Black & Decker (SWK), TopBuild (BLD), Yum! Brands (YUM), Zoetis (ZTS).
· Close: AMD (AMD), Arista Networks (ANET), Axon Enterprise (AXON), Cava Group (CAVA), GoodRX (GDRX), International Flavors (IFF), Lumentum (LITE), Pinterest (PINS), Rapid7 (RPD), Skyworks (SWKS), Super Micro Computer (SMCI), SuRo Capital (SSSS), Tanger Factory (SKT), Toast (TOST), Trex (TREX).
Wednesday, November 5
· Open: Cinemark (CNK), Dine Brands (DIN), Johnson Controls (JCI), Kennametal (LMT), Klarna (KLAR), McDonald’s (MCD), New York Times (NYT), Steven Madden (SHOO).
· Close: ARM Holdings (ARM), CF Industries (CF), Chime (CHYM), Coty (COTY), DoorDash (DASH), Dutch Bros (BROS), elf Beauty (ELF), Fastly (FSLY), Fortinet (FTNT), Interparfums (IPAR), Joby Aviation (JOBY), Lyft (LYFT), Qualcomm (QCOM), Snap (SNAP).
Thursday, November 6
· Open: Air Products (APD), Clear Secure (YOU), ConocoPhillips (COP), Cummins (CMI), DuPont (DD), Granite Construction (GVA), Hyatt Hotels (H), Insulet PODD), Nomad Foods (NOMD), Parker-Hannifin (PH), Ralph Lauren (RL), Rockwell Automation (ROK), Tapestry (TPR).
· Close: Affirm (AFRM), Airbnb (ABNB), AMN Healthcare (AMN), Bock (XYZ), DraftKings (DKNG), Peloton (PTON), Rackspace (RXT), Synaptics (SYNA), Trade Desk (TTD), Universal Display (OLED), Wynn Resorts (WYNN).
Friday, November 7
· Open: AMC Networks (AMCX), CNH Industrial (CNHI), Duke Energy (DUK), Wendy’s (WEN).
Portfolio Investor Resource Guide
· Economic Data: Here's a List of Links to the Key Economic Data We Closely Watch
· Investing Terminology: 16 Key Terms Club Members Should Know
· 10-Ks: Want to Know About a Stock? Read the Company's Reports
· 10-Qs: Unlock the Numbers and Key Information Behind Your Stock With the 10-Q
· Income Statement: Our Cheat Sheet to Understanding This Financial Document
· Balance Sheet, Cash Flow Statements, and Dividends: How to Know If a Company Is Off-Kilter? Read Its Balance Sheet
· Valuation Metrics: Everyone Wants a Value. Here's How Investors Can Find
· Thematic Investing 101 Webinar
The Portfolio Ratings System
1 - Buy Now (BN): Stocks that look compelling to buy right now.
2 - Stockpile (SP): Positions we would add to on pullbacks or a successful test of technical support levels.
3 - Holding Pattern (HP): Stocks we are holding as we wait for a fresh catalyst to make our next move.
4 - Sell (S): Positions we intend to exit.
ONES
Amazon AMZN; $244.22; 881 shares; 3.78%; Sector: Consumer Discretionary
UPDATE: After trading sideways between $210-$238 since early August, shares of Amazon (AMZN) broke out of that range to the upside in October following the company’s consensus-shredding September-quarter results. In response to those results, the re-acceleration in Amazon Web Services (AWS), continued gains in the high-margin advertising business, and strong prospects for Amazon to pick up incremental market share during the holiday shopping season and beyond, we lifted our AMZN price target to $310 from $260. When it comes to Amazon and its earnings prospects, the big question is what’s ahead for AWS, given that it drives around 65% of Amazon’s operating income. During the earnings call, Amazon management said that AWS backlog grew to $200 billion exiting the September quarter. Moreover, that figure does not include several unannounced new deals in October, which together are more than AWS's total deal volume for all of the September quarter. Measured against the $33 billion in AWS revenue for the September quarter, that tells us the company has incredible visibility, but it also means that, like others, it could have booked more revenue if it had more available capacity. On that topic, Amazon spent $34.2 billion in capex during the quarter, bringing its total year-to-date to $89.9 billion. With the company targeting total capex spending of $125 billion this year, it means that spending will take another leg up in the current quarter. While we may see a period of digestion, as we pass that, we should see the return of favorable incremental margins at AWS. In our alert discussing the company’s earnings and our revamped price target, we discussed why short-covering would likely pop the shares near-term, only to fade somewhat in the coming days. Folks who are looking to capitalize on our One rating and can be patient are likely to see an even better risk-to-reward pick-up point. In terms of our AMZN panic point, we boosted it to $210, and as the shares move toward our revised price target, we’ll inch up that panic point in response.
October Price Change: 11.2%; Yield: 0.0%
INVESTMENT THESIS: We believe the upside will result from Amazon's continued e-commerce dominance, AWS's continued leadership in the public cloud space, and the ongoing growth of the company's advertising revenue stream, which feeds off Amazon's eCommerce business. Additionally, we think profitability will continue to improve as AWS and advertising account for a larger portion of total sales, as both these segments sport higher margins than the eCommerce operation. While we believe the increasing share of the revenue from these higher margin businesses will be key to driving profitability longer-term, we think margins on eCommerce stand to improve as the company's infrastructure is further built out and economies of scale further kick in. The embedded call option is that management is always looking to enter a new space and generate new revenue streams.
Target Price: Reiterate $310; Rating: One
Panic Point: $210
RISKS: High valuation exposes the stock to volatile swings, e-commerce has exposure to slower consumer spending and competition, potential headwinds resulting from new e-commerce regulation in India, and management is not scared to invest aggressively for growth, which can at times cause volatile reactions as near-term concerns arise relating to the impact on margins.
Axon Enterprise AXON; $732.23; 308 shares; 3.96%; Sector: Aerospace & Defense
UPDATE: Shares of Axon (AXON) were volatile in October, but after assessing the factors behind that, we used that condition to pick up more shares for the Portfolio at $658.99 on October 16. In making that move, we took advantage of reports that the Trump administration was contemplating prodding defense companies to do fewer stock buybacks and more R&D work. That comment rippled through companies found in the iShares U.S. Aerospace and Defense ETF (ITDA), which includes AXON shares. As we noted at the time of our latest purchase, with $2.2 billion in cash and equivalents on its balance sheet, Axon could easily complete the $16.3 billion remaining on its February 2016 $50 million buyback program. We’ll continue to focus on the growing recurring revenue nature of its business mix, and $10.7 billion in future contracted bookings vs. the $2.7 billion and $3.2 billion Wall Street expects Axon to deliver this year and in 2026. That includes the positive mix shift toward higher-margin software and services. We recognize that the longer the government shutdown goes on, we could see some impact on the federal business that Axon does have. But let’s remember the company’s exposure to state and local spending is far greater, with the federal government considered a target market for its Taser, body cameras, drones, and services. As we see it, AXON shares were carried lower with a “guilt by association” comment that wasn’t germane to them, and they have since recovered, leaving them to finish October up nicely in the green. Since that trade, we’ve shared articles discussing police department adoption of AI to help drive police productivity, and we expect to hear more of the same when Axon reports after the market close on November 4. Ahead of that, we’ll be mining comments from competitor Motorola Solutions when it reports on October 30. We’ll also mark our calendars for upcoming Axon presentations at the 2025 RBC Global TIMT Conference on November 18 and the 6th Annual Needham Tech Week on November 20. For us, the Axon story continues to be one centered on the mix shift toward the higher-margin, recurring revenue services business, as well as continued growth for its hardware business in federal, corporate, and international markets.
October Price Change: 2.0%; Yield: 0.0%
INVESTMENT THESIS: Axon Enterprise develops, manufactures, and sells conducted energy devices and cloud-based digital evidence management software designed for use by law enforcement, corrections, military forces, private security personnel, and private individuals for personal defense. The company operates in two segments: Taser (recently renamed Connected Devices) and Software & Sensors (recently renamed Software & Services). Taser develops and sells CEDs used for protecting users and virtual reality training. Software & Sensors manufactures fully integrated hardware and cloud-based software solutions such as body cameras, automated license plate reading, and digital evidence management systems. Axon delivers its products worldwide and gets most of its revenue from the United States. According to Mordor Intelligence, the wearable and body-worn cameras market on its own was valued at $1.62 billion in 2020 and is expected to reach $424.63 billion by 2026. Public safety organizations are increasingly adopting cloud solutions, leading to significant spending in this area. The digital spending in public safety is projected to reach $201 billion by 2027.
Target Price: Reiterate $860; Rating: One
Panic Point: $635
RISKS: Manufacturing and supply chain, competitive factors, government regulation, and technology change.
Costco Wholesale COST; $911.45; 228 shares; 3.65%; Sector: Consumer Staples
UPDATE: We continue to receive data points indicating Costco (COST) continues to win consumer wallet share, but the shares were little changed in October. Frustrating, especially given the company’s September sales figure that rose 8% year over year, with adjusted comp sales figure up 6.0%, including the U.S. up 5.0%. Impressive on its own, especially as Costco lapped difficult year-over-year comparisons, but comparing that figure and recent ones against those found in quarterly sales from Albertsons and others confirms Costco continues to take market share. That led us to scoop up more COST shares for the Portfolio on October 9 at $932.31. After that trade, validating our decision was the Fed’s Beige Book report that found lower- and middle-income households continued to seek discounts and promotions in the face of rising prices and elevated economic uncertainty. In our view, the longer the government shutdown, the more likely we will see consumers turn to Costco to stretch their spending dollars, especially during the holiday season. Meanwhile, Costco also looks to accelerate that footprint expansion by adding 30 net new locations over the coming 12 months, a tad faster than the 24 it added over the last year. We see that effort continuing to drive membership higher, which will grow the membership fee revenue stream and increase Costco’s operating income along the way. We continue to favor that differentiated business model, one that sets Costco apart from other retailers, and that means being patient with the shares. Costco will report its October sales on November 5 and pay its next $1.30 per share quarterly dividend on November 15.
October Price Change: -1.5%; Yield: 0.57%
INVESTMENT THESIS: We like Costco's long-term prospects, driven by a club-based operating model that focuses on volumes, not margins, and therefore offers its customers a value proposition of everyday low prices. The strength of this model has created an incredibly loyal customer base with low churn and continued share gains in both brick-and-mortar and e-commerce. This is a global concept, evidenced by the strength of sales both in the U.S. and abroad, which includes an emerging China opportunity. We see the company's membership model as a key differentiator versus other retailers, and its plans to open additional warehouse locations in the coming quarters should drive retail volumes and the higher-margin membership fee income as well. We also appreciate management's approach to capital returns and their willingness to return cash.
Target Price: Reiterate $1,200; Rating: One
Panic Point: $880
RISKS: Inability to pass through higher costs, fuel prices, weaker consumer, and membership churn.
Eaton Corp. ETN; $381.56; 593 shares; 3.98%; Sector: Industrials
UPDATE: Shares of Eaton (ETN) continued to chug higher in October, adding to the gains registered during the first nine months of the year. The outlook for data center infrastructure and the larger demand for electrical capacity remains shockingly strong. Companies will spend $375 billion globally in 2025 on AI infrastructure, investment bank UBS estimates. That is projected to rise to $500 billion next year. Brookfield Asset Management estimates that AI infrastructure will sop up $7 trillion over the next 10 years. Deloitte sees U.S. power sector investments reaching $1.4 trillion between 2025 and 2030. This six-year outlay is equivalent to the total capital expenditure of the U.S. power sector over the preceding 12 years, underscoring the challenge and the opportunity that lies ahead. The ICF projects significant increases in U.S. electricity demand over the next 25 years, with demand rising 25% by 2030 and 78% by 2050. In the near term, the U.S. Energy Information Administration (EIA) has raised its projections for electricity consumption in the country, citing a spike in power demand from commercial sectors — especially data centers — as a key driver. In its latest update of the Short-Term Energy Outlook (STEO), the EIA said it expects total U.S. electricity demand to rise from 4,097 billion kilowatt-hours (kWh) last year to 4,193 billion kWh in 2025, and 4,283 billion kWh in 2026. As we see the mix shift move toward AI data centers, we should see Eaton’s dollar per megawatt content rise, given greater power density, larger volumes of electrical equipment, but also greater cooling requirements. In our view, that is the driving story behind the opportunity in Eaton’s shares and one we aim to capture as shareholders. A more dovish Fed policy could be an added tailwind in the coming quarters as it would reduce project hurdle rates, fostering incremental construction activity. We recognize there will be some modest margin pressure, largely on the company’s Vehicle segment (10% of revenue), due to tariffs, but we will continue to evaluate that as trade deals are announced. Offsetting that is improving demand for the aerospace market, which accounts for 15% of Eaton’s revenue stream. We see that setting the stage for an upbeat earnings report from Eaton on November 4. Based on the company’s updated outlook, book-to-bill and backlog figures, we’ll update our $420 price target as needed.
October Price Change: 2.0%; Yield: 1.09%
INVESTMENT THESIS: Eaton is an intelligent power management company that makes products for data center, utilities, industrial, commercial, machine building, residential, aerospace, and mobility markets. That business is positioned to capitalize on the mega trends of electrification, energy transition, and digitalization. We see Eaton helping address the power pain point created by data center, EV charging infrastructure, and other drivers of electricity demand. Research estimates that data center power demand will grow 160% by 2030, accounting for 3% to 4% of global power, up from 1% to 2% today. Data centers will use 8% of U.S. power by 2030, compared with 3% in 2022.
Target Price: Reiterate $420; Rating: One
Panic Point: $325
RISKS: Raw material costs, labor costs, end market volatility, and government legislation.
Meta Platforms META; $648.35; 311 shares; 3.54%; Sector: Communication Services
UPDATE: Shares of Meta (META) were tracking for a sharp move higher in the second half of October, but that was cut short by the capital spending comments that accompanied its September-quarter results and called for notably larger capex dollar growth in 2026 than 2025. That ramp and rising opex spending are going to restrain expected near-term margin improvement even as Meta continues to leverage AI to improve advertising results and pricing across its multiple platforms. To keep it simple, the more time on its products, the more ads its users see, and the more advertising revenue Meta garners. But let’s also keep in mind the positive impact on ad pricing AI and video is having. During Q3 2025, Meta’s family of apps' ad revenue was $50.1 billion, up 26% while the total number of ad impressions served across our services increased 14%. To be clearer, in Q3 2025, the average price per ad rose 10% year over year compared to 9% in Q2 2025. Not only is that important for Facebook and Instagram, but let’s remember also for the advertising opportunities on Threads and WhatsApp. Ads are now running globally on Threads and should improve as Meta follows its typical monetization playbook. Within WhatsApp status, Meta is continuing to gradually introduce ads and expects to complete the rollout next year. Greater monetization across more platforms that reach the company’s total daily active user base of 3.54 billion is a combination for higher revenue and eventually higher margins as opex levels return to more normalized levels. Following that earnings report, we used the subsequent pressure on META shares to scoop more up for the Portfolio as well as upgrade our rating to One from Two.
October Price Change: -11.7%; Yield: 0.32%
INVESTMENT THESIS: Meta segments its business between Family of App Products, which includes Facebook, Instagram, Messenger, Threads, and WhatsApp, and Reality Labs Products, which includes its metaverse and investments and future product R&D. Family of Apps accounts for about 99% of the company's revenue and 100% of company operating profit. Substantially all of Meta’s revenue is currently generated from advertising on Facebook and Instagram. Family daily active people (DAP) were 3.54 billion on average for the September 2025 quarter. Meta expects to spend $70 billion to $72 billion on capex in 2025, a significant increase year over year, with most of this spending focused on AI infrastructure and initiatives. Meta is positioned to benefit from the ongoing shift toward digital advertising and the adoption of AI across its product offerings. We recognize Meta is ramping up capital spending as part of the current AI arms race, but we see that as an investment that should drive productivity in its core advertising business. As the company harvests that investment, we could see a step up in margins, much like we saw in 2023.
Target Price: $850; Rating: One
Panic Point: $595
RISKS: Ability to add and retain users and user engagement; marketing spend; new products or changes to existing ones; competitive risk, geopolitical risk.
Nvidia Corp. NVDA; $202.49; 1,120 shares; 3.99%; Sector: Technology
UPDATE: Following the double-digit gain registered in Q3 2025, shares of Nvidia (NVDA) continued to power ahead in October, leaving them up nearly 50% on a year-to-date basis. Fueling their October move higher was the significant jump in High Performance Computing in September-quarter results from Taiwan Semi and its outlook for that segment not only in the current quarter but following ones as well. Microsoft shared that its data-center capacity issues will persist longer than previously indicated, running well into 2026. Following Microsoft’s massive incremental $250 billion Azure win with OpenAI, odds are that capacity constraint will persist even longer. Sure enough, that led Microsoft to lift its capital spending levels. As we learned about that, Meta, Google, and Amazon also lifted their planned capital spending levels for this year. The four also telegraphed even higher capex levels in 2026. Backstopping that outlook was Oracle’s massive RPO increase that it announced on September 9. To that, we can add recent comments from Open AI CEO Sam Altman, which reaffirmed the company’s $850 billion expansion plan, sharing that even that pace will “look slow” given surging demand. For context, that is nearly half of the $2 trillion in global AI infrastructure forecasted by HSBC and suggests that forecast is likely to prove to be conservative. In late October, NVDA shares were goosed further by reports President Trump would be discussing Blackwell chips with President Xi, and Nvidia CEO Jensen Huang shared expectations for $500 billion in AI chip orders and announced plans to build seven new supercomputers for the U.S. government. That surge pushed NVDA shares past a 4.5% position for the Portfolio, and at that point portfolio discipline kicked in. On October 29, we locked in a massive gain of just under 138% on the relatively small slug of NVDA shares we sold. Given the favorable multi-year outlook for AI and data center capital spending as AI adoption and usage continue, we purposely maintained a sizable NVDA position in the Portfolio. Aggregate comments about 2026 AI, data center, and cloud capex levels led us to boost our NVDA target to $230 from $200 on October 31. Upcoming data points we’ll be watching include October revenue reports from Taiwan Semiconductor and Foxconn, and other indicators of AI adoption.
October Price Change: 8.5%; Yield: 0.02%
INVESTMENT THESIS: Nvidia is well-positioned to benefit from ramping AI and data center spending. The company pioneered accelerated computing to help solve the most challenging computational problems. Nvidia is now a full-stack computing infrastructure company with data-center-scale offerings that are reshaping the industry. The company's full stack includes the foundational CUDA programming model that runs on all Nvidia GPUs, as well as hundreds of domain-specific software libraries, software development kits, or SDKs, and Application Programming Interfaces, or APIs. This deep and broad software stack accelerates the performance and eases the deployment of Nvidia accelerated computing for computationally intensive workloads such as artificial intelligence, model training and inference, data analytics, scientific computing, and 3D graphics, with vertical-specific optimizations to address industries ranging from healthcare and telecom to automotive and manufacturing. Nvidia reports in two business segments: Compute & Networking and Graphics. The Compute & Networking segment (78% of revenue, 85% of operating income) is comprised of Data Center accelerated computing platforms and end-to-end networking platforms, including Quantum for InfiniBand and Spectrum for Ethernet; NVIDIA DRIVE automated-driving platform and automotive development agreements; Jetson robotics and other embedded platforms; Nvidia AI Enterprise and other software; and DGX Cloud software and services. The Graphics segment (22% of revenue, 15% of operating income) includes GeForce GPUs for gaming and PCs, the GeForce NOW game streaming service and related infrastructure; Quadro/NVIDIA RTX GPUs for enterprise workstation graphics; virtual GPU, or vGPU, software for cloud-based visual and virtual computing; automotive platforms for infotainment systems; and Omniverse Enterprise software for building and operating metaverse and 3D internet applications.
Target Price: $230; Rating One
Panic Point: $160
RISKS: Market and interest rate risk, credit risk, country risk, and operational risk, including cybersecurity.
Palantir Technologies PLTR; $200.47; 1,100 shares; 3.88%; Sector: Financial Services
UPDATE: Following the cumulative Q3 2025 move higher of more than 33%, shares of Palantir (PLTR) continued to gain ground in October. In early September, we added to our PLTR position near $160, and later that month, we lifted our PLTR price target to $205, a move that continued a series of previous price target increases. During October, we continued to receive signals for increasing defense spending levels but also rising enterprise adoption and usage of AI. Those data points, along with company-specific development for Palantir, including expanded relationships with Lumen Technologies and Snowflake, as well as a new partnership with Poland’s defense industry, led us to increase our price target to $220 this week. We also lifted our panic point to $150 from $145, and our pickup point to $172 from $160. As we explained in that alert, while neither Poland nor Palantir mentioned the size of the deal, given the rising defense spending levels outside the U.S. noted above, this is likely the first such announcement for Palantir. We’ll look to see what additional comments Palantir makes about this relationship next week, when it reports its quarterly results on November 3. We’ll also be tracking total contract value and remaining performance obligation figures exiting the September quarter, comparing them to those at the end of the June 2025 and March 2025 quarters. What we’re looking for is numerical confirmation of companies, governments, and other entities' adoption of Palantir’s solutions. Based on what we learn, if we need to fine-tune our new PLTR price target, we’re up to the task.
October Price Change: 9.9%; Yield: 0.0%
INVESTMENT THESIS: Palantir Technologies specializes in big data analytics and builds software platforms that help organizations integrate, analyze, and make sense of vast amounts of data for both commercial and government clients. While much has been made about the company’s exposure to the federal government, its software is used across 90 industries, and the larger global government sector accounted for 55% of revenue last year. The balance was from the commercial sector. Exiting Q2 2025, Palantir’s Commercial remaining deal value (RDV) stood at $2.8 billion, up from $1.79 billion exiting 2024. We will continue to monitor Palantir’s RDV and deferred revenue metrics, but in our view, key items to watch will be the continued diversification of its customer base across industries and increasing revenue per customer. Both have made considerable progress in H1 2025, with Commercial revenue reaching 58% of total revenue in Q2 2025. Because we are still in the relatively early innings of AI adoption, we are inclined to be long-term owners of PLTR shares.
Target Price: $220; Rating: One
Panic Point: $150
RISKS: Economic and IT budget spending risk, technology risk, competition and competitive pressures, and customer acquisition risk.
ServiceNow NOW; $919.28; 215 shares; 3.47%; Sector: Technology
UPDATE: After a tough slog in August, shares of ServiceNow (NOW) rebounded in September, and despite some initial chop in October, exited the month nicely higher. While the shares have fallen prey to concerns over AI adoption and enterprise spending, we remained bullish given the volume of signals we’ve collected that pointed to rising spending on AI and cloud. Quarterly results and guidance from ServiceNow this week topped consensus expectations, led by another quarter of more than 20% growth for the company’s core subscription revenue stream. Current remaining performance obligations (CRPOs) reached $11.35 billion exiting the quarter, up 21% year over year. And total RPOs hit $24.3 billion, up 24% year over year. Those gains reflect a combination of customer wins, increasing customer penetration, and the impact of AI adoption by those customers. Digging into ServiceNow’s quickly filed 10-Q for the quarter, management sees 47% of that total RPO being recognized as revenue in the coming 12 months. Against that kind of visibility, the prospects for further margin leverage as AI becomes a greater part of the revenue mix are favorable. To us, the combination of rising revenue and margin expansion is a combination we can get behind. We continue to think we are only in the third or fourth inning, at most, when it comes to AI adoption and usage. We will continue to monitor those levels, and should we see the incremental growth rate begin to slow, that could be a reason to revisit our position in NOW shares. For now, our NOW target remains $1,200. ServiceNow also announced a 5-1 stock split, which we see as more cosmetic in nature, but a move that could help stir incremental investor interest. The next-known catalyst will be management’s presentation at the RBC Global TIMT Conference on November 18.
October Price Change: -0.1%; Yield: 0.0%
INVESTMENT THESIS: The addition of ServiceNow adds exposure to the enterprise as it deploys AI-enabled solutions across its enterprise workflow platform. The company’s “Now Platform” is a cloud-based solution with embedded AI and machine learning (ML) capabilities that help unify and digitize workflows, driving productivity. At the heart of it, the company’s platform automates workflows across an entire enterprise by connecting disparate departments, systems, and silos in a seamless way to unlock productivity. ServiceNow counts more than 8,100 global customers, including 85% of the Fortune 500, with 97% of its revenue from subscriptions that have notched a 98% renewal rate. During the March 2025 quarter, ServiceNow also announced plans to acquire Moveworks, which offers front-end AI assistant and enterprise search technology, and Logik.ai, which provides AI-powered, and composable configure, price, and quote solutions for sales teams. We see these moves augmenting its offering and helping pave the way for further adoption of AI and subscription-based revenue.
Target Price: Reiterate $1,200; Rating: One
Panic Point: $825
RISKS: Industry and economic risk, competition and competitive pressures, and acquisition risk.
SuRo Capital SSSS; $10.19; 22,115 shares; 3.96%; Sector: Financial Services
UPDATE: Shares of SuRo Capital (SSSS) trended lower in October, which was a modest setback, but based on the company’s preliminary Q3 2025 portfolio update, we see brighter days ahead. Exiting the third quarter of the year, the net asset value (NAV) per share of SuRo's portfolio is estimated to be between $9.00-$9.50, up from $9.18 at the end of the June quarter. The same update revealed that as of September 30, it monetized less than 20% of its initial investment in CW Opportunity 2, LP, the vehicle by which it is directly invested in CoreWeave (CRWV) shares. This is a welcome surprise as the consensus view was that SuRo was likely to have cleared out its CRWV position in mid-August following the IPO lock-up expiration when CRWV shares were trading between $90-$100. Another reason we should see that NAV per share value tick higher in the current quarter is that it continued to value SuRo’s position in OpenAI using the previously confirmed $300 billion post-money valuation. Why? The recent secondary sale of OpenAI shares, which valued the company at $500 billion, was concluded after the quarter's end. That suggests when SuRo reports its September-quarter results on November 4, it will provide a more current take on the NAV for its investment portfolio. Realizing this, we bumped up our price target to $12 from $10 on October 9. What SuRo did not mention in that update was anything about its next dividend payment to shareholders. That eventual announcement will be a catalyst for the shares, and one that has us looking to add more shares to our holdings near-term. In addition to the aforementioned CRWV position, Suro has around 75% of its position remaining in GrabAGun Digital Holdings (PEW), which is another potential source of dividend funding, as that position is also monetized. The late-October news that SoftBank approved a second $22.5 billion investment in OpenAI, a key holding in SuRo’s portfolio, provided OpenAI complete a corporate restructuring for an eventual IPO, added a fresh reason why we remain bullish on SSSS shares. Shortly thereafter, OpenAI announced that expected corporate restructuring, putting it that much closer to an eventual IPO. On October 30, we added to the Portfolio’s position in SSSS following reports that OpenAI is preparing to file for an initial public offering as soon as next year, which could give the company a market capitalization of $1 trillion. That would be double the most recent valuation of $500 billion following its latest capital raise and should drive another leg up in SuRo’s net asset value per share as well as the continuation of its dividend stream.
October Price Change: 13.2%; Yield: 2.45%
INVESTMENT THESIS: SuRo Capital is a business development company (BDC) that invests in high-growth, venture-backed private companies. As SuRo monetizes those portfolio investments through either IPO or M&A transactions, it must pay out most of its earnings to shareholders in the form of dividends. What’s important to factor into our thinking is that SuRo’s strategy isn’t to hold public company investments but rather to monetize them following the lock-up expiration. Sometimes this can be immediate, and sometimes it can be in stages, but when that monetization occurs, it triggers dividend payments. And because a BDC must pay out at least 90% of its taxable income through dividends to shareholders, there is the possibility of a special dividend to hit that qualifying threshold late in the year. As we think about this, it means that we should focus on total return with SSSS, which is defined as capital gains in the shares plus dividends received while owning them. What this means is even if we see SSSS shares trade sideways or move lower, depending on the size of the dividend payments in the coming quarters, the position’s total return could still be sizable for the Pro Portfolio. SuRo's portfolio holdings at the end of June included CoreWeave, ServiceTitan, OpenAI, Liquid Death, Whoop, and fintech company Plaid, as well as roughly 30 other holdings.
Target Price: $12; Rating: One
Panic Point: $7.50
RISKS: Industry and economic risk, competition and competitive pressures, and acquisition risk.
Universal Display OLED; $147.28; 1,478 shares; 3.83%; Sector: Technology
UPDATE: After rebounding in September, shares of Universal Display (OLED) were choppy in October but ultimately finished the month higher. The upturn for the shares came in mid-October amid a flurry of positive data points and other supporting items. That included positive commentary on Apple’s expected foldable iPhone in 2026, and data from IDC that smartphone shipments in Q3 2025 rose 9.5% compared to the prior quarter and gained ground on a year-over-year basis as well. Building on that, September quarter-end market figures from Taiwan Semi and that implied guidance confirmed a meaningful pick-up in smartphone volumes. Helping confirm that, Apple guided its iPhone revenue to climb double-digits year over year in the current quarter, and Samsung said it sees continued strength in its premium and flagship models, including its foldables. This week, reports confirm Apple is preparing major changes to its MacBook Air, iPad mini, and iPad Air lines, with a plan to give the devices organic light-emitting diode displays. While we recognize this has been a frustrating position for some, the overwhelming preponderance of data point to the accelerating adoption of organic light-emitting diode displays in increasingly larger formats for the smartphone market, as well as the PC and monitor markets. We see that accelerating as more foldable products come to market in the next year, and long term, the development of blue rounds out red and green, paving the way for the eventual general illumination market (white) — just like we saw with LEDs. All of that leads us to see an upbeat earnings report from Universal Display after the market close on November 6.
October Price Change: 2.5%; Yield: 1.22%
INVESTMENT THESIS: Universal Display focuses on the development and commercialization of organic light-emitting diode (OLED) technologies and materials for use in display and solid-state lighting applications. OLED displays are capturing a growing share of the display market, especially in the mobile phone, television, monitor, wearable, tablet, notebook, personal computer, augmented reality (AR), virtual reality (VR), and automotive markets. This adoption reflects advantages over competing display technologies concerning power efficiency, contrast ratio, viewing angle, video response time, form factor, and manufacturing cost. Universal Display's business strategy is to develop new OLED materials and sell existing and new materials to product manufacturers for display applications, such as mobile phones, televisions, monitors, wearables, tablets, portable media devices, notebook computers, personal computers, and automotive applications, and specialty and general lighting products. The company also looks to license its OLED material, device design, and manufacturing technologies to those manufacturers. As such, Universal Display has a significant portfolio of proprietary OLED technologies and materials with more than 5,500 patents issued and pending worldwide.
Target Price: Reiterate $200; Rating: One
Panic Point: $120
RISKS: Patent and Intellectual property protection; maintaining OLED manufacturing and customer relationships; technology risk; market risk.
Waste Management WM; $199.77; 1,000 shares; 3.51%; Sector: Industrials
UPDATE: We continued to slowly build up the Portfolio’s exposure to Waste Management (WM) shares in August and September, using the modest Q3 2025 decline to our advantage. However, when WM reported its September-quarter results, the strength in the core waste collection business was tempered by the ongoing transition and integration of its Healthcare Solutions business. That led the shares to become a larger drag on the Portfolio during October. We would characterize the issues at Healthcare Solutions as frustrating but not out of the ordinary, as WM plants its flag in the growing medical waste business. As we discussed in our comments about Labcorp’s September-quarter results, volumes are growing, and the aging population is a demographic tailwind for testing, which also makes it one for medical waste. Given WM’s ability to integrate waste acquisitions and deliver continued margin improvement at both the legacy waste collection business and the medical waste one, we’re inclined to be patient as they do the same here, and drive the company’s overall margins, cash flow, and EPS higher. Helping us maintain that patience, management gave some nice color when it comes to the 2026 free cash flow bogie near $3.8 billion next year. After having pursued an accelerated investment in trucks, including automated ones, over the last three years, that investment in 2026 should return to more normalized levels. On the acquisition front, as of now, management sees a slower pace of acquisitions between $100 million-$200 million compared to $450 million-$500 million this year. Reading between the lines, we suspect that means we are likely to see another dividend increase and potentially something on the share-repurchase front. We discussed that, as the dust settled, in keeping with our One rating, we would be buyers of WM shares, and on October 30, we bought a slug of shares for the Portfolio at $200.13.
October Price Change: -9.5%; Yield: 1.65%
INVESTMENT THESIS: Waste Management’s core business is the inelastic waste removal business for residential, enterprise, and other customers. The company has built its footprint through a series of acquisitions and excelled at wringing costs out of them, driving free cash flow, dividends, and funding incremental acquisition activity. While the residential business is sticky, the commercial business should continue to benefit from non-residential construction activity. Margins should continue to inch higher due to disciplined pricing and increasing use of automation. We are in the early days of WM Healthcare Solutions, but we see the business growing as management integrates and cross-sells against its core business and flexes the ability to integrate nip-and-tuck acquisitions as it has at the core waste business. Here, too, we see room to consolidate a fragmented industry, which makes this a natural fit for Waste Management.
Target Price: $255; Rating: One
Panic Point: $190
RISKS: Industry and economic risk, competition and competitive pressures, and acquisition risk.
TWOS
Alphabet GOOGL; $281.19; 867 shares; 4.29%; Sector: Communication Services
UPDATE: Following the double-digit increase posted by Alphabet (GOOGL) in September, we signaled that we may need to address our price target once the company reported its September-quarter results and shared its outlook for the current quarter. That earnings report was a consensus-crushing one and led us to lift our GOOGL target to $320 from $250. While admittedly some of that increase was us catching up, we also accounted for the improved outlook for Google Cloud and continued gains in Search and YouTube as the company leans even more on AI. By the numbers, Google’s September-quarter advertising revenue rose more than 12% due to continued strength in Search and YouTube monetization, while Google Cloud revenue climbed 33.5% year over year, indicating continued market share gains. Google Cloud’s backlog hit $155 billion exiting September, up from $106 billion at the end of December. During the earnings call, management shared some figures that help frame that rapid growth. The number of new GCP customers increased by nearly 34% year over year; year to date, the number of $1 billion deals inked was larger than those in 2023 and 2024 combined; and over 70% of existing Google Cloud customers are using Google AI products. Given that jump in backlog and a tight cloud demand-supply environment that is expected to continue into 2026, Google now sees 2025 capex in the range of $91 billion to $93 billion, up from the prior estimate of $85 billion, with a “significant increase” planned for 2026. As that investment period winds down, we should see better margins and EPS generation ahead, especially as Google ups its YouTube monetization efforts. The positive reaction to that earnings report led GOOGL shares to close October up high single-digits, pushing the year-to-date return to more than 48%. However, exiting the month, GOOGL shares were once again back in an overbought condition, and that led us to keep our Two rating intact.
October Price Change: 15.7%; Yield: 0.30%
INVESTMENT THESIS: We believe that while search and digital ad dominance are what will carry the shares in the near-to mid-term, longer-term, it is the company's artificial intelligence "moat" that will provide for new avenues of growth. Exiting the March 2025 quarter, Alphabet reported over 270 million paid subscriptions across YouTube and Google One. YouTube Music and Premium alone reached 125 million subscribers globally. AI is what has made the company's search, video, and targeted ad capabilities best-in-class and is the driving force behind the company's success in voice (Google Home) and autonomous driving (Waymo). Furthermore, we believe it is this AI expertise that will also make the company more prevalent in other industries, including healthcare via its subsidiary Verily, as AI and machine learning continue to disrupt operations across industries. Exiting the March 2025 quarter, across all its products, Alphabet had 0.5 billion users using its Gemini models. Adding to our positive view of the company's future opportunities, we believe that Alphabet's free cash flow generation and solid balance sheet set it apart and are what will allow the company to continue taking chances on far-out, ground-breaking, and potentially world-changing projects, as well as fund capital returns to shareholders. We will continue to monitor advertising spend as well as the competitive landscape for the company’s core Search and Advertising business.
Target Price: Reiterate $320; Rating: Two
Panic Point: $190
RISKS: Regulatory risk (data privacy), competition, and macroeconomic slowdown impacting consumers and therefore ad buyer activity.
American Express AXP; $360.73; 640 shares; 4.06%; Sector: Financial Services
UPDATE: October was another positive month for shares of American Express (AXP) , leaving them up more than 20% year-to-date. Mid-October, Amex delivered September-quarter results that were ahead of market expectations, with the company also lifting its 2025 top-line guidance and tightening up bottom-line expectations toward the upper end of its prior forecast. The recent Fed Beige Book found spending by higher-income individuals on luxury travel and accommodation was strong, and that was reaffirmed by multiple airlines when they reported their September-quarter results. Amex management commented that the first few weeks of its Platinum card refresh are very encouraging and, given the influence of net card fees on pre-tax income and EPS generation, as we suspected, others across Wall Street subsequently lifted their AMEX targets closer to our $370 target. Based on the initial comments for the Platinum card refresh, we should see the number of cards in force continue to climb, increasing the average fee per card as well. Let’s remember that as existing memberships renew at that higher card rate, the flow through should translate into a steady climb higher in average fee per card over the coming quarters. That should translate into higher pre-tax income and EPS as well. As we move through the current quarter, and Amex management makes the eventual investor conference rounds, should indications point to the refresh effort paying off more than expected, it would be a reason for us to revisit our AXP target. The other catalyst for such a move could be adoption rates for Amex Ads, Amex’s new digital advertising platform that helps brands connect with Amex’s U.S. consumer card membership. We suspect that, over time, Amex will roll that platform out to other markets as it aims to leverage the $530 billion in global Platinum franchise annual billings. On November 11, Amex will pay its next quarterly dividend of $0.82 per share. And as we move into November, we intend to revisit our panic point for AXP shares.
October Price Change: 8.6%; Yield: 0.88%
INVESTMENT THESIS: American Express is a globally integrated, membership-driven payments company, providing customers with access to products, insights, and experiences that enrich lives and build business success. The company has four reportable operating segments: U.S. Consumer Services (USCS), Commercial Services (CS), International Card Services (ICS), and Global Merchant and Network Services (GMNS). American Express targets the premium consumer space by continuing to deliver membership benefits that span our customers’ everyday spending, borrowing, travel, and lifestyle needs, expanding its roster of business partners around the globe, and developing a range of experiences that attract high-spending customers. In 2024, the company’s net card fee revenue accounted for 65% of its pre-tax income, which we see providing a differentiated business model that should continue to grow as Amex wins new card members and drives its average fee per card higher.
Target Price: Reiterate $370; Rating: Two
Panic Point: $295
RISKS: Slowdown in consumer spending, competition, membership growth, merchant acceptance, and lack of new product innovation.
Apple AAPL; $270.37; 825 shares; 3.92%; Sector: Technology
UPDATE: The rebound that started in Apple (AAPL) shares accelerated in August and September, but the continued climb in October pushed the stock to close near record highs at the end of the month. That upswing was first fueled by positive data points about Q3 2025 smartphone volumes, better initial iPhone 17 family performance compared to the iPhone 16, and pre-orders for those new models in China. In response, we lifted our AAPL target to $275 from $250 in mid-October. Those items were quickly followed by bullish iPhone comments from AT&T and reports that Apple was tweaking its iPhone production to the higher-priced premium models. When Apple reported its impressive September-quarter results, it shared that its iPhone capacity was constrained, but it also guided revenue for that key business segment to climb double-digits year over year in the current quarter. In response to that earnings report and guidance, which also calls for double-digit growth at the high-margin Services business, we boosted our AAPL target to $305 from $275 and lifted our panic point to $222. As we think about 2026, there are a few things on the horizon that keep us bullish. While that includes a full year of incrementally higher-priced iPhone models and Services, during the earnings call, Apple CEO Tim Cook confirmed the more personal, AI-backed Siri is on track to launch next year. Next year is also expected to bring the much-discussed iPhone Fold to market. We could also see Apple bring other AI enhancements to Apple Intelligence as it ramps up its investment in the technology. In terms of AAPL shares, the post-earnings reaction is likely to push them deeper into an overbought condition — and our investment style typically isn’t to chase stocks that land in that area. In keeping our Two rating, the next layers of support for the shares clock in at the 20-day moving average ($257.89) and the 50-day moving average ($247.34).
October Price Change: 6.2%; Yield: 0.38%
INVESTMENT THESIS: While we acknowledge that near-to-midterm performance remains heavily influenced by iPhone sales, the dynamic is shifting as investors finally place greater emphasis on Services growth. We are bullish on the 5G upgrade cycle and believe longer-term upside will continue to come as Services revenue grows its share of overall sales. Services provide for a recurring revenue stream at higher margins, a factor that serves to reduce earnings volatility while allowing for a higher percentage of sales to fall to the bottom line; as a result, we believe that Services growth and the installed base are much more important than how many devices the company can sell in each 90-day period. In addition to improved profitability, we also believe the transparent nature of this revenue stream will demand an expanded price-to-earnings multiple as segment sales grow. Furthermore, we believe that Apple's desire to push deeper into the healthcare arena will help make its devices invaluable as more life-changing features are added and the company works to democratize health records.
Target Price: Reiterate $305; Rating: Two
Panic Point: $222
RISKS: Slowdown in consumer spending, competition, lack of new product innovation, elongated replacement cycles, and failure to execute on Services growth initiatives.
Arista Networks ANET; $157.69; 585 shares; 1.62%; Sector: Technology
UPDATE: On October 8, the Portfolio initiated a new position in Arista Networks (ANET) because we see it well-positioned to benefit from AI and data center, streaming, IoT, and other factors that are driving network spending. Later in the month, we picked up with another slug of ANET shares following Nvidia's announcement of networking wins with Oracle and Meta for AI data centers. Given the rising demand for AI and data center capacity, and other factors that are driving network traffic, we see this more as a rising tide lifting multiple boats. Coming off Big Tech earnings this week, the step up in expected AI, data center, and cloud capital spending levels for next year supports our decision to add ANET to the Portfolio. When Arista reports on November 4, we will be sizing up its forward guidance, but we will also be eyeing its deferred revenue, which climbed to $4.1 billion exiting June, up from $3.1 billion at the close of the March 2025 quarter, and $2.8 billion exiting 2024. Catalysts that could lead us to revise our price target higher include stronger-than-expected AI and data center capital spending efforts from key Arista customers, Microsoft, and Meta, as well as others in the AI and data center space.
October Price Change: 5.5%; Yield: 0.00%
INVESTMENT THESIS: Arista Networks Inc engages in the development, marketing, and sale of data-driven, client-to-cloud networking solutions for AI, data center, campus, and routing environments in the Americas, Europe, the Middle East, Africa, and the Asia-Pacific. Its cloud networking solutions consist of Extensible Operating System (EOS), a publish-subscribe state-sharing networking operating system offered in combination with a set of network applications. The company offers data center, cloud, and AI networking, cognitive adjacencies, and cognitive network software and services. It also provides post-contract customer support services, such as technical support, hardware repair, and replacement parts beyond standard warranty, bug fixes, patches, and upgrade services. The company serves a range of industries comprising internet companies, cloud service providers, financial services organizations, government agencies, media and entertainment, healthcare, oil and gas, education, manufacturing, industrial, and others. Two the Arista’s largest customers in the last few years will be two Portfolio holdings you’ll quickly recognize — Microsoft and Meta. Per Arista’s 10-K filings, both Meta and Microsoft each account for more than 10% of revenue. Other named customers include Amazon’s AWS, Google Cloud, Anthropic, Canva, SAP, Shopify, Apple, Oracle, Bank of America, and Accenture.
Target Price: $180; Rating: Two
Panic Point: $120
RISKS: Economic, customer, supply chain, and competition risks.
Bank of America Corp. BAC; $53.45; 4,410 shares; 4.14%; Sector: Financial Services
UPDATE: Shares of Bank of America (BAC) rose further in October, building on the cumulative gain registered over the first nine months of 2025. The catalyst for that continued strength was BofA’s beat and raise September-quarter results, which reflected the positive mix shift toward BofA’s more profitable businesses – consumer banking and global banking, which houses its investment banking business. Those two segments generated 65% of BofA’s pre-tax income during the quarter. During BofA’s earnings call, management noted it is reaping the benefits of past technology investments in digitization and automation in its Commercial Bank and should see more as the impact of AI is felt. That increases our comfort with the recent segment margin improvement being sustainable, and it likely means we could see additional branch closures. On this topic, management also said it is starting to see similar benefits in its institutional-facing businesses. This may not play out immediately or in the next few quarters, but it has the potential to help lift the company’s margin profile, which would allow more revenue to drop to its bottom line. Also, during the September-quarter earnings call, management shared the company’s investment banking pipeline picked up during the quarter with gains across industry groups and transaction types. However, we also recognize that the longer the current government shutdown goes on, the more likely we are to see a speed bump for transaction activity, especially in the IPO market. Our view remains that this is likely to be a timing issue and could have a modest impact on the current quarter. But as we see it, all that means is a potentially more vibrant market in 2026, especially in an incrementally lower interest rate environment. As we see indications that the IPO market is either not decelerating as many suspect it could or we move past this speed bump, we’ll revisit our BAC target. An acceleration in M&A deals would give us another opportunity to revisit those targets. Our pick-up point for the shares is $47, and our panic point remains at $44.
October Price Change: 3.6%; Yield: 2.10%
INVESTMENT THESIS: Bank of America is one of the world's leading financial institutions, serving individual consumers, small- and middle-market businesses, and large corporations with a full range of banking, investing, asset management, and other financial and risk management products and services. The company provides unmatched convenience in the United States, serving approximately 67 million consumers and small business clients with approximately 3,900 retail financial centers, approximately 16,000 ATMs, and award-winning digital banking with approximately 56 million verified digital users. Bank of America is a global leader in wealth management, corporate and investment banking, and trading across a broad range of asset classes, serving corporations, governments, institutions, and individuals around the world. Bank of America offers industry-leading support to approximately 3 million small business households through a suite of innovative, easy-to-use online products and services. The company serves clients through operations across the United States, its territories, and approximately 35 countries. From a reporting perspective, the company's business breaks down as follows: Net Interest Income breakdown: Consumer Banking 57%, Global Banking 23%, Global Wealth & Investment Management 14%, and Global Markets 6%; Income Before Tax breakdown: Consumer Banking 42%, Global Banking 27%, Global Wealth & Investment Management 16%, and Global Markets 15%. Bank of America pays a quarterly dividend of $0.26 per share, up from $0.18 a few years ago.
Target Price: $60; Rating: Two
Panic Point: $44
RISKS: Financial markets, fiscal, monetary, and regulatory policies, economic conditions, and credit ratings.
Dutch Bros BROS; $55.54; 3,678 shares; 3.59%; Sector: Consumer Cyclical
UPDATE: In our last Monthly Roundup, we discussed the drag shares of Dutch Bros (BROS) had been on the Portfolio in September. The shares continued in that direction, becoming oversold based on the RSI levels, and that led us to pick up more for the Portfolio on October 10 at $50.08. In our view, the oversold condition skewed the risk-to-reward tradeoff in a very favorable way, especially after we parsed the retail and consumer spending data for September. Others followed our thinking with RBC naming BROS shares as one of its favorite stocks, UBS raising its price target to $85, Morgan Stanley taking its to $84, and, more recently, Mizuho initiating coverage with an Outperform rating. During the current earnings season, transaction volume data from American Express and Visa confirm consumers to spend, a positive for Dutch Bros' expanding footprint. And even though coffee is around 10% of Dutch Bros' cost of goods sold, a figure confirmed during our podcast conversation with Black Rock Coffee CEO Mark Davis, recent headlines suggesting a trade deal between the U.S. and Brazil cooled coffee prices. That likely had a psychological impact on BROS and others in the space, and we will continue to follow progress on that front. Those factors led to a very nice rebound in BROS shares, but we see more of that ahead. We remain critical of management’s not being more communicative with the investment community, especially when it hits certain shop count milestones. When Dutch Bros reports next week, we’ll be looking at that shop count progress and for more details on the company’s plan to reach 2,029 shops by 2029. As a reminder, exiting the June quarter, Dutch Bros had 1,043 shops with plans to add at least 160 shops this year, after adding 61 in the first half of 2025. It’s that geographic expansion that sits at the heart of our rationale for owning BROS, with the company’s expanding food menu a nice sweetener.
October Price Change: 6.1%; Yield: 0.0%
INVESTMENT THESIS: Dutch Bros is an operator and franchisor of drive-thru shops that focus on serving high-quality, hand-crafted beverages with unparalleled speed and superior service. Coffee-based beverages make up about 50% of the menu mix, and about 25% of the menu mix is based on the company’s proprietary Blue Rebel energy drink, which is highly customizable with flavors and modifiers and can be served blended or over ice. The energy platform helps unlock the afternoon day part and broadens the company’s appeal. The remaining 25% of the menu mix is a wide variety of teas, lemonades, sodas, and smoothies. The company’s west-to-east expansion is a time-tested strategy that should drive revenue and EPS growth over the next several years. Leveraging that footprint expansion and low-single-digit comp sales growth, management reiterated its long-term guidance of around 20% annual revenue growth. Helping support that guidance, the company confirmed it will introduce an expanded food menu in 2026. Dutch Bros is slated to enter the consumer-packaged goods (CPG) space in a deal with Trilliant Food & Nutrition.
Target Price: Reiterate $85; Rating: Two
Panic Point: $42
RISKS: Commodity risks, labor costs, interest rate risk, and inflation.
First Trust Nasdaq Cybersecurity ETF CIBR; $77.32; 2,248 shares; 3.06%; Sector: Cybersecurity
UPDATE: Shares of the First Trust Nasdaq Cybersecurity (CIBR) ETF continued to be a steady performer for the Portfolio in October. Each time we note ripped-from-the-headlines confirmation points for the Pro Portfolio and its underlying strategy, one constant is the signals for cybersecurity demand. Artificial intelligence will super-charge familiar threats in 2025 and beyond, putting new wrinkles on old security challenges such as phishing, insider threats, and ransomware. Entering this year, research firm Gartner expected cybersecurity spending would rise $212 billion, but during August the firm increased that to $213 billion. It also forecasts cybersecurity spending accelerating in 2026 as it sees a concerted enterprise effort to shore up cloud security capabilities, particularly in relation to AI workloads. By 2028, Gartner sees that spending approaching $300 billion, and it’s that multiyear outlook that keeps us owners of CIBR shares. We continue to favor the diversified exposure this ETF brings to the Pro Portfolio. We have room to expand our exposure to CIBR should we see a wider market pullback emerge. If such an event unfolded, CIBR shares near $72 would make for a wonderful addition, which also happens to be our established pick-up point. For now, our $63 panic point remains, but as CIBR shares move higher, we’ll lift that level in a commensurate manner. Catalysts we will be watching include subsequent M&A activity in the space as well as September quarter results from key constituents, including CrowdStrike (CRWD) , Palo Alto Networks (PANW) , Infosys (INFH), Cloudflare (NET) , and CyberArk (CYBR) .
October Price Change: 1.7%; Yield: 0.02%
INVESTMENT THESIS: The First Trust Nasdaq Cybersecurity ETF seeks investment results that correspond generally to the price and yield (before the fund's fees and expenses) of an equity index called the Nasdaq CTA Cybersecurity Index. The Nasdaq CTA Cybersecurity Index is designed to track the performance of companies engaged in the cybersecurity segment of the technology and industrial sectors. It includes companies primarily involved in the building, implementation, and management of security protocols applied to private and public networks, computers, and mobile devices to protect the integrity of data and network operations. To be included in the index, a security must be listed on an index-eligible global stock exchange and classified as a cybersecurity company as determined by the Consumer Technology Association. Each security must have a worldwide market capitalization of $250 million, have a minimum three-month average daily dollar trading volume of $1 million, and have a minimum free float of 20%.
Target Price: Reiterate $85; Rating: Two
Panic Point: $63
RISKS: Cybersecurity spending, technology and product development, the timing of the product sales cycle, new products, and services in response to rapid technological changes and market developments, as well as evolving security threats.
Labcorp Holdings Inc. LH; $253.96; 790 shares; 3.53%; Sector: Healthcare
UPDATE: Over the course of Q3 2025, Labcorp (LH) shares were a steady performer for the Portfolio, and while it may not be a sexy business or one that generates much in the way of headlines, the company remains a well-positioned play for our Aging of the Population investing theme. However, that doesn’t mean there can’t be hiccups along the way, and that’s what Wall Street saw with the company’s September-quarter earnings report that topped bottom-line expectations and lifted the midpoint of its 2025 EPS forecast, but also saw Labcorp temper its 2025 revenue forecast. One of the key factors behind that modest revision was the timing of closing expected acquisitions. As the company explained during its earnings call, some of the expected acquisitions are closing later than expected, and a few have slipped into 2026. In our earnings note, we explained how incorrectly focusing on that overshadows the continued organic growth of the business, which is benefiting from volume gains, but also more favorable pricing tied to the mix of tests being performed. On the same earnings call, Labcorp management detailed cost reduction initiatives and how it is adopting AI, the combination of which should help drive margins higher over time. Given what we saw, we maintained our $300 price target and shared that once LH shares have absorbed the market’s overreaction, we’d be inclined to wade deeper into the position. We did just that on October 30, with a pick-up price of $255.15.
October Price Change: -11.5%; Yield: 1.13%
INVESTMENT THESIS: Labcorp is a global leader in innovative and comprehensive laboratory services that provide vital information to help doctors, hospitals, pharmaceutical companies, researchers, and patients make clear and confident decisions. By leveraging its diagnostics and drug development capabilities, the company provides insights and accelerates innovations to improve health and improve lives. The company is organized under two segments, consisting of Diagnostics Laboratories (Dx), which includes routine testing and specialty/esoteric testing, and Biopharma Laboratory Services (BLS), consisting of Early Development Research Laboratories and Central Laboratory Services. Our attraction to LH shares stems from the combination of the aging population driving diagnostic testing growth and the increasing array of diagnostic testing as well. That combination is expected to drive the healthcare testing services market to $12.6 billion by 2029, from $7.4 billion in 2024, according to Markets and Markets. To augment its position in oncology, women's health, autoimmune diseases, and neurology, the company has been expanding through acquisitions and partnerships with health systems and regional and local labs.
Target Price: Reiterate $300; Rating: Two
Panic Point: $228
RISKS: Macroeconomic factors, changes in healthcare reimbursement models and products, government regulations, product discontinuations or recalls.
Marvell Technology MRVL; $93.74; 2,570 shares; 4.23%; Sector: Technology
UPDATE: Coming off being the Portfolio’s strongest performer in September, shares of Marvell Technology (MRVL) continued to be strong for us in October. That led MRVL to become an outsized position for the Portfolio in early October, forcing us to adhere to our investment discipline, and ring the register, locking in a 128% gain on that slug of MRVL shares, and downgrade our rating to a Two. Given the prospects we see for AI, data center, digital infrastructure, and connectivity, we continue to hold a sizable position in MRVL shares. Backing that decision, as we moved through October, we continued to receive data points supporting rising AI and data center capital spending, which bodes well for Marvell, as does the expected ramp later this year in the company’s proprietary AI silicon solutions. That included the significant jump in High Performance Computing in September-quarter results from Taiwan Semi and its outlook for that segment not only in the current quarter but following ones as well. Microsoft shared that its data-center capacity issues will persist longer than previously indicated, running well into 2026. Following Microsoft’s massive incremental $250 billion Azure win with OpenAI, odds are that capacity constraint will persist even longer. Sure enough, that led Microsoft to telegraph another step up in capital spending levels. Sure enough, that led Microsoft to lift its capital spending levels. As we learned about that, Meta, Google, and Amazon also lifted their planned capital spending levels for this year. The four also telegraphed even higher capex levels in 2026. Meanwhile, rising AI adoption is expected to drive incremental capital spending levels, benefiting Marvell’s Enterprise Networking and Carrier Infrastructure Segments. One of those reference points was the 45% year-over-year and 10% quarter-over-quarter increase for Texas Instruments’ Communications Equipment segment. In that September-quarter earnings report, TI also shared that its data center business is up more than 50% year to date. As we think about those data points and others that may come, let’s also remember Marvell’s new $5 billion share repurchase program and accelerated repurchase agreement to repurchase $1 billion of its common stock. That should be a nice one-two combination for Marvell’s next earnings report. Aggregate comments about 2026 AI, data center, and cloud capex levels received this week, as well as very favorable comments about Amazon’s Trainium AI chips, led us to increase our MRVL target to $125 from $115 on October 31, as well as lift our panic point to $75. Should we see a modest near-term pullback in MRVL shares, that would lead to an even better risk-to-reward tradeoff in the shares following their recent and pronounced climb. That would, in turn, lead us to reconsider our current Two rating.
October Price Change: 11.5%; Yield: 0.26%
INVESTMENT THESIS: Marvell is a fabless supplier of high-performance standard and semi-custom infrastructure semiconductor solutions. These solutions power the data economy, enabling the data center, carrier infrastructure, enterprise networking, consumer, and automotive/industrial end markets. With roughly 75% to 80% of Marvell's revenue stream tied to digital infrastructure, we see it continuing to benefit from rising content consumption and creation. Pointing to that rising demand that necessitates network densification and the build of digital infrastructure, Ericsson sees global monthly average usage per smartphone reach 46 gigabytes (GB) by the end of 2028, versus 19 GB in 2023 and 15 GB in 2022.
Target Price: Reiterate $125; Rating: Two
Panic Point: $75
RISKS: Technology risk, customer risk, competition risk, reliance on manufacturing partners, and supply chain constraints.
Microsoft Corp. MSFT; $517.81; 346 shares; 3.15%; Sector: Technology
UPDATE: After creeping higher in September, shares of Microsoft (MSFT) were heading for a nice gain in October, and that led us to do some prudent and very profitable trimming ahead of the company’s September-quarter results. While Microsoft delivered results that easily cleared consensus forecasts, the shares were weighed down by management guidance for flat-to-down margins in the current quarter and capital spending efforts that will lead it to increase its total AI capacity by 80% this fiscal year and help double its total data center footprint over the next two years. On the positive side, the company’s commercial remaining performance obligations (RPOs) hit $400 billion, up 50% year over year, and we should keep in mind that this does not include the recent $250 billion incremental win with OpenAI. This means the expected period of capacity digestion and ensuing leverage in the cloud business will be pushed off by a few quarters. As the company moves past that, we should see margins improve, and EPS growth accelerate further. That is one reason why we continue to be MSFT shareholders. Another is Microsoft’s ownership stake in OpenAI Group PBC, the for-profit OpenAI entity, and news that OpenAI is preparing for a 2026 IPO. While that may not benefit Microsoft from an operating perspective, the eventual IPO will be a positive for the company’s balance sheet. Based on AI and cloud adoption metrics in the coming weeks and months, we’ll circle back to our $600 MSFT target price and potential pick-up points. Upcoming management presentations include the UBS Global Technology Conference on December 2 and the Barclays Global Technology Conference on December 11. In keeping with our Two rating, we see nice support for the shares between $509-$514.
October Price Change: 0.0%; Yield: 0.70%
INVESTMENT THESIS: We believe the cloud to be a secular growth trend and that the upside to the shares will result from Microsoft's hybrid cloud leadership as the company grabs market share in this expanding industry. While companies may look to build out multi-cloud environments, Microsoft's Azure offering will be a prime choice thanks to its decision to provide the same "stack" used in the public cloud to companies for their on-premises data centers. Additionally, we would note that hybrid environments are currently the preference for most companies because they allow them to maintain critical data in-house while taking advantage of the agility and scalability provided by public clouds. Outside of the cloud opportunity, we maintain a positive view on the company's growing gaming business, which we believe is becoming an increasingly prominent factor in the Microsoft growth story as gaming becomes more mainstream, management works to convert its gaming revenue from a one-time license purchase to a recurring subscription model, and as technologies like augmented/virtual reality evolve. Finally, as it relates to LinkedIn and other subscription-based services such as O365 and various Dynamics products, we continue to value them highly for their recurring revenue streams, which, we remind members, provide for greater transparency of future earnings.
Target Price: $600; Rating: Two
Panic Point: $450
RISKS: Slowdown in IT spending, competition, and cannibalization of on-premises business by the cloud.
Morgan Stanley MS; $164.00; 1,400 shares; 4.04%; Sector: Financial Services
UPDATE: Building on the strong performance through the first nine months of 2025, the positive uptrend in Morgan Stanley (MS) shares continued in October. The main catalyst for that was the company’s massive September-quarter earnings beat. While each of Morgan Stanley's reportable segments delivered a combination of revenue growth and margin expansion, looking at its year-over-year performance and even that compared to the June quarter, it’s clear that the bank's September quarter benefited from the upswell in investment banking activity and that operating leverage. During its earnings call, management shared the investment banking pipelines picked up during the quarter with gains across industry groups and transaction types. However, we also recognize that the longer the current government shutdown goes on, the more likely we are to see a speed bump for transaction activity, especially in the IPO market. Our view remains that this is likely to be a timing issue and could have a modest impact on the current quarter. But as we see it, all that means is a potentially more vibrant market in 2026, especially in an incrementally lower interest rate environment. As we see indications that the IPO market is either not decelerating as many suspect it could or we move past this speed bump, we’ll revisit our MS target. An acceleration in M&A deals would give us another opportunity to revisit those targets. Our pick-up point for the shares is $150, and our panic point remains at $135.
October Price Change: 3.2%; Yield: 2.44%
INVESTMENT THESIS: Morgan Stanley reports in three business segments: Institutional Securities (42% of trailing 12-month revenue, 38% of trailing 12-month Income Before Tax), Wealth Management (48%, 55%), and Investment Management (10%, 6%). While the IPO window has yet to reopen, the potential IPO class for 2025 continues to build with recent additions including Klarna and StubHub. That would be a boon to private equity firms and others that have been nursing IPO candidates during the dark period and a positive for Morgan Stanley's investment banking business. Expected deregulation under the Trump administration is a potential catalyst for Morgan's M&A business. Meanwhile, folks continuing to be behind in retirement savings bodes well for Morgan Stanley's wealth management business in the coming quarters, while continued market volatility bodes well for its equity trading business.
Target Price: $170; Rating: Two
Panic Point: $135
RISKS: Market and interest rate risk, credit risk, country risk, and operational risk, including cybersecurity.
Qualcomm Inc. QCOM; $180.90; 1,110 shares; 3.53%; Sector: Technology
UPDATE: Shares of Qualcomm (QCOM) trekked higher during the first few weeks of October following favorable industry data for smartphone and AI PC volumes. Following those positive data points, reports pointed to Apple shifting its production toward iPhone 17 and Pro models, which utilize Qualcomm chips, and away from iPhone 17 Air, which uses Apple’s proprietary cellular modem chipset. This week, following news that Qualcomm would enter the AI accelerator chip market in 2026, its share zoomed higher. As we explained in our alert, while that announcement is the next leg in the Qualcomm diversification stool, it triggered a wave of short covering that propelled the shares significantly higher. Recognizing that some of that catapult higher would fade as the short covering subsided, and folks would take a more measured reaction because of the 2026 timing and the competitive landscape, we took advantage of the situation by locking in some opportunistic gains even as we lifted our long-term price target to $205 from $180. We trimmed the position back at $190.55 and cut our rating to a Two from One. While we are long-term investors in QCOM shares and want to remain shareholders to capture further benefits tied to the company’s diversification strategy, it would have been a mistake not to take advantage of that sharp move higher from a portfolio management perspective. As the shares settle out and we digest the company’s upcoming earnings report on November 5, we intend to revisit our panic and pick up points for QCOM shares.
October Price Change: 8.7%; Yield: 1.97%
INVESTMENT THESIS: Qualcomm focuses on foundational technologies for the wireless industry, including 3G (third generation), 4G (fourth generation), and 5G (fifth generation) wireless technologies and processor technologies, including high-performance, low-power computing and on-device artificial intelligence technologies. As a connected processor company, its technology roadmap aims to enable the connected intelligent edge (the next generation of smart devices) across industries and applications beyond handsets, including automotive and the Internet of Things (IoT). Qualcomm has three reportable segments: QCT (Qualcomm CDMA Technologies) semiconductor business, which develops and supplies integrated circuits and system software based on 3G/4G/5G and other technologies for use in mobile devices; automotive systems for connectivity, digital cockpit, and ADAS/AD; and IoT, including consumer electronic devices, industrial devices, and edge networking products. QCT accounts for 80% to 85% of revenue. The QTL (Qualcomm Technology Licensing) licensing business grants licenses or otherwise provides rights to use portions of the company's intellectual property portfolio, which includes certain patent rights essential to and/or useful in the manufacture and sale of certain wireless products. QTL accounts for about 15% of Qualcomm's revenue but contributes a greater portion of the company's operating income. Our focus on QCOM shares is revenue diversification as part of management's intended strategy to lessen its reliance on the smartphone market by tapping into the AI PC, IoT, and automotive chip markets. We see this unfolding over the next few years, which should lead Wall Street to revisit how it values the shares. It is that opportunity we aim to capture by owning the shares over the longer term.
Target Price: $205; Rating: Two
Panic Point: $135
RISKS: Customer risk, technology advancement, competition risk, third-party supplier, and manufacturing partner risk.
TJX Companies TJX; $140.14; 687 shares; 1.69%; Sector: Financial Services
UPDATE: Coming off a strong move in August and September, shares of TJX Companies (TJX) gave back some of those gains in October. Even so, we continued to receive signals that the consumer was becoming increasingly selective when it came to spending, opting to cut back on spending and switching to lower-priced products. Supporting that view, the Fed’s latest Beige Book report found that lower- and middle-income households continued to seek discounts and promotions in the face of rising prices and elevated economic uncertainty. We continue to see TJX as well-positioned with consumers feeling the pinch of higher prices and remaining selective and value-driven, even though they will spend where it matters. That is especially true given the impact of the government shutdown as we move into the heart of the holiday shopping season. On the topic of tariffs, around 90% of what TJX buys is from third parties, taking advantage of closeouts from brands, manufacturers, and other retailers, or in some cases, manufacturing overruns. As such, for around 90% of its merchandise, TJX is not the direct importer, and that makes the TJX business model different than most retailers'. That combination sets the company up rather well from a value-driven consumer perspective as we head into the holiday shopping season. As we move deeper into the holiday shopping season, we would welcome the opportunity to boost the Portfolio’s exposure to TJX, but in keeping with our Two rating, we will remain disciplined investors. We continue to see a gap in the chart that would be filled at $134, and support for the shares near $133, which is its 100-day moving average.
October Price Change: -3.0%; Yield: 1.21%
INVESTMENT THESIS: The TJX Companies is the leading off-price apparel and home fashions retailer in the United States and worldwide. It has over 5,000 stores and six branded e-commerce sites that offer a rapidly changing assortment of quality, fashionable, brand-name, and designer merchandise at prices generally 20% to 60% below full-price retailers’ regular prices on comparable merchandise. The company operates in four segments: Marmaxx and HomeGoods, both in the U.S.; TJX Canada, and TJX International. TJX looks to capitalize on opportunities to acquire merchandise at substantial discounts that regularly arise from the production and flow of inventory in the apparel and home fashions marketplace. These opportunities include, among others, closeouts from brands, manufacturers, and other retailers; special production direct from brands and factories; order cancellations; and manufacturer overruns. We see that positioning TJX extremely well, as consumers feel the pinch of ongoing inflation pressures and their efforts to stretch the disposable spending dollars they do have, including tapping discounted shopping locations.
Target Price: $150; Rating: Two
Panic Point: $115
RISKS: Operational, strategic buying, and competitive risks, as well as consumer spending patterns.
United Rentals URI; $871.18; 235 shares; 3.60%; Sector: Industrials
UPDATE: Shares of United Rentals (URI) have been a strong performer for the Portfolio through the first three quarters of 2025, but the company’s September-quarter results were impacted by URI jockeying equipment to meet demand. The corresponding gross margin pressure weighed on its bottom-line results, leading URI shares to give back some of their prior gains in October. While that was a setback, it was a modest one, and we continue to see better days ahead for the company and the stock. United confirmed during its earnings, non-residential construction activity should benefit from not only data center construction but also from infrastructure, semiconductor, hospital, and power facilities, as well as airport construction. As those projects get underway and mature, and United's need to move equipment falls, we should see United’s margin profile return to higher levels. That suggests some of the bottom-line impact should be reversed in the coming quarters, a signal that 2026 EPS expectations may need to be revised higher in the coming months. While United management stopped short of giving any formal 2026 guidance, the team shared that it sees another year of good growth ahead. For that reason, the company has stepped up its capital spending program for this year so it will be positioned to address that demand. We continue to see construction activity improving as we move through 2026, as the monetary policy moves from restrictive to more neutral territory, leading to further improvement in interest rates. As we move into the seasonally slower time of year for United’s business, when it comes to revisiting our Two rating, we will pick our spots carefully.
October Price Change: -8.7%; Yield: 0.82%
INVESTMENT THESIS: United Rentals, the largest equipment rental company in the world, operates throughout the United States and Canada, and has a limited presence in Europe, Australia, and New Zealand. It serves industrial and other non-construction, commercial (or private non-residential) construction, and residential construction. Industrial and other non-construction rentals represented approximately 50% of rental revenue, primarily reflecting rentals to manufacturers, energy companies, chemical companies, paper mills, railroads, shipbuilders, utilities, retailers and infrastructure entities; commercial construction rentals represented approximately 46% of rental revenue, primarily reflecting rentals related to the construction and remodeling of facilities for office space, lodging, healthcare, entertainment and other commercial purposes; and residential rentals around 4% of revenue. We see the company benefiting on three fronts — the seasonal uptick in construction spending, the release of funds and projects associated with the five-year Biden administration infrastructure bill, data center construction and other re-shoring projects, and the company's nip-and-tuck acquisition strategy that should further enhance its geographic footprint.
Target Price: Reiterate $1,000; Rating: Two
Panic Point: $775
RISKS: Industry and economic risk, competition and competitive pressures, and acquisition risk.
Welltower Inc. WELL; $181.04; 330 shares; 1.05%; Sector: Real Estate
UPDATE: In mid-September, the Portfolio started an initial position in Welltower (WELL) as part of the demographic shift associated with an aging population. Some call this shift the "Silver Tsunami," but we see it as a powerful force when examined against the looming shortage of senior housing. In making that initial move, we shared our plan was to build the position size methodically, increasing the Portfolio’s dividend stream along the way. In advance of Welltower’s September-quarter earnings report, the shares moved from their early October low $165 to near $180, which kept us on the sidelines. What we saw in the company’s quarterly results and learned during the earnings call reaffirmed our position, as the company’s latest round of transactions will lead it to become laser-focused on the senior housing market. Data from senior housing analytics company NIC MAP find that by 2030, the senior living sector faces a potential shortfall of approximately 595,000 units. We see that driving favorable rent escalation figures, especially as capacity levels continue to rise, leading to further margin improvement and higher FFO per share figures. Given Welltower’s REIT structure, that should also lead to further dividend increases. In response, we lifted our price target to $205 from $190. Our intent is to remain long-term holders of WELL shares. Along with that, we are interested in adding to the Pro Portfolio’s exposure, reflecting the total return potential we see over the coming years. Should we see WELL shares pull back and test the 50-day moving average near $171, that would not only be a place where we would consider picking up more shares, but it would also give us reason to revisit our current Two rating.
October Price Change: 1.6%; Yield: 1.63%
INVESTMENT THESIS: Welltower, a real estate investment trust (REIT), owns interests in properties concentrated in major, high-growth markets in the United States, Canada, and the United Kingdom, consisting of seniors housing, post-acute communities, and outpatient medical properties. We see the company benefiting from the intersection of the demographic shift that is the aging population and the looming pain point that is the shortage of inventory for senior housing, which fell below 1% in Q2 2025, according to the National Investment Center for Seniors Housing & Care. Over the next five years, more than 4 million boomers will hit age 80, and that’s in addition to the roughly 4% of the U.S. population that is 80-plus years old in 2024. As this demographic shift unfolds, we should see a relatively steady growth rate in Welltower’s revenue, NOI, and FFO, which, in turn, given its REIT status, should drive its payable dividend stream higher. Because of the favorable demographic tailwind and lower interest rate path telegraphed by the Federal Reserve, which should reduce construction costs over time, as well as bring REIT stocks back into favor, we intend to be long-term holders of WELL shares. Our plan is to build the position size methodically, increasing the Portfolio’s dividend stream along the way.
Target Price: $205; Rating: Two
Panic Point: $141
RISKS: Operational risk, operator and tenant risk, competitive risks, and acquisition risk.
