November Monthly Roundup: A Challenging Month Also Brought Ample Opportunities
We locked in massive gains, put capital to work in nine holdings and our EPS Diplomats model, and exited a name as questions about management arose.
You've reached your free article limit
You've read 0 of 1 free Pro articles.
Historically, November has been a positive month for the market, but as we saw with September, seasonal trends don’t always play out as expected. Since 1928, the S&P 500 has averaged a 1.9% gain for the 11th month of the year, and since 1971, the Nasdaq Composite’s average return was 2.1%.
This time around, following a sharp move lower and a late-month rebound, the S&P 500 logged a net gain of 0.13% for November. The Nasdaq Composite closed down 1.5%, pulled lower by renewed market concerns over the AI trade that impacted chip and software companies alike. We also have to recognize that after seven consecutive months of gains for the S&P 500 and eight for the Nasdaq Composite, a market pullback was more than likely.
In that environment, the Pro Portfolio had a challenging November, and while we made up some lost ground late in the month, when push came to shove, we lost ground during the month. It happens from time to time, but what matters more is how we respond.
Coming into November, the Pro Portfolio’s cash position stood at 8.9% of its assets, and we used that, as well as some of the gains and returned capital we acquired during the month, to build up our exposure as the market sold off. We’ve employed this strategy before, and by examining technical developments while heeding the fundamentals, it has positioned us well for what’s ahead.
The late-November rebound in the market has fueled some positive thoughts about December, but as we discussed with you last week, following the expected market strength during the Thanksgiving week, we are a tad more cautious. As we discussed in our recent conversation with our own Bob Lang, our preference would be for the S&P 500 to retest support levels it recently passed through. Such a move would clear the decks and allow the market to move higher.
As we discuss below, we have a bunch of November economic data that could challenge the market’s renewed expectation for a December rate cut. President Trump is also expected to unveil his replacement for Fed Chair Jerome Powell before year-end, and odds are high it will be someone who backs Trump’s call for lower interest rates. We could also hear from the Supreme Court on Trump’s usage of tariffs, and if they rule against that action, it could introduce a new round of questions and uncertainty.
In addition to those items, the next few weeks will bring multiple investor conferences, and that means with only weeks to go before we close out the year, we and other folks will be paying close attention to what is said, and what isn’t. Good or bad, we’ll be assessing how these investor conference comments stack up guidance issued over the last several weeks. Based on what we learn, we’ll adjust our thinking and the Pro Portfolio’s positioning as needed.
Catching Up on the Pro Portfolio in November
While the Pro Portfolio rebounded in the final month of November, overall, it was a challenging month as multiple positions closed the month lower. That's not surprising given the difference between the Nasdaq Composite’s November performance, down 1.5%, compared to the slight gain of 0.13% for the S&P 500. However, while shares of Nvidia (NVDA) , Palantir (PLTR) , ServiceNow (NOW) , and Arista Networks (ANET) weighed on the Portfolio’s November, as did Axon (AXON) , the tailwinds we see, including AI adoption and usage, keep us bullish.
Notable gainers during November included Welltower (WELL) and its 15% move higher, which outperformed the headline-grabbing Alphabet (GOOGL) and its 13.7% climb. Other outperformers relative to the S&P 500 included Apple (AAPL) , American Express (AXP) , Dutch Bros (BROS) , Labcorp (LH) , Morgan Stanley (MS) , TJX Companies (TJX) , and Waste Management (WM) .
Now let’s review the multiple actions taken by the Portfolio during November. Given the market’s weakness in the first few weeks of November, we put additional capital to work in AXON and ANET early in the month. We picked up even more of those shares as well as ones for the First Trust Nasdaq Cybersecurity ETF (CIBR) , Meta (META) , Microsoft (MSFT) , ServiceNow, Palantir, and TJX as Washington reached a bipartisan breakthrough to end the government shutdown.
After laying the groundwork for our EPS Diplomats model, on November 17, we put it into action, adding positions in Barrick Mining (B) , Celestica (CLS) , Credo Technology (CRDO) , Comfort Systems (FIX) , Kinross Gold (KGC) , The Progressive Corp. (PGR) , Seagate Technology (STX) , and Vertiv Holdings (VRT) . For the last two weeks of November, when the basket was part of the Portfolio, the aggregate return tallied 9.6%, well ahead of the corresponding 1.7% gain logged by the S&P 500.
Comparing October quarter retail comp sales figures from the likes of Target (TGT) , Chipotle (CMG) , Home Depot (HD) , and others to adjusted comp sales posted by Costco (COST) led us to scoop up more COST shares for the Portfolio on November 19. We added even more AXON, META, and NOW shares in November, taking advantage of the oversold condition in each of them. Our last buy action in November was another round of ANET shares at $126.34, a move we made after Dell (DELL) discussed the strength it is seeing in AI server demand.
We also did some prudent register ringing during November, which included an opportunistic sale in Marvell (MRVL) shares as well as one such move for GOOGL shares, followed by a second one tied to maintaining our Portfolio discipline. We also closed out the Portfolio’s position in Universal Display (OLED) , spurred on by questions and, in our view, management credibility when it came to the company’s very disappointing September-quarter performance.
Those moves, which showcase our efforts not to let emotion dictate our actions, helped fund the purchases we made during November. The net effect of our buying and selling left the Portfolio’s cash position at 7.0% at the end of November. Entering December, we have a few holdings whose position sizes are above 4.0%, including Morgan Stanley, Bank of America (BAC) , and American Express (AXP) . Should these positions melt up further, some prudent register ringing may be called for.
We will continue to watch for an opportunity to add more shares of Welltower, but we also plan on fleshing the Bullpen out further as we get ready for the coming year. With that in mind, in mid-November, we added HD shares to the Bullpen and removed Broadcom (AVGO) and Bright Horizons Family Solutions (BFAM) as potential Portfolio contenders.
Last Week's Portfolio Videos
We cover a lot of ground during the week in our Daily Rundowns. If you happened to miss one or more of them, here are some helpful links:
Monday, November 8: 'Clearing the Decks' for the Fed and the Market
This Month’s Podcasts and Signals
Big discussions and insights are had during TheStreet Stocks & Markets Podcast, and in Signals, we share the latest news for the Pro Portfolio’s strategies. Here are some quick links to those conversations conducted over the last several weeks:
November 5: Why Big Tech Will Continue to Lead With Jay Woods
November 8: Million+ Layoffs, Canada Looks Past U.S. for Defense, More Investing News
November 12: The New Nuclear Age With Homeland Uranium CEO
November 15: Foreclosures Jump, AI at Work, GenZ Locked Out, More Investing News
November 19: Consumer Spending Stocks With Eric Clark
November 22: Drone Cops in Sky, Struggling With 6-Figures, AI All-in, More Investing News
Some helpful links if you prefer to catch the podcast on the go, in the car, or wherever. Be sure to give it a like or thumbs up and leave a review if you’re so inclined. We’d appreciate it.
YouTube, Apple Podcasts, Spotify
Key Global Economic Readings
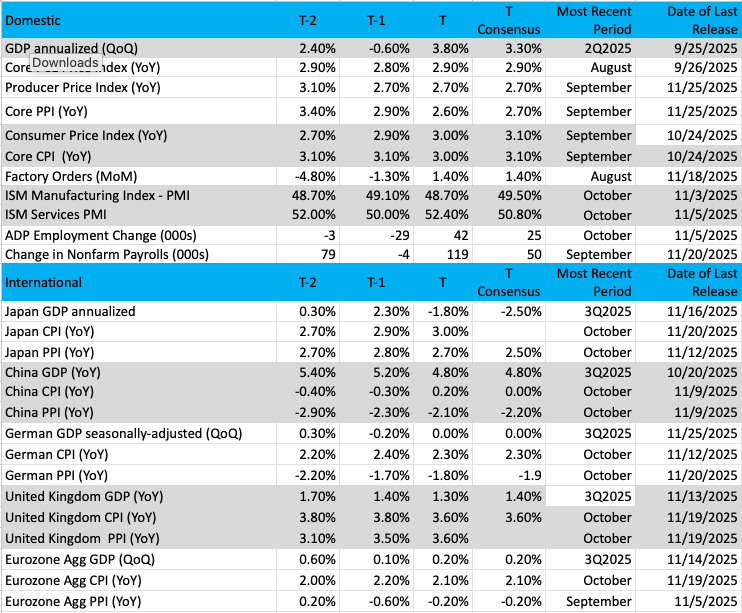
(Note: T is the most recent period, T-1 is the prior period's reading, and T-2 is two periods back, the intent being to illustrate any trends.)
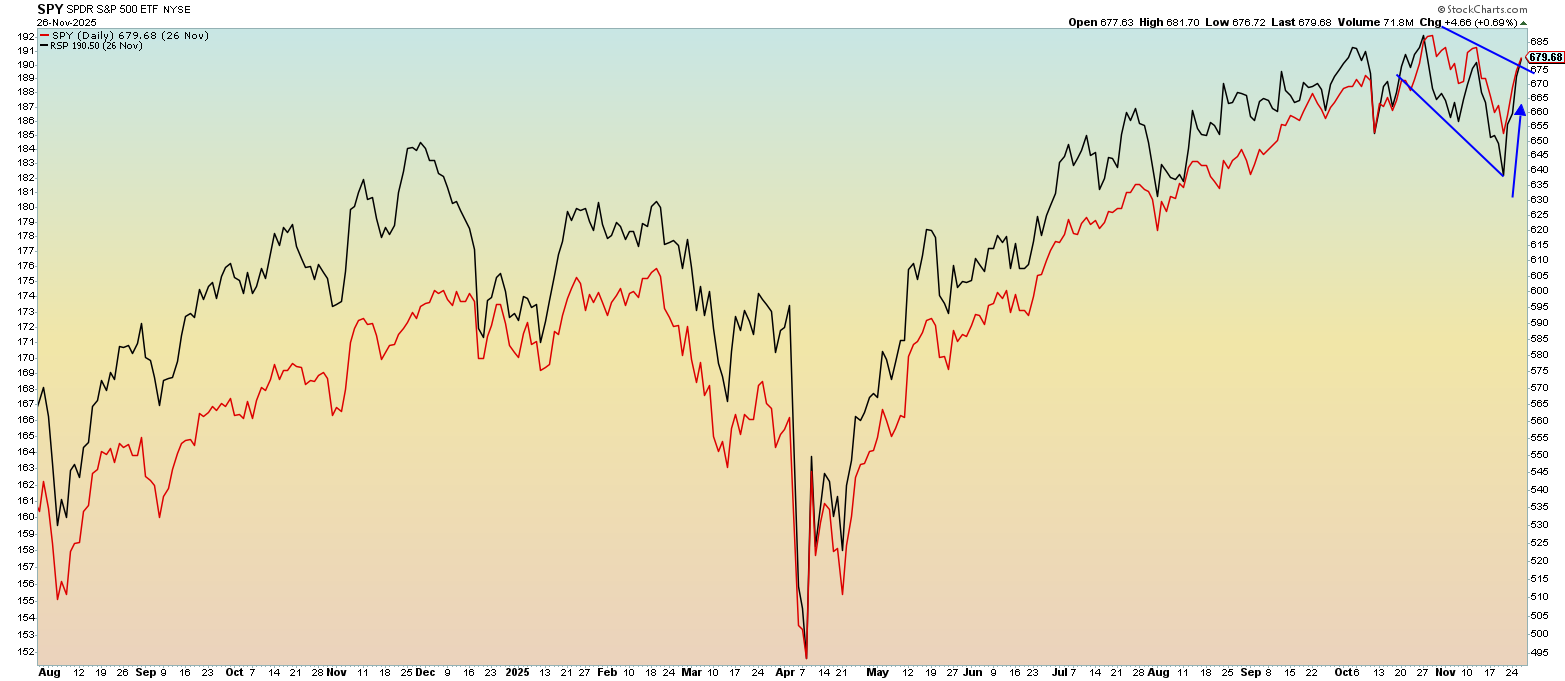
Chart of the Week: S&P 500 – Equal Weight vs. Market Cap Weight
It’s been quite a month for the market indexes. The (SPY) and (RSP) diverged and then converged together, embarking on a trail that may lead to all-time highs soon. The SPY, which is the weighted S&P 500 index, had been struggling to move upward after achieving record highs at the end of October. The RSP (equal-weighted), for its part, was also having a hard time moving up, sliding instead into a downtrend on higher volume.
But something changed the last five trading sessions that had the SPY and RSP do an about-face. The ETFs are within a whisker now of all-time highs, and with bullish seasonal trends in force, that should not be a high bar to hurdle.
The RSP is an important ETF to watch, as it gives an equal weighting to every name in the S&P 500 index. Hence, even the smallest company in the "500" has the same weighting as Nvidia or Microsoft. What stands out, though, is the recent performance of these companies over the past couple of weeks, with the index having performed well on strong breadth.
The recent selling put the SPY much deeper in the hole, but this index has moved up sharply and now matches the RSP level. That's a great sign for the bullish trend to continue. When these two ETFs move together higher, it is a signal that the bulls are in charge. The RSP performed better than the SPY in November.
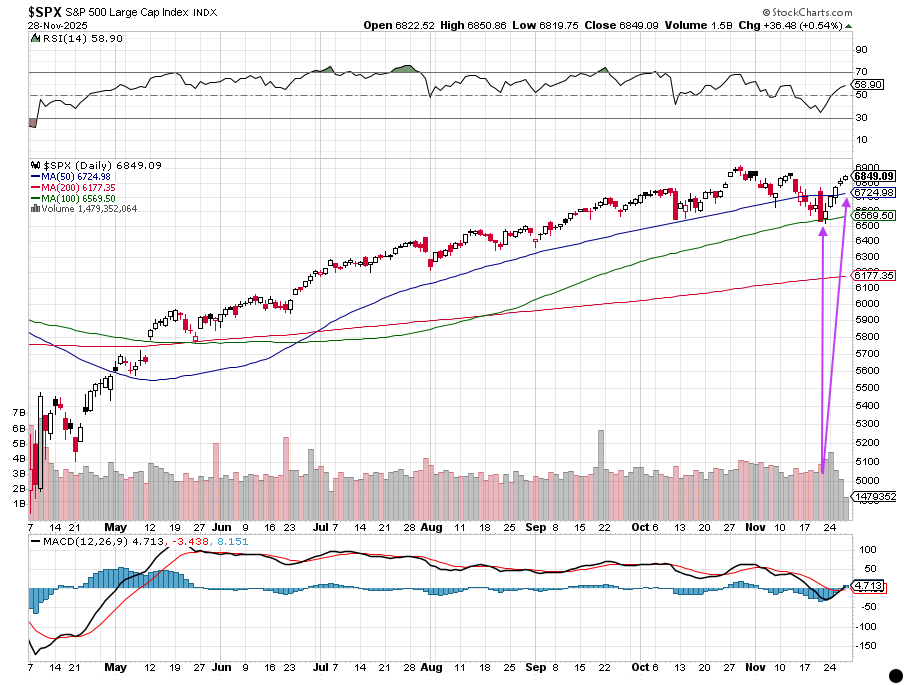
We have talked about breadth in the past and how important this indicator is for a market trend to continue. The first couple of weeks in November saw very poor breadth, and price action followed along with bearish volume trends. It was a potent mixture and pointed towards a corrective phase that brought the S&P 500 down to the 100-day moving average, where it bounced from and continues to be supportive.
With the indexes less than 2% away from all-time highs, what is next? We believe the seasonally bullish trends, which heavily favor more upside, and the bullish indicators are going to lead the S&P 500 up towards 7K before year's end.
Other charts we shared with you this past week were:
Monday, November 24: S&P 500 - Tread With Caution as Bears Come Out
Monday, November 24: Credo Technology (CRDO) - This 'Diplomat' Has a Good Look
Tuesday, November 25: Meta Platforms (META) - Meta Will Rise Again
Wednesday, November 26: Nvidia (NVDA) - Give Nvidia Time to Settle Down
The Week Ahead
Entering December, the Atlanta Fed’s GDPNow model pegs current quarter GDP at 3.9%, but being the start of a new month, we know that figure is bound to change as the flow of November data begins. Ahead of that wave, the market sees an 87% probability the Fed will deliver a 25-basis point rate cut on December 10 and 69% probability it takes no action at its January policy meeting.
Looking further out toward the end of 2026, the current market thinking is that the Fed funds rate will land somewhere between 2.75%-3.25%. Compared to the current 3.75%-4.00%, that implies the market sees three to four 25 basis point cuts over the coming 13 months. Those expectations will no doubt be influenced by the oncoming data, especially as some of the missing pieces from the government shutdown are filled in.
While we will be closely watching what the data say about the Fed’s key area of concerns, namely the employment market and inflation, we’ll also be assessing the overall picture of the economy, repositioning the Pro Portfolio as needed. That means we will be laser-focused on the November data from ISM as well as ADP’s November Employment Change Report, and the November Challenger Job Cuts report.
Should the data show a pickup in job creation and inflation pressures inching higher, we could see the market get a tad volatile as folks have to rethink the prospect of a rate cut next week. Remember, the Fed is currently in its pre-meeting blackout period, which means there won’t be any Fed officials offering their take on how this week’s data could shape monetary policy.
We will also be digging through the latest Construction Spending data with an eye toward what it tells us about end-market activity for our positions in United Rentals (URI) and Eaton (ETN) . We recognize that at this point, the data are a few months behind, but it should help us fill in some missing blanks, nonetheless.
Here's a closer look at the economic data coming at us next week:
U.S.
Monday, December 1
· S&P Manufacturing PMI (Final) – November (9:45 AM ET)
· ISM Manufacturing PMI – November (10:00 AM ET)
· Construction Spending – October (10:00 AM ET)
Tuesday, December 2
· RCM/TIPP Economic Optimism Index – December (10:10 AM ET)
Wednesday, December 3
· MBA Mortgage Applications Index – Weekly (7:00 AM ET)
· ADP Employment Change Report – November (8:15 AM ET)
· S&P Global Services PMI (Final) – November (9:45 AM ET)
· ISM Services PMI – November (10:00 AM ET)
· EIA Crude Oil Inventories – Weekly (10:30 AM ET)
Thursday, December 4
· Initial & Continuing Jobless Claims – Weekly (8:30 AM ET)
· Challenger Job Cuts Report – November (7:30 AM ET)
· EIA Natural Gas Inventories – Weekly (10:30 AM ET)
Friday, December 5
· Personal Income & Spending, PCE Price Index – September (10:00 AM ET)
· Factory Orders – October (10:00 AM ET)
· Michigan Consumer Sentiment Index (Prelim) – December (10:00 AM ET)
International
Monday, December 1
· Eurozone: HCOB Manufacturing PMI – November
· UK: S&P Global Manufacturing PMI - November
Tuesday, December 2
· Japan: Consumer Confidence – November
· Eurozone: Inflation Rate (Flash) – November
· Eurozone: Unemployment Rate - October
Wednesday, December 3
· Japan: S&P Global Service PMI - November
· China: Rating Dog Services PMI – November
· Eurozone: HCOB Services PMI - November
· UK: S&P Global Services PMI - November
· Eurozone: Producer Price Index - October
Thursday, December 4
· Eurozone: Retail Sales - October
Friday, December 5
· Japan: Leading Economic Index (Prelim) – October
· Eurozone: GDP, Employment Change – Q3 2025 (Final)
This week Marvell (MRVL) will report its quarterly results. While many will be focused on its top and bottom-line results, we will also be looking to see more progress on its custom AI silicon front, while its enterprise networking and carrier infrastructure business stands to benefit from rising data traffic. In addition to Marvell, we’ll be hearing from another wave of realtors, which should include their Black Friday-Cyber Monday results. We’ll be curious to see if those results bring more validation for our positions in Costco (COST) , TJX (TJX) , and Amazon (AMZN) .
Also on deck are Salesforce (CRM) and Snowflake (SNOW) , and the attention will be on subscription revenue and backlog levels, as well as AI’s part of the revenue mix. And following up on Dell’s comments about AI server demand and shipments, we look forward to what Hewlett Packard Enterprise (HPE) has to say on that front and what it means for AI chip demand at Nvidia (NVDA) , Marvell, and others.
Here's a closer look at the earnings reports coming at us next week:
Monday, December 1
· Close: Credo Technology (CRDO)
Tuesday, December 2
· Open: Signet Jewelers (SIG)
· Close: American Eagle (AEO), Box (BOX), CrowdStrike (CRWD), Marvell (MRVL), Okta (OKTA), Pure Storage (PSTG)
Wednesday, December 3
· Open: Dollar Tree (DLTR), Macy’s (M),
· Close: C3.ai (AI), Five Below (FIVE), PVH (PVH), Salesforce (CRM), Snowflake (SNOW)
Thursday, December 4
· Open: Dollar General (DG), Hormel Foods (HRL), Kroger (KR), Science Applications (SAIC)
· Close: Cooper (COO), Hewlett Packard Enterprise (HPE), SentinelOne (S), ServiceTitan (TTAN), Ulta Beauty (ULTA)
Friday, December 5
· Open: Victoria’s Secret (VSCO)
Portfolio Investor Resource Guide
· Economic Data: Here's a List of Links to the Key Economic Data We Closely Watch
· Investing Terminology: 16 Key Terms Club Members Should Know
· 10-Ks: Want to Know About a Stock? Read the Company's Reports
· 10-Qs: Unlock the Numbers and Key Information Behind Your Stock With the 10-Q
· Income Statement: Our Cheat Sheet to Understanding This Financial Document
· Balance Sheet, Cash Flow Statements, and Dividends: How to Know If a Company Is Off-Kilter? Read Its Balance Sheet
· Valuation Metrics: Everyone Wants a Value. Here's How Investors Can Find
· Thematic Investing 101 Webinar
· Like the Benefits of ETFs? Let’s Talk About Models
The Portfolio Ratings System
1 - Buy Now (BN): Stocks that look compelling to buy right now.
2 - Stockpile (SP): Positions we would add to on pullbacks or a successful test of technical support levels.
3 - Holding Pattern (HP): Stocks we are holding as we wait for a fresh catalyst to make our next move.
4 - Sell (S): Positions we intend to exit.
ONES
Amazon AMZN; $233.22; 881 shares; 3.74%; Sector: Consumer Discretionary
UPDATE: Coming off their double-digit October move, shares of Amazon (AMZN) gave back some of those gains in November, leaving them up more than 6% with one month to go in the year. That move lower came despite several big wins for Amazon Web Services following September-quarter earnings call comments from Amazon management that it had a large number of pending deals to announce. One of those was with OpenAI, worth $38 billion, to help supply it with “hundreds of thousands” of Nvidia's GPUs. In mid-November, AWS expanded its deal with Saudi Arabian artificial intelligence firm Humain to deploy Nvidia GPUs, as well as Amazon's own Trainium processors. Alongside that, it was announced AWS would become Humain's preferred AI partner globally, and the two plan to bring more AI compute and services from Saudi Arabia to customers worldwide. We expect more on Amazon’s AI advancements and wins for AWS to be highlighted at Amazon’s re:Invent 2025 event that spans December 1-5. We continue to see Amazon’s digital shopping business benefiting from consumers looking to tap sales and deals to extend their shopping dollars, especially during the holiday season. Adobe Analytics reported that U.S. consumers spent a record $11.8 billion online on Black Friday, marking a 9.1% jump year over year and a higher dollar spend than Adobe’s $11.7 billion estimate. Consumers also spent a record $6.4 billion online on Thanksgiving Day, per Adobe. Adobe expects U.S. shoppers to spend another $5.5 billion on Saturday and $5.9 billion on Sunday — before reaching an estimated $14.2 billion peak on Cyber Monday, which would mark yet another record. We also see Amazon’s higher-margin advertising business flourishing during the holiday shopping season, especially as it continues to flex advertising on Prime Video. Outside of the company’s core businesses, a recent 13F-HR filing revealed Amazon held a stake of 158.36 million shares in Rivian and 225,428 shares in Marvell, as well as positions in other companies. With multiple catalysts on the horizon, we reiterate our One rating on AMZN shares.
November Price Change: -4.5%; Yield: 0.0%
INVESTMENT THESIS: We believe the upside will result from Amazon's continued e-commerce dominance, AWS's continued leadership in the public cloud space, and the ongoing growth of the company's advertising revenue stream, which feeds off Amazon's e-commerce business. Additionally, we think profitability will continue to improve as AWS and advertising account for a larger portion of total sales, as both these segments sport higher margins than the eCommerce operation. While we believe the increasing share of the revenue from these higher-margin businesses will be key to driving profitability longer-term, we think margins on eCommerce stand to improve as the company's infrastructure is further built out and economies of scale further kick in. The embedded call option is that management is always looking to enter a new space and generate new revenue streams.
Target Price: Reiterate $310; Rating: One
Panic Point: $210
RISKS: High valuation exposes the stock to volatile swings, e-commerce has exposure to slower consumer spending and competition, potential headwinds resulting from new e-commerce regulation in India, and management is not scared to invest aggressively for growth, which can at times cause volatile reactions as near-term concerns arise relating to the impact on margins.
Arista Networks ANET; $130.68; 1,325 shares; 3.15%; Sector: Technology
UPDATE: In early October, the Portfolio initiated a new position in Arista Networks (ANET) , and later in the month, we picked up another slug of shares following Nvidia's announcement of networking wins with Oracle and Meta for AI data centers. We made multiple moves to increase the Portfolio’s exposure to ANET shares during November. Cementing the decision to do so was the company’s increasing deferred revenue exiting the September quarter and subsequent data-center announcements in October and November. We nibbled further on ANET shares on November 10 as renewed market concerns about artificial intelligence weighed on the stock. Following Dell’s October-quarter guidance that calls for a sequential increase of more than 65% for its AI server business, we scooped up more ANET for the Portfolio. Recent quarterly guidance from Nvidia as well as Dell sets the stage for an upbeat presentation by Arista management when it presents at the UBS Global Technology and AI Conference on December 2. The team will also be presenting at the Raymond James TMT and Consumer Conference on December 9 and the Barclays 23rd Annual Global Technology Conference on December 11. Following that last addition, we maintained our $180 price target and inched our panic point down to $110 from $120, although as the shares rebound, we expect to raise that level over time. Catalysts that could lead us to revise our price target higher include stronger-than-expected AI and data-center capital spending efforts from key Arista customers, Microsoft, and Meta, as well as others in the AI and data-center space.
November Price Change: -17.1%; Yield: 0.00%
INVESTMENT THESIS: Arista Networks engages in the development, marketing, and sale of data-driven, client-to-cloud networking solutions for AI, data center, campus, and routing environments in the Americas, Europe, the Middle East, Africa, and the Asia-Pacific. Its cloud networking solutions consist of Extensible Operating System (EOS), a publish-subscribe state-sharing networking operating system offered in combination with a set of network applications. The company offers data center, cloud, and AI networking, cognitive adjacencies, and cognitive network software and services. It also provides post-contract customer support services, such as technical support, hardware repair, and replacement parts beyond standard warranty, bug fixes, patches, and upgrade services. The company serves a range of industries comprising internet companies, cloud service providers, financial services organizations, government agencies, media and entertainment, healthcare, oil and gas, education, manufacturing, industrial, and others. Two the Arista’s largest customers in the last few years are two Portfolio holdings you’ll quickly recognize — Microsoft and Meta. Per Arista’s 10-K filings, both Meta and Microsoft each account for more than 10% of revenue. Other named customers include Amazon’s AWS, Google Cloud, Anthropic, Canva, SAP, Shopify, Apple, Oracle, Bank of America, and Accenture.
Target Price: $180; Rating: One
Panic Point: $110
RISKS: Economic, customer, supply chain, and competition risks.
Axon Enterprise AXON; $540.14; 377 shares; 3.70%; Sector: Aerospace & Defense
UPDATE: When we added Axon (AXON) back to the Portfolio, and as evidenced in recent weeks, we recognized that the higher beta associated with the shares can exacerbate their movements in a volatile market. We saw that unfold in November to the downside as AXON fell to a low near $519 before rebounding to close the month near $541. In early November, we used big gains from our exit of Vulcan Materials to pick up some additional AXON shares following the company’s latest quarterly results. Annual recurring revenue climbed 41%, year over year, to $1.3 billion, while net revenue retention held steady at 124%. More importantly, future contracted bookings climbed to $11.4 billion, a nice step up from $10.7 billion exiting the June quarter, and that led Axon to nudge its full-year revenue outlook to approximately $2.74 billion, up from a previous range of $2.65 billion-$2.73 billion. Compared to the adjusted EBITDA of $177 million delivered in the September quarter, management targets $178 million-$182 million in the current one, which means Axon narrowed its 2025 adjusted EBITDA guidance to $681 million-$685 million from its prior guidance of $665 million-$685 million in June and $650 million-$675 million earlier this year. Subsequent to that report, AXON shares followed the market lower, entering an oversold condition. On November 20, we scooped up another slug of shares following a thesis-confirming report that showcased how Axon is expanding its addressable market with the Cincinnati Police Department. For us, the Axon story continues to be centered on the mix shift toward the higher-margin, recurring revenue services business, as well as continued growth for its hardware business in federal, corporate, and international markets. Upcoming catalysts for the stock include management presentations at the UBS Global Technology and AI Conference on December 2, Barclays 23rd Annual Global Technology Conference on December 11, and the Northland Capital Virtual Conference on December 16.
November Price Change: -26.2%; Yield: 0.0%
INVESTMENT THESIS: Axon Enterprise develops, manufactures, and sells conducted energy devices and cloud-based digital evidence management software designed for use by law enforcement, corrections, military forces, private security personnel, and private individuals for personal defense. The company operates in two segments: Taser (recently renamed Connected Devices) and Software & Sensors (recently renamed Software & Services). Taser develops and sells CEDs used for protecting users and virtual reality training. Software & Sensors manufactures fully integrated hardware and cloud-based software solutions such as body cameras, automated license plate reading, and digital evidence management systems. Axon delivers its products worldwide and gets most of its revenue from the United States. According to Mordor Intelligence, the wearable and body-worn cameras market on its own was valued at $1.62 billion in 2020 and is expected to reach $424.63 billion by 2026. Public safety organizations are increasingly adopting cloud solutions, leading to significant spending in this area. The digital spending in public safety is projected to reach $201 billion by 2027.
Target Price: Reiterate $800; Rating: One
Panic Point: $500
RISKS: Manufacturing and supply chain, competitive factors, government regulation, and technology change.
Costco Wholesale COST; $913.59; 237 shares; 3.94%; Sector: Consumer Staples
UPDATE: Shares of Costco (COST) were little changed in November despite multiple proof points that the company continues to win consumer wallet share. That flat performance for the month masks the pressure COST shares were under for the bulk of November. After looking at quarterly comps sales figures from Target, Home Depot and others that paled in comparison to Costco’s August 2025 to October 2025 adjusted comp sales figures, we picked up more COST shares for the Portfolio at $882.50 on November 19. While we too have been frustrated with COST shares of late, it’s confirmations like those that keep us patient, and that patience paid off as the stock rebounded for the balance of the month. We continue to see Costco well-positioned to take further consumer wallet share during the holiday season, even as it continues to lap robust adjusted comp sales figures. On December 3, Costco will publish its November comp sales figures, and shortly thereafter, on December 11, the company will deliver its latest quarterly earnings report. In that report, we’ll look for an update on management’s efforts to expand its warehouse footprint by 30 units in the current fiscal year. We see that effort continuing to drive membership higher, which will grow the membership fee revenue stream and increase Costco’s operating income along the way. We continue to favor that differentiated business model, one that sets Costco apart from other retailers.
November Price Change: 0.20%; Yield: 0.57%
INVESTMENT THESIS: We like Costco's long-term prospects, driven by a club-based operating model that focuses on volumes, not margins, and therefore offers its customers a value proposition of everyday low prices. The strength of this model has created an incredibly loyal customer base with low churn and continued share gains in both brick-and-mortar and e-commerce. This is a global concept, evidenced by the strength of sales both in the U.S. and abroad, which includes an emerging China opportunity. We see the company's membership model as a key differentiator versus other retailers, and its plans to open additional warehouse locations in the coming quarters should drive retail volumes and the higher-margin membership fee income as well. We also appreciate management's approach to capital returns and their willingness to return cash.
Target Price: Reiterate $1,200; Rating: One
Panic Point: $825
RISKS: Inability to pass through higher costs, fuel prices, weaker consumer, and membership churn.
Eaton Corp. ETN; $345.89; 593 shares; 3.73%; Sector: Industrials
UPDATE: After climbing more than 9% since the end of August, renewed market concerns over the AI trade in November weighed on Eaton (ETN) shares, leading them to fall back to where they were at the end of August. Helping spur that move lower was the fact that after delivering a September-quarter earnings beat, Eaton “only” reiterated its 2025 adjusted EPS guidance of $11.97-$12.17, up ~12% year over year at the midpoint. However, sifting through the company’s earnings presentation and conference call reveals that it continues to benefit from data-center demand. Per management, data-center orders for its electrical business were up ~70% in the September quarter, and backlog for its Electrical America’s segment was up $2 billion or 20% year over year. And as we discuss backlog, we’ll toss in that figure for Eaton’s Aerospace business was up 15% year over year exiting the September quarter. Better days are ahead for that segment as well. What those figures do not include are some of the big AI and data-center announcements we’ve witnessed over the last two months, which means Eaton's backlog is poised for another move higher when it reports the current quarter. Helping support that view are the more recent AI server shipment expectations from Dell. That September backlog figure also doesn't include Eaton’s acquisition of the Boyd Thermal business. Roughly 80% of Boyd’s business supports its data-center segment, according to Eaton, which implies the company is positioned to pick up more content dollars per data center. Initial expectations are that the Boyd business will bring in ~$1.7 billion in 2026 with an adjusted EBITDA margin near 25%. Pulling the lens back, Brookfield Asset Management estimates that AI infrastructure will sop up $7 trillion over the next 10 years. Deloitte sees U.S. power sector investments reaching $1.4 trillion between 2025 and 2030. This six-year outlay is equivalent to the total capital expenditure of the U.S. power sector over the preceding 12 years, underscoring the challenge and the opportunity that lies ahead. The ICF projects significant increases in U.S. electricity demand over the next 25 years, with demand rising 25% by 2030 and 78% by 2050. In the near term, the U.S. Energy Information Administration (EIA) has raised its projections for electricity consumption in the country, citing a spike in power demand from commercial sectors — especially data centers — as a key driver. In its latest update of the Short-Term Energy Outlook (STEO), the EIA said it expects total U.S. electricity demand to rise from 4,097 billion kilowatt-hours (kWh) last year to 4,193 billion kWh in 2025, and 4,283 billion kWh in 2026. A more dovish Fed policy could be an added tailwind in the coming quarters as it would reduce project hurdle rates, fostering incremental construction activity. The November pullback in ETN shares leaves just over 20% upside to our price target, giving us ample room to reiterate our One rating.
November Price Change: -9.3%; Yield: 1.20%
INVESTMENT THESIS: Eaton is an intelligent power management company that makes products for data center, utilities, industrial, commercial, machine building, residential, aerospace, and mobility markets. That business is positioned to capitalize on the mega trends of electrification, energy transition, and digitalization. We see Eaton helping address the power pain point created by data center, EV charging infrastructure, and other drivers of electricity demand. Research estimates that data center power demand will grow 160% by 2030, accounting for 3% to 4% of global power, up from 1% to 2% today. Data centers will use 8% of U.S. power by 2030, compared with 3% in 2022.
Target Price: Reiterate $420; Rating: One
Panic Point: $325
RISKS: Raw material costs, labor costs, end market volatility, and government legislation.
Marvell Technology MRVL; $89.40; 2,330 shares; 3.79%; Sector: Technology
UPDATE: While shares of Marvell Technology (MRVL) surged more than 15% in the last week of November, for the month, they declined over 4% amid renewed market AI trade concerns. During November, we used the short-term overreaction in MRVL shares, fueled by dated reports that Softbank explored a takeover opportunity in Marvell earlier this year, to lock in a slice of massive profits on this position. Because we continue to see Marvell benefiting from multiple tailwinds, including AI and data center spending, its ramping custom AI silicon business, and an accelerating rebound in its enterprise networking and carrier infrastructure business, we maintained a meaningful exposure to the shares following that opportunistic move. Underscoring that view are the recent announcements by Amazon Web Services, Microsoft, and others, as well as reports that Meta will spend “billions of dollars” on Google data center chips beginning in 2027. Marvell supplies general-purpose processors (CPUs) for use in Google's data centers to run various services. Marvell also currently makes custom AI chips for the likes of Google, Amazon, and Microsoft, including Amazon’s Trainium AI chips, and is reportedly working with Google as a potential secondary supplier for TPUs. That jives with the increased total addressable market figures and more than 50 new pipeline opportunities Marvell management highlighted earlier this year and reiterated during its August earnings call. To that, we can add Cisco’s 2025 Global AI Readiness Index shows that only one-third of organizations feel their IT infrastructure can accommodate the needs of their planned AI projects. This sets the stage for Marvell’s quarterly earnings report on December 2. As we digest that report, we’ll revisit our $125 price target as needed.
November Price Change: -4.6%; Yield: 0.27%
INVESTMENT THESIS: Marvell is a fabless supplier of high-performance standard and semi-custom infrastructure semiconductor solutions. These solutions power the data economy, enabling the data center, carrier infrastructure, enterprise networking, consumer, and automotive/industrial end markets. With roughly 75% to 80% of Marvell's revenue stream tied to digital infrastructure, we see it continuing to benefit from rising content consumption and creation. Pointing to that rising demand that necessitates network densification and the build of digital infrastructure, Ericsson sees global monthly average usage per smartphone reach 46 gigabytes (GB) by the end of 2028, versus 19 GB in 2023 and 15 GB in 2022.
Target Price: Reiterate $125; Rating: One
Panic Point: $75
RISKS: Technology risk, customer risk, competition risk, reliance on manufacturing partners, and supply chain constraints.
Meta Platforms META; $647.95; 337 shares; 3.97%; Sector: Communication Services
UPDATE: Shares of Meta (META) were little changed in November, leaving them up double-digits year-to-date. That net change for the month glosses over the sharp pullback in the shares during the first three weeks of the month and their subsequent sharp rebound in the final one. During the move lower, we added to the Portfolio’s position twice, once on November 10 and again on November 20. While we will continue to monitor Meta’s spending levels, we continue to see the company benefiting from the accelerating shift to digital advertising, especially as it looks to monetize all of its platforms, not just Facebook and Instagram. At the same time, internal adoption of AI should help drive improved profitability over the long term as those advertising volumes rise. Helping reaffirm that line of thinking, new data from Photoshelter found that 95% of marketers lean on social platforms to drive marketing outcomes, with two-thirds saying it is the primary channel that delivers results for their organization. As we think about that, let’s also consider how Meta is using AI to improve the profitability of its advertising business, which is also poised to expand beyond Facebook and Instagram to include its Threads and WhatsApp platforms. As we see it, greater monetization across more platforms that reach the company’s total daily active user base of 3.54 billion is a combination for higher revenue and eventually higher margins as opex levels return to more normalized levels as Meta’s AI investments mature. As part of our tracking of AI adoption and usage rates, we will monitor Meta’s progress in not only the consumer market, but also the enterprise and government ones, following Meta’s AI models becoming a part of the U.S. General Services Administration (GSA) OneGov initiative in September. With ample upside to our $850 target and multiple tailwinds at the company’s back, we reiterate our One rating on META shares.
November Price Change: -0.1%; Yield: 0.32%
INVESTMENT THESIS: Meta segments its business between Family of App Products, which includes Facebook, Instagram, Messenger, Threads, and WhatsApp, and Reality Labs Products, which includes its metaverse and investments and future product R&D. Family of Apps accounts for about 99% of the company's revenue and 100% of company operating profits. Substantially all of Meta’s revenue is currently generated from advertising on Facebook and Instagram. Family daily active people (DAP) were 3.54 billion on average for the September 2025 quarter. Meta expects to spend $70 billion to $72 billion on capex in 2025, a significant increase year over year, with most of this spending focused on AI infrastructure and initiatives. Meta is positioned to benefit from the ongoing shift toward digital advertising and the adoption of AI across its product offerings. We recognize Meta is ramping up capital spending as part of the current AI arms race, but we see that as an investment that should drive productivity in its core advertising business. As the company harvests that investment, we could see a step up in margins, much like we saw in 2023.
Target Price: $850; Rating: One
Panic Point: $560
RISKS: Ability to add and retain users and user engagement; marketing spend; new products or changes to existing ones; competitive risk, geopolitical risk.
Nvidia Corp. NVDA; $177.00; 1,120 shares; 3.60%; Sector: Technology
UPDATE: Following the cumulative gain in the shares of Nvidia (NVDA) since their April bottom that pushed the shares into an overbought condition, we locked in some massive gains on October 29. The timing of that trade preceded renewed market worries over what’s being called the “AI trade,” a development that led Nvidia shares and several others to decline sharply in November. For Nvidia, that move lower totaled more than 12%, but on a year-to-date basis, the shares closed November up more than 30%. In response to Nvidia’s October 2025 quarterly results, which bested market consensus forecasts, we increased our NVDA target to $250 from $230. That increase reflected a few factors. One was the company’s guidance for the current quarter that calls for total revenue of $65.0 billion, nicely ahead of $62.17 billion consensus, with further improvement in gross margins. Management targets those margins to reach 74.5% to 75.5%, which makes sense as it continues to move down the Blackwell learning curve. During the company’s earnings call, CEO Jensen Huang shared that the company has visibility into $0.5 trillion in chip revenue from “the start of this year through the end of calendar year 2026." Jensen also reiterated his bullish stance on the buildout of AI infrastructure, which he sees reaching $3 trillion $4 trillion on an annual basis by the end of the decade. Measured against where we see current AI adoption and usage levels and Dell’s record backlog, we agree with that assessment on a directional basis. Subsequent AI and data center investment announcements add another layer of support for Nvidia’s outlook. On November 25, we noted that we were looking to see if NVDA shares held support at the 100-day moving average at $180.52. As we came to see, they did not. We see a vibrant tailwind behind Nvidia’s prospects, but we will be mindful of the technical setup before recommending any next steps with the shares. Upcoming data points we’ll be watching include November revenue reports from Taiwan Semiconductor and Foxconn, and other indicators of AI adoption.
November Price Change: -12.6%; Yield: 0.02%
INVESTMENT THESIS: Nvidia is well-positioned to benefit from ramping AI and data center spending. The company pioneered accelerated computing to help solve the most challenging computational problems. Nvidia is now a full-stack computing infrastructure company with data-center-scale offerings that are reshaping the industry. The company's full stack includes the foundational CUDA programming model that runs on all Nvidia GPUs, as well as hundreds of domain-specific software libraries, software development kits, or SDKs, and Application Programming Interfaces, or APIs. This deep and broad software stack accelerates the performance and eases the deployment of Nvidia accelerated computing for computationally intensive workloads such as artificial intelligence, model training and inference, data analytics, scientific computing, and 3D graphics, with vertical-specific optimizations to address industries ranging from healthcare and telecom to automotive and manufacturing. Nvidia reports in two business segments: Compute & Networking and Graphics. The Compute & Networking segment (78% of revenue, 85% of operating income) is comprised of Data Center accelerated computing platforms and end-to-end networking platforms, including Quantum for InfiniBand and Spectrum for Ethernet; NVIDIA DRIVE automated-driving platform and automotive development agreements; Jetson robotics and other embedded platforms; Nvidia AI Enterprise and other software; and DGX Cloud software and services. The Graphics segment (22% of revenue, 15% of operating income) includes GeForce GPUs for gaming and PCs, the GeForce NOW game streaming service and related infrastructure; Quadro/NVIDIA RTX GPUs for enterprise workstation graphics; virtual GPU, or vGPU, software for cloud-based visual and virtual computing; automotive platforms for infotainment systems; and Omniverse Enterprise software for building and operating metaverse and 3D internet applications.
Target Price: $230; Rating One
Panic Point: $160
RISKS: Market and interest rate risk, credit risk, country risk, and operational risk, including cybersecurity.
Palantir Technologies PLTR; $168.45; 1,120 shares; 3.43%; Sector: Financial Services
UPDATE: Coming off the cumulative July-October 2025 move of more than 47% in Palantir (PLTR) shares, expectations were running extremely high for the company’s September-quarter earnings report. What we saw in Palantir’s report and guidance, which was a mixture of customer-count growth, rising contract values, and improving margins, keeps us bullish on the company’s prospects and further upside in the shares despite the 16% move lower in November. To that, we can add the significant jumps in Palantir’s total remaining deal value to $8.6 billion and remaining performance obligations to $2.6 billion exiting the September quarter. In the September 2025 quarter, the company’s adjusted operating margin hit 51%, up from 38% in the year-ago quarter and 46% in the June 2025 one. Impressive, but even more so when we examine the incremental margins. What this means is that for every incremental dollar in revenue, the company posted incremental adjusted operating margins of more than 70% in the September quarter. That’s up from 65% in the first half of 2025 and points to more operational leverage to come as Palantir converts its outstanding contract value into revenue. Understanding that, we used the post-earnings reaction in the shares to pick up more for the Portfolio on November 10. We’ve discussed our belief that we are in the third or fourth inning of AI adoption, and how we are closely watching AI adoption and usage levels, and to that we can add trends in backlog, total contract value, and total remaining performance obligation levels at Palantir and other companies. The findings of Cisco’s 2025 Global AI Readiness Index, which shows only one-third of organizations feel their IT infrastructure can accommodate the needs of their planned AI projects, suggest there is ample room to go in enterprise AI adoption. We want to remain shareholders of Palantir and look to benefit from the rising AI adoption levels, Palantir recognizing that operational leverage we discussed above and how that benefits profits and the bottom line. In addition to the larger AI adoption red flags we are watching for, as it relates to Palantir specifically, if we see those wonderful incremental operating margins begin to drop on a sustained basis, it could be time to reconsider PLTR shares' place in the Portfolio.
November Price Change: -16.0%; Yield: 0.0%
INVESTMENT THESIS: Palantir Technologies specializes in big data analytics and builds software platforms that help organizations integrate, analyze, and make sense of vast amounts of data for both commercial and government clients. While much has been made about the company’s exposure to the federal government, its software is used across 90 industries, and the larger global government sector accounted for 55% of revenue last year. The balance was from the commercial sector. Exiting Q3 2025, Palantir’s Commercial remaining deal value (RDV) stood at $3.63 billion, up from $1.79 billion exiting 2024. We will continue to monitor Palantir’s RDV and deferred revenue metrics, but in our view, key items to watch will be the continued diversification of its customer base across industries and increasing revenue per customer. Both have made considerable progress so far in 2025, with Commercial revenue expected to account for 33% of total revenue this year, up from 24.5% in 2024. Because we are still in the relatively early innings of AI adoption, we are inclined to be long-term owners of PLTR shares.
Target Price: $220; Rating: One
Panic Point: $150
RISKS: Economic and IT budget spending risk, technology risk, competition and competitive pressures, and customer acquisition risk.
ServiceNow NOW; $812.41; 245 shares; 3.62%; Sector: Technology
UPDATE: Along with other stocks tied to the larger AI trade, shares of ServiceNow (NOW) moved sharply lower in November. Because we are still in the relatively early innings of AI adoption inside the enterprise, which is also continuing to adopt the cloud, we used that decline to scoop up more NOW shares for the Portfolio. We made our first move on November 10, following the end of the government shutdown, and again on November 20 as the shares rebounded from being deeply oversold. Underscoring our action, exiting the September quarter, ServiceNow’s current remaining performance obligations (CRPOs) stood at $11.35 billion, up 21% year over year, while total RPOs were at $24.3 billion, up 24% year over year. Those gains reflect a combination of customer wins, increasing customer penetration, and the impact of AI adoption by those customers. Digging into ServiceNow’s quickly filed 10-Q for the quarter, management sees 47% of that total RPO being recognized as revenue in the coming 12 months. Against that kind of visibility, the prospects for further margin leverage as AI becomes a greater part of the revenue mix are favorable. To us, the combination of rising revenue and margin expansion is a combination we can get behind. We continue to think we are only in the third or fourth inning, at most, when it comes to AI adoption and usage. We will continue to monitor those levels, and should we see the incremental growth rate begin to slow, that could be a reason to revisit our position in NOW. Our NOW target remains $1,200, but we expect to adjust that following a shareholder special meeting on December 5 that should approve an announced 5-for-1 stock split. While we see that move as largely cosmetic in nature, it could help stir incremental investor interest. Upcoming catalysts for NOW shares include Amazon’s AWS re:Invent 2025 event that spans December 1-5, the Gartner IOCS 2025 event that runs from December 8-11, and management’s presentation at the Barclays 23rd Annual Global Technology Conference on December 10.
November Price Change: -11.6%; Yield: 0.0%
INVESTMENT THESIS: The addition of ServiceNow adds exposure to the enterprise as it deploys AI-enabled solutions across its enterprise workflow platform. The company’s “Now Platform” is a cloud-based solution with embedded AI and machine learning (ML) capabilities that help unify and digitize workflows, driving productivity. At the heart of it, the company’s platform automates workflows across an entire enterprise by connecting disparate departments, systems, and silos in a seamless way to unlock productivity. ServiceNow counts more than 8,100 global customers, including 85% of the Fortune 500, with 97% of its revenue from subscriptions that have notched a 98% renewal rate. During the March 2025 quarter, ServiceNow also announced plans to acquire Moveworks, which offers front-end AI assistant and enterprise search technology, and Logik.ai, which provides AI-powered, and composable configure, price, and quote solutions for sales teams. We see these moves augmenting its offering and helping pave the way for further adoption of AI and subscription-based revenue.
Target Price: Reiterate $1,200; Rating: One
Panic Point: $750
RISKS: Industry and economic risk, competition and competitive pressures, and acquisition risk.
SuRo Capital SSSS; $9.25; 22,115 shares; 3.72%; Sector: Financial Services
UPDATE: After posting a string of sequential monthly gains, including a double-digit one in October, shares of SuRo Capital (SSSS) ended November down 9%, following the net November move lower in CoreWeave (CRWV) shares. While off their lows for the month, the end of November left our position in SSSS up almost 17% so far this year before factoring in the company’s recent $0.25 per share dividend or its upcoming one. In early November, SuRo reported its September-quarter results, which contained few surprises given its preliminary Q3 2025 portfolio update shared in early October. As telegraphed, the net asset value per share for its investment portfolio came in at $9.23, almost the midpoint of $9.00-$9.50 range offered in the October update. As we discussed at the time, that September-quarter figure was determined using OpenAI’s $300 billion valuation from earlier this year, not the more recent one of $500 billion. When SuRo reports its December quarter in late January-early February, that is when that updated valuation will be baked into its NAV per share figure. It will also incorporate movements in its other portfolio holdings. Recognizing that upcoming adjustment, we lifted our SSSS price target to $12 several weeks ago, and for the time being, it will remain there. After the September quarter closed, SuRo took another step in monetizing its CRWV position, saying that as of November 4, it still had 71.8% of its investment in the CW Opportunity 2 LP, down from 83.4% on September 30. Some of the proceeds and cash on hand are likely to be used for other purposes. One of those is investments in new companies or building its positions in existing ones, something that is par for the course with the Pro Portfolio. Another purpose is buying back either SuRo’s share of its notes or its shares. Alongside the September-quarter earnings report and dividend declaration, the company’s board of directors approved an extension of $40 million for the existing discretionary notes program and also extended its October 2024 $64.3 million share-repurchase program to October 31, 2026. Under that program, SuRo has already repurchased over 6 million shares or $39.3 million, leaving $25 million remaining. We continue to suspect a special dividend announcement is likely given the company’s BDC structure, but we are inclined to remain longer-term investors in SSSS shares to capture additional upside as SuRo continues to monetize its Portfolio, moves that should also enable further dividend payments.
November Price Change: -9.2%; Yield: 5.41%
INVESTMENT THESIS: SuRo Capital is a business development company (BDC) that invests in high-growth, venture-backed private companies. As SuRo monetizes those portfolio investments through either IPO or M&A transactions, it must pay out most of its earnings to shareholders in the form of dividends. What’s important to factor into our thinking is that SuRo’s strategy isn’t to hold public company investments but rather to monetize them following the lock-up expiration. Sometimes this can be immediate, and sometimes it can be in stages, but when that monetization occurs, it triggers dividend payments. And because a BDC must pay out at least 90% of its taxable income through dividends to shareholders, there is the possibility of a special dividend to hit that qualifying threshold late in the year. As we think about this, it means that we should focus on total return with SSSS, which is defined as capital gains in the shares plus dividends received while owning them. What this means is even if we see SSSS shares trade sideways or move lower, depending on the size of the dividend payments in the coming quarters, the position’s total return could still be sizable for the Pro Portfolio. SuRo's portfolio holdings at the end of June included CoreWeave, ServiceTitan, OpenAI, Liquid Death, Whoop, and fintech company Plaid, as well as roughly 30 other holdings.
Target Price: $12; Rating: One
Panic Point: $8.00
RISKS: Industry and economic risk, competition and competitive pressures, and acquisition risk.
Waste Management WM; $217.87; 1,000 shares; 3.96%; Sector: Industrials
UPDATE: As we prepared to enter November, we continued to build up the Portfolio’s exposure to Waste Management (WM) by rounding out our position with a slug of shares at $200.13. That timing proved to be fortuitous given the subsequent rebound in WM shares, which tallied more than 9% in November. We attribute that move to the market responding to WM’s ability to integrate waste acquisitions and deliver continued margin improvement at both the legacy waste collection business and the medical waste one. While WM has yet to fully realize synergy targets with the newer medical waste business, we continue to see the medical testing market growing at a steady pace, hence our position in Labcorp. To that, we can add further efficiency gains as it continues to leverage automation across its legacy waste business. As we’ve shared before, that is a combination that will keep us patient with WM shares. Helping us maintain that patience, management sees the company’s 2026 free cash flow near $3.8 billion, up around 30% year over year. After having pursued an accelerated investment in trucks, including automated ones, over the last three years, that investment in 2026 should return to more normalized levels. On the acquisition front, as of now, management sees a slower pace of acquisitions between $100 million-$200 million compared to $450 million-$500 million this year. Reading between the lines, we suspect that means we are likely to see another dividend increase and potentially something on the share-repurchase front.
November Price Change: 9.1%; Yield: 1.51%
INVESTMENT THESIS: Waste Management’s core business is the inelastic waste removal business for residential, enterprise, and other customers. The company has built its footprint through a series of acquisitions and excelled at wringing costs out of them, driving free cash flow, dividends, and funding incremental acquisition activity. While the residential business is sticky, the commercial business should continue to benefit from non-residential construction activity. Margins should continue to inch higher due to disciplined pricing and increasing use of automation. We are in the early days of WM Healthcare Solutions, but we see the business growing as management integrates and cross-sells against its core business and flexes the ability to integrate nip-and-tuck acquisitions as it has at the core waste business. Here, too, we see room to consolidate a fragmented industry, which makes this a natural fit for Waste Management.
Target Price: $255; Rating: One
Panic Point: $190
RISKS: Industry and economic risk, competition and competitive pressures, and acquisition risk.
TWOS
Alphabet GOOGL; $320.18; 677 shares; 3.94%; Sector: Communication Services
UPDATE: The Portfolio’s second strongest performer for November was its position in Alphabet (GOOGL) , which climbed almost 14% for the month. Paired with their impressive move in October, GOOGL shares finished up more than 31% for the first two months of the current quarter. That November move was propelled by a number of announcements that started with Apple tapping Google and its Gemini models to power its much-anticipated AI-enabled Siri, which is expected to launch in spring 2026. We see that as a big win and validation for Google’s AI efforts. In mid-November, reports revealed Berkshire Hathaway acquired 17.9 million GOOGL shares during Q3 2025, and we used the subsequent and short-lived pop in the shares to harvest some big gains. This means the GOOGL additions we made earlier this year, between $133-$167, by taking advantage of the market skepticism over potential disruption and Google’s own AI efforts, were the right move. It's easy to see with the benefit of hindsight, but it also shows our line of reasoning not to rule Google out on the AI front, given its presence in Search, shopping, and YouTube was on the right path. Three other subsequent and very positive November developments, including positive reviews and industry benchmark results for its latest Gemini 3 model, a multi-year, multi-million-dollar cloud deal with the NATO Communication and Information Agency to boost the organization's digital modernization, and reports Meta would spend “billions” on Google’s AI and data center chips starting in 2027, pushed the Portfolio’s GOOGL position past the 4.5% mark. That led us to bow to our Portfolio discipline and lock in another slice of gains following the more than 40% move in the shares in just a matter of weeks. As we made that move, we bumped our GOOGL price target to $350 from $320 and downgraded the shares to a Two from One. With the shares exiting November in an overbought condition based on their 73.51 RSI figure, we would not commit fresh capital at current levels. However, as the company’s AI and Google cloud investments wind down, we should see better margins and EPS generation ahead, especially as Google ups its YouTube monetization efforts.
November Price Change: 13.9%; Yield: 0.26%
INVESTMENT THESIS: We believe that while search and digital ad dominance are what will carry the shares in the near-to mid-term, longer-term, it is the company's artificial intelligence "moat" that will provide for new avenues of growth. Exiting the March 2025 quarter, Alphabet reported over 270 million paid subscriptions across YouTube and Google One. YouTube Music and Premium alone reached 125 million subscribers globally. AI is what has made the company's search, video, and targeted ad capabilities best-in-class and is the driving force behind the company's success in voice (Google Home) and autonomous driving (Waymo). Furthermore, we believe it is this AI expertise that will also make the company more prevalent in other industries, including healthcare via its subsidiary Verily, as AI and machine learning continue to disrupt operations across industries. Exiting the March 2025 quarter, across all its products, Alphabet had 0.5 billion users using its Gemini models. Adding to our positive view of the company's future opportunities, we believe that Alphabet's free cash flow generation and solid balance sheet set it apart and are what will allow the company to continue taking chances on far-out, ground-breaking, and potentially world-changing projects, as well as fund capital returns to shareholders. We will continue to monitor advertising spend as well as the competitive landscape for the company’s core Search and Advertising business.
Target Price: Reiterate $350; Rating: Two
Panic Point: $225
RISKS: Regulatory risk (data privacy), competition, and macroeconomic slowdown impacting consumers and therefore ad buyer activity.
American Express AXP; $365.27; 640 shares; 4.25%; Sector: Financial Services
UPDATE: Following a strong start to the current quarter, shares of American Express (AXP) continued to chug higher, leaving them up more than 20% year-to-date. Following the company’s September-quarter results that were ahead of market expectations, we shared the two things we would be watching that could lead us to revise that target even higher: trends in consumer spending; and comments from management about the refresh rates for its Platinum card. Following CFO Christophe Y. Le Caillec's presentation at the KBW Fintech Payments Conference, we boosted our AXP price target to $385 from $370. The motivation for that move was Le Caillec’s upbeat comments about consumer spending in October, but more central to our AXP investment theme, the Platinum Card refresh is going very well. Le Caillec also reaffirmed Amex’s 2025 EPS guidance of $15.20-$15.50 with revenue rising 9%-10% for this year. That guidance also bakes in a full quarter of expenses tied to the Platinum Card refresh compared to just two weeks in the September quarter. We’ll continue to monitor consumer spending metrics and the company’s Platinum card refresh, but keep in mind the one-two punch of expanding its membership and driving its average fee per card higher. Remember, Amex’s net card fee revenue drives nearly 70% of its pre-tax income.
November Price Change: 1.3%; Yield: 0.87%
INVESTMENT THESIS: American Express is a globally integrated, membership-driven payments company, providing customers with access to products, insights, and experiences that enrich lives and build business success. The company has four reportable operating segments: U.S. Consumer Services (USCS), Commercial Services (CS), International Card Services (ICS), and Global Merchant and Network Services (GMNS). American Express targets the premium consumer space by continuing to deliver membership benefits that span our customers’ everyday spending, borrowing, travel, and lifestyle needs, expanding its roster of business partners around the globe, and developing a range of experiences that attract high-spending customers. In 2024, the company’s net card fee revenue accounted for 65% of its pre-tax income, which we see providing a differentiated business model that should continue to grow as Amex wins new card members and drives its average fee per card higher.
Target Price: Reiterate $385; Rating: Two
Panic Point: $295
RISKS: Slowdown in consumer spending, competition, membership growth, merchant acceptance, and lack of new product innovation.
Apple AAPL; $278.85; 825 shares; 4.18%; Sector: Technology
UPDATE: Apple (AAPL) shares continued to chug higher in November, building on their October gains, leaving almost 10% upside to our recently boosted revised AAPL target of $305. The current quarter will benefit from a full quarter’s worth of new iPhone models, complete with higher price points, and as we think about 2026, there are a few things on the horizon that keep us bullish. While that includes a full year of incrementally higher-priced iPhone models and Services, during the September earnings call, Apple CEO Tim Cook confirmed the more personal, AI-backed Siri is on track to launch next year. Helping support that prospect, reports emerged this month indicating Apple is working with Google to use its Gemini AI model to power its next-gen Siri. Google is customizing its AI model for Siri, and the integration will happen through Apple's private cloud infrastructure to maintain privacy. A more robust, AI-enabled Siri has the potential to accelerate the current iPhone upgrade cycle. Next year is also expected to bring the much-discussed iPhone Fold to market. We could also see Apple bring other AI enhancements to Apple Intelligence as it ramps up its investment in the technology. As we move into December and the round of investor conferences ahead, when it comes to AAPL shares, we’ll be following comments by key suppliers about demand trends for the current quarter and initial ones for the start of 2026. Alongside those items, we should soon be getting November revenue reports from Taiwan Semi and Foxconn. Based on those data points, we’ll revisit our AAPL price target and rating as needed.
November Price Change: 3.1%; Yield: 0.37%
INVESTMENT THESIS: While we acknowledge that near-to-midterm performance remains heavily influenced by iPhone sales, the dynamic is shifting as investors finally place greater emphasis on Services growth. We are bullish on the 5G upgrade cycle and believe longer-term upside will continue to come as Services revenue grows its share of overall sales. Services provide for a recurring revenue stream at higher margins, a factor that serves to reduce earnings volatility while allowing for a higher percentage of sales to fall to the bottom line; as a result, we believe that Services growth and the installed base are much more important than how many devices the company can sell in each 90-day period. In addition to improved profitability, we also believe the transparent nature of this revenue stream will demand an expanded price-to-earnings multiple as segment sales grow. Furthermore, we believe that Apple's desire to push deeper into the healthcare arena will help make its devices invaluable as more life-changing features are added and the company works to democratize health records.
Target Price: Reiterate $305; Rating: Two
Panic Point: $222
RISKS: Slowdown in consumer spending, competition, lack of new product innovation, elongated replacement cycles, and failure to execute on Services growth initiatives.
Bank of America Corp. BAC; $53.65; 4,410 shares; 4.30%; Sector: Financial Services
UPDATE: Shares of Bank of America (BAC) edged higher during November, adding to their double-digit gains over the last several months. With only December left, BAC shares are up more than 20% so far this year, a figure that makes them a nice outperformer relative to the S&P 500. Early in November, BofA held an investor Day at which Chairman and CEO Brian Moynihan shared expectations for earnings to grow at a brisk pace with returns to follow. Given gains in BAC shares so far this year and approaching the $59 market consensus price target, we could see BAC shares become a bit of a “show me” story when it comes to those comments from Moynihan. The road map for those EPS gains includes continued share gains across its business lines as well as a focus on expense control. Success should show greater operational leverage, dropping to BofA’s bottom line, which would give us a reason to revisit our $60 target. Helping support the potential for market share gains is the expected rebound in the IPO market now that the government shutdown is over, as well as continued strength in the M&A market. Should we see a more dovish Fed emerge in the coming months, further declines in the Fed funds rate should bolster lending activity as well as lower M&A and construction project hurdle rates. The continued march higher in BAC shares has pushed the Portfolio’s position size well past 4% and should the shares continue to chug higher, some prudent Portfolio management may be called for.
November Price Change: 0.4%; Yield: 2.09%
INVESTMENT THESIS: Bank of America is one of the world's leading financial institutions, serving individual consumers, small- and middle-market businesses, and large corporations with a full range of banking, investing, asset management, and other financial and risk management products and services. The company provides unmatched convenience in the United States, serving approximately 67 million consumers and small business clients with approximately 3,900 retail financial centers, approximately 16,000 ATMs, and award-winning digital banking with approximately 56 million verified digital users. Bank of America is a global leader in wealth management, corporate and investment banking, and trading across a broad range of asset classes, serving corporations, governments, institutions, and individuals around the world. Bank of America offers industry-leading support to approximately 3 million small business households through a suite of innovative, easy-to-use online products and services. The company serves clients through operations across the United States, its territories, and approximately 35 countries. From a reporting perspective, the company's business breaks down as follows: Net Interest Income breakdown: Consumer Banking 57%, Global Banking 23%, Global Wealth & Investment Management 14%, and Global Markets 6%; Income Before Tax breakdown: Consumer Banking 42%, Global Banking 27%, Global Wealth & Investment Management 16%, and Global Markets 15%. Bank of America pays a quarterly dividend of $0.26 per share, up from $0.18 a few years ago.
Target Price: $60; Rating: Two
Panic Point: $44
RISKS: Financial markets, fiscal, monetary, and regulatory policies, economic conditions, and credit ratings.
Dutch Bros BROS; $58.61; 3,678 shares; 3.92%; Sector: Consumer Cyclical
UPDATE: Shares of Dutch Bros (BROS) continued to rebound in November, rising another 5%, pushing the quarter-to-date and year-to-date gain to more than 11%. During the current earnings season, transaction volume data from American Express and Visa confirm that consumers continue to spend, a positive for Dutch Bros' expanding footprint. And even though coffee is around 10% of Dutch Bros' cost of goods sold, a figure confirmed during our podcast conversation with Black Rock Coffee CEO Mark Davis, in mid-November, the Trump administration removed tariffs on Brazilian coffee, which should help ease price pressures. During November, Dutch Bros delivered quarterly results that topped market expectations with systemwide same-store sales that rose 5.7% year over year. Dutch’s footprint expansion was a headwind for margins in the quarter as it opened 38 shops, bringing its total to 1,081. As part of that expansion, Dutch also entered five new states during the quarter, which also contributed to that headwind. That was a brisker pace of store openings compared to 31 in the June quarter and 30 in the March quarter. Based on the company’s shop count target for this year, we expected greater shop openings in H2 2025, and that is what we’re getting. With the opening pace stepping up in 2026 and management reiterating its 2029 shop count by 2029, this leads us to think the margin pressure will be more than a one-quarter speed bump. With that in mind, we reset our margin expansion expectations and subsequently reduced our BROS target to $75 from $85. Because the expansion story remains more than intact, we will continue to own BROS shares to capture the opportunity as the growing footprint matures, margins rebound, and EPS growth accelerates. Should we see a more interest rate-friendly environment emerge in 2026, that could be one reason for us to revisit our margin assumption and price target. Given the upside to our current price target, we are reviewing our current Two rating on BROS shares.
November Price Change: 5.5%; Yield: 0.0%
INVESTMENT THESIS: Dutch Bros is an operator and franchisor of drive-thru shops that focus on serving high-quality, hand-crafted beverages with unparalleled speed and superior service. Coffee-based beverages make up about 50% of the menu mix, and about 25% of the menu mix is based on the company’s proprietary Blue Rebel energy drink, which is highly customizable with flavors and modifiers and can be served blended or over ice. The energy platform helps unlock the afternoon day part and broadens the company’s appeal. The remaining 25% of the menu mix is a wide variety of teas, lemonades, sodas, and smoothies. The company’s west-to-east expansion is a time-tested strategy that should drive revenue and EPS growth over the next several years. Leveraging that footprint expansion and low-single-digit comp sales growth, management reiterated its long-term guidance of around 20% annual revenue growth. Helping support that guidance, the company confirmed it will introduce an expanded food menu in 2026. Dutch Bros is slated to enter the consumer-packaged goods (CPG) space in a deal with Trilliant Food & Nutrition.
Target Price: Reiterate $75; Rating: Two
Panic Point: $42
RISKS: Commodity risks, labor costs, interest rate risk, and inflation.
First Trust Nasdaq Cybersecurity ETF CIBR; $73.65; 2,545 shares; 3.41%; Sector: Cybersecurity
UPDATE: After climbing higher over the last several months, shares of the First Trust Nasdaq Cybersecurity (CIBR) ETF gave back some of their gains in November. That move lower coincided with the larger decline in tech stocks, and on November 10, we used that pullback to pick up additional CIBR shares for the Portfolio at $76.45. Entering this year, research firm Gartner expected cybersecurity spending would rise $212 billion, but during August the firm increased that to $213 billion. It also forecasts cybersecurity spending accelerating in 2026 as it sees a concerted enterprise effort to shore up cloud security capabilities, particularly in relation to AI workloads. By 2028, Gartner sees that spending approaching $300 billion, and it’s that multiyear outlook that keeps us owners of CIBR shares. We continue to favor the diversified exposure this ETF brings to the Pro Portfolio. Even after our November move, we have some room to expand our exposure to CIBR. For now, our $63 panic point remains, but as CIBR shares move higher, we’ll lift that level in a commensurate manner. Catalysts we will be watching include subsequent M&A activity in the space as well as upcoming investor conference comments from the likes of CrowdStrike (CRWD), Palo Alto Networks (PANW), Infosys (INFH), Cloudflare (NET), and CyberArk (CYBR).
November Price Change: -4.7%; Yield: 0.02%
INVESTMENT THESIS: The First Trust Nasdaq Cybersecurity ETF seeks investment results that correspond generally to the price and yield (before the fund's fees and expenses) of an equity index called the Nasdaq CTA Cybersecurity Index. The Nasdaq CTA Cybersecurity Index is designed to track the performance of companies engaged in the cybersecurity segment of the technology and industrial sectors. It includes companies primarily involved in the building, implementation, and management of security protocols applied to private and public networks, computers, and mobile devices to protect the integrity of data and network operations. To be included in the index, a security must be listed on an index-eligible global stock exchange and classified as a cybersecurity company as determined by the Consumer Technology Association. Each security must have a worldwide market capitalization of $250 million, have a minimum three-month average daily dollar trading volume of $1 million, and have a minimum free float of 20%.
Target Price: Reiterate $85; Rating: Two
Panic Point: $63
RISKS: Cybersecurity spending, technology and product development, the timing of the product sales cycle, new products, and services in response to rapid technological changes and market developments, as well as evolving security threats.
Labcorp Holdings Inc. LH; $268.78; 790 shares; 3.86%; Sector: Healthcare
UPDATE: After struggling in October, we picked up some Labcorp (LH) shares on October 30 at $255.15. In November, LH shares reclaimed some of that lost ground, rising around 6%. With one month to go in 2025, LH shares are up more than 17%, which makes them a nice outperformer relative to the S&P 500. While it may not be a sexy business or one that generates much in the way of headlines, the company remains a well-positioned play for our Aging of the Population investing theme. We also like the continued execution of the company’s two-pronged growth strategy, which is a mix of organic growth and growth by acquisition. We see further gains ahead as Labcorp continues to expand its test and diagnostics offerings and do the same with its hospital lab footprint. As the company explained during its September-quarter earnings call, some of the expected acquisitions for Q3 2025 are closing later than expected, and a few have slipped into 2026. In our earnings note, we explained how incorrectly focusing on that overshadows the continued organic growth of the business, which is benefiting from volume gains, but also more favorable pricing tied to the mix of tests being performed. On the same earnings call, Labcorp management detailed cost-reduction initiatives and how it is adopting AI, the combination of which should help drive margins higher over time. While the Portfolio has a relatively full LH position, the shares are on the cusp of breaking through the 50-day moving average, generally a positive sign when it happens. However, we will want to see the shares retest that support level, a move that should help them continue higher.
November Price Change: 5.8%; Yield: 1.07%
INVESTMENT THESIS: Labcorp is a global leader in innovative and comprehensive laboratory services that provide vital information to help doctors, hospitals, pharmaceutical companies, researchers, and patients make clear and confident decisions. By leveraging its diagnostics and drug development capabilities, the company provides insights and accelerates innovations to improve health and improve lives. The company is organized under two segments, consisting of Diagnostics Laboratories (Dx), which includes routine testing and specialty/esoteric testing, and Biopharma Laboratory Services (BLS), consisting of Early Development Research Laboratories and Central Laboratory Services. Our attraction to LH shares stems from the combination of the aging population driving diagnostic testing growth and the increasing array of diagnostic testing as well. That combination is expected to drive the healthcare testing services market to $12.6 billion by 2029, from $7.4 billion in 2024, according to Markets and Markets. To augment its position in oncology, women's health, autoimmune diseases, and neurology, the company has been expanding through acquisitions and partnerships with health systems and regional and local labs.
Target Price: Reiterate $300; Rating: Two
Panic Point: $228
RISKS: Macroeconomic factors, changes in healthcare reimbursement models and products, government regulations, product discontinuations or recalls.
Microsoft Corp. MSFT; $492.01; 395 shares; 3.53%; Sector: Technology
UPDATE: After trimming back our position in (MSFT) shares in late October at $538.97, Microsoft shares traded off, leading us to buy back some shares just under $500 on November 10. While we were a tad early, making our move before the shares bottomed out near $470 later in the month, MSFT shares rebounded along with the market to finish November down 5.0%. As we saw earlier this year, MSFT shares are likely to be rangebound as the company continues to add additional AI and cloud capacity, a move that will curb margin improvement in the near-term. As the company digests that coming capacity, we should see a combination of faster revenue growth and margin rebound unfold. Exiting September, Microsoft’s commercial remaining performance obligations (RPOs) hit $400 billion, up 50% year over year, and we should keep in mind that this does not include the recent $250 billion incremental win with OpenAI. As part of a mid-November announced partnership with Anthropic, Anthropic also said it has committed to spend $30 billion on Microsoft's Azure compute capacity and to contract additional compute capacity up to one gigawatt. In exchange, Microsoft will invest $5 billion in Anthropic. As enterprise and government AI adoption rises, Microsoft and its Azure business are positioned to benefit, which is one reason why we continue to be MSFT shareholders. Another is Microsoft’s ownership stake in OpenAI Group PBC, the for-profit OpenAI entity, and news that OpenAI is preparing for an eventual IPO, possibly in 2026. While that may not benefit Microsoft from an operating perspective, the eventual IPO will be a positive for the company’s balance sheet. Given the upside to our price target, we are reviewing our current Two rating, and what we learn from management’s upcoming investor presentations could trigger such a move. Those upcoming management presentations include the UBS Global Technology Conference on December 2 and the Barclays Global Technology Conference on December 11.
November Price Change: -5.0%; Yield: 0.74%
INVESTMENT THESIS: We believe the cloud to be a secular growth trend and that the upside to the shares will result from Microsoft's hybrid cloud leadership as the company grabs market share in this expanding industry. While companies may look to build out multi-cloud environments, Microsoft's Azure offering will be a prime choice thanks to its decision to provide the same "stack" used in the public cloud to companies for their on-premises data centers. Additionally, we would note that hybrid environments are currently the preference for most companies because they allow them to maintain critical data in-house while taking advantage of the agility and scalability provided by public clouds. Outside of the cloud opportunity, we maintain a positive view on the company's growing gaming business, which we believe is becoming an increasingly prominent factor in the Microsoft growth story as gaming becomes more mainstream, management works to convert its gaming revenue from a one-time license purchase to a recurring subscription model, and as technologies like augmented/virtual reality evolve. Finally, as it relates to LinkedIn and other subscription-based services such as O365 and various Dynamics products, we continue to value them highly for their recurring revenue streams, which, we remind members, provide for greater transparency of future earnings.
Target Price: $600; Rating: Two
Panic Point: $450
RISKS: Slowdown in IT spending, competition, and cannibalization of on-premises business by the cloud.
Morgan Stanley MS; $169.66; 1,400 shares; 4.32%; Sector: Financial Services
UPDATE: The positive uptrend in Morgan Stanley (MS) shares continued in November, leaving them up almost 35% so far this year with one month left to go in 2025. With the government shutdown now behind us and the SEC getting back to work, we should start to see the IPO calendar warm back up. While the December IPO market looks to start on a quiet note, there are several potential transactions that could jumpstart that activity in the coming weeks and into 2026. Medical supplies giant Medline (MDLN) remains the potential headline event and could raise an estimated $5 billion in an offering that would mark the largest US IPO since 2021. Several other sizable deals are also eligible to launch in December, including Pan-Asian travel platform Klook (KLK), crypto investment platform Grayscale (GRAY), and satellite manufacturer York Space Systems (YSS). Meanwhile, M&A activity is projected to keep rising into 2026, especially if we see a more dovish Fed emerge in the coming quarters. At the same time, the volatile market action in the stock market should be a positive tailwind for Morgan’s Institutional Securities business. As we determine the degree to which the IPO and M&A markets are reaccelerating, we’ll revisit our MS target. Of late, MS shares have been a sleeper success for the Portfolio, but near-term, should MS shares continue to push higher, should their position size move past 4.5% some prudent portfolio action may be called for.
November Price Change: 3.5%; Yield: 2.36%
INVESTMENT THESIS: Morgan Stanley reports in three business segments: Institutional Securities (42% of trailing 12-month revenue, 38% of trailing 12-month Income Before Tax), Wealth Management (48%, 55%), and Investment Management (10%, 6%). While the IPO window has yet to reopen, the potential IPO class for 2025 continues to build with recent additions including Klarna and StubHub. That would be a boon to private equity firms and others that have been nursing IPO candidates during the dark period and a positive for Morgan Stanley's investment banking business. Expected deregulation under the Trump administration is a potential catalyst for Morgan's M&A business. Meanwhile, folks continuing to be behind in retirement savings bodes well for Morgan Stanley's wealth management business in the coming quarters, while continued market volatility bodes well for its equity trading business.
Target Price: $170; Rating: Two
Panic Point: $135
RISKS: Market and interest rate risk, credit risk, country risk, and operational risk, including cybersecurity.
Qualcomm Inc. QCOM; $168.09; 1,110 shares; 3.39%; Sector: Technology
UPDATE: Shares of Qualcomm (QCOM) were a drag on the Portfolio during November as they gave back the bulk of their October gains. Following the company’s beat-and-raise September-quarter earnings report, one that also showcased progress on its diversification strategy, QCOM shares moved higher. However, before too long, the stock was pulled lower along with other chip stocks in the second part of November. For the current quarter, Qualcomm targets EPS of $3.30 to $3.50 versus the prior $3.26 market forecast. Revenue for the quarter is expected to reach $11.8 billion to $12.6 billion, versus the prior $11.59 billion consensus and the $11.7 billion posted in the year-ago quarter. Baked into that revenue guidance, aggregate chip revenue is targeted to come in at $10.3 billion to $10.9 billion, with the balance coming from its higher margin licensing business. By end market, handset revenue is expected to see low-teens percentage growth sequentially, primarily driven by new flagship Android handset launches, and automotive revenue is expected to be flat to slightly up on a sequential basis. The IoT business, which tends to be influenced by the holiday shopping season, is likely to see a modest sequential decline, but to us, the design win matriculation in 2026 is far more important. To that end, both Dell and HP see the PC upgrade cycle continuing in 2026, with AI PCs continuing to capture a greater part of the overall PC shipment mix. Qualcomm management will be presenting at the UBS Global Technology and AI Conference on December 2, which could be a potential catalyst for the shares and any potential action we might take. As we move further into December, we will continue to track smartphone and PC shipment conversation as well as upcoming November revenue reports from Taiwan Semi and Foxconn. Long-term, as Qualcomm makes further strides in its revenue diversification strategy, we should see Wall Street revisit how it values the shares, and that is the opportunity we aim to capture as shareholders.
November Price Change: -7.1%; Yield: 2.12%
INVESTMENT THESIS: Qualcomm focuses on foundational technologies for the wireless industry, including 3G (third generation), 4G (fourth generation), and 5G (fifth generation) wireless technologies and processor technologies, including high-performance, low-power computing and on-device artificial intelligence technologies. As a connected processor company, its technology roadmap aims to enable the connected intelligent edge (the next generation of smart devices) across industries and applications beyond handsets, including automotive and the Internet of Things (IoT). Qualcomm has three reportable segments: QCT (Qualcomm CDMA Technologies) semiconductor business, which develops and supplies integrated circuits and system software based on 3G/4G/5G and other technologies for use in mobile devices; automotive systems for connectivity, digital cockpit, and ADAS/AD; and IoT, including consumer electronic devices, industrial devices, and edge networking products. QCT accounts for 80% to 85% of revenue. The QTL (Qualcomm Technology Licensing) licensing business grants licenses or otherwise provides rights to use portions of the company's intellectual property portfolio, which includes certain patent rights essential to and/or useful in the manufacture and sale of certain wireless products. QTL accounts for about 15% of Qualcomm's revenue but contributes a greater portion of the company's operating income. Our focus on QCOM shares is revenue diversification as part of management's intended strategy to lessen its reliance on the smartphone market by tapping into the AI PC, IoT, and automotive chip markets. We see this unfolding over the next few years, which should lead Wall Street to revisit how it values the shares. It is that opportunity we aim to capture by owning the shares over the longer term.
Target Price: $205; Rating: Two
Panic Point: $135
RISKS: Customer risk, technology advancement, competition risk, third-party supplier, and manufacturing partner risk.
TJX Companies TJX; $151.92; 947 shares; 2.62%; Sector: Financial Services
UPDATE: Following their modest decline in October, shares of TJX Companies (TJX) resumed their upward climb in November, propelled more the growing number of signs that cash-strapped consumers were embracing deals, sales, and off-price retailers. On November 10, we picked up more shares of TJX for the Portfolio at $144.35. That move paid off when TJX subsequently reported its October-quarter results later in November, and delivered a 5% comp sales figure, a step up from the 4% posted in the prior quarter, and well ahead of management’s 2%-3% guidance for the quarter. That 5% figure was also well above comp sales numbers reported by others, including Walmart, Target, Lowe’s, and Chipotle. To that, we can add the nice level of margin improvement to 9.5% on the operating line, which was due to a combination of better product mix and lower freight costs. Both are expected to remain favorable tailwinds. We continue to see the TJX team as a well-seasoned group with a disciplined eye for merchandise. For now, we’ll keep our Two rating, but if we see TJX shares pull back near the $143 level, our $165 price target gives us enough upside to reconsider that rating. Let’s remember too, the company telegraphed it will continue to repurchase shares in the current quarter, which means any move back to that level could be short-lived. TJX repurchased $1.7 billion in stock, roughly 13.4 million shares, and now targets repurchasing ~$2.5 billion during fiscal 2026, which ends in January 2026.
November Price Change: 8.4%; Yield: 1.12%
INVESTMENT THESIS: The TJX Companies is the leading off-price apparel and home fashions retailer in the United States and worldwide. It has over 5,000 stores and six branded e-commerce sites that offer a rapidly changing assortment of quality, fashionable, brand-name, and designer merchandise at prices generally 20% to 60% below full-price retailers’ regular prices on comparable merchandise. The company operates in four segments: Marmaxx and HomeGoods, both in the U.S.; TJX Canada, and TJX International. TJX looks to capitalize on opportunities to acquire merchandise at substantial discounts that regularly arise from the production and flow of inventory in the apparel and home fashions marketplace. These opportunities include, among others, closeouts from brands, manufacturers, and other retailers; special production direct from brands and factories; order cancellations; and manufacturer overruns. We see that positioning TJX extremely well, as consumers feel the pinch of ongoing inflation pressures and their efforts to stretch the disposable spending dollars they do have, including tapping discounted shopping locations.
Target Price: $150; Rating: Two
Panic Point: $115
RISKS: Operational, strategic buying, and competitive risks, as well as consumer spending patterns.
United Rentals URI; $815.18; 235 shares; 3.48%; Sector: Industrials
UPDATE: The lack of government construction data during November weighed on the shares of United Rentals (URI) , leading them to move lower during the month and adding to their quarter-to-date sag. Given the expected build-out of data center capacity and corresponding power demands, we continue to see better days ahead for the company and the stock. United confirmed during its earnings, non-residential construction activity should benefit from not only data center construction but also from infrastructure, semiconductor, hospital, and power facilities, as well as airport construction. As those projects get underway and mature, we should see United’s margin profile return to higher levels as efforts to relocate equipment to work sites diminish. That suggests 2026 EPS expectations may need to be revised higher in the coming months. While United management stopped short of giving any formal 2026 guidance as part of its September quarter results, the team shared that it sees another year of good growth ahead. For that reason, the company has stepped up its capital spending program for this year so it will be positioned to address that demand. We continue to see construction activity improving as we move through 2026, as the monetary policy moves from restrictive to more neutral territory, leading to further improvement in interest rates. As we move into the seasonally slower time of year for United’s business, when it comes to revisiting our Two rating, we will pick our spots carefully.
November Price Change: -6.4%; Yield: 0.88%
INVESTMENT THESIS: United Rentals, the largest equipment rental company in the world, operates throughout the United States and Canada, and has a limited presence in Europe, Australia, and New Zealand. It serves industrial and other non-construction, commercial (or private non-residential) construction, and residential construction. Industrial and other non-construction rentals represented approximately 50% of rental revenue, primarily reflecting rentals to manufacturers, energy companies, chemical companies, paper mills, railroads, shipbuilders, utilities, retailers and infrastructure entities; commercial construction rentals represented approximately 46% of rental revenue, primarily reflecting rentals related to the construction and remodeling of facilities for office space, lodging, healthcare, entertainment and other commercial purposes; and residential rentals around 4% of revenue. We see the company benefiting on three fronts — the seasonal uptick in construction spending, the release of funds and projects associated with the five-year Biden administration infrastructure bill, data center construction and other re-shoring projects, and the company's nip-and-tuck acquisition strategy that should further enhance its geographic footprint.
Target Price: Reiterate $1,000; Rating: Two
Panic Point: $775
RISKS: Industry and economic risk, competition and competitive pressures, and acquisition risk.
Welltower Inc. WELL; $208.22; 330 shares; 1.25%; Sector: Real Estate
UPDATE: Shares of Welltower (WELL) were a strong performer for the Portfolio during November, rising 15% compared to the largely flat performance put in by the S&P 500. Despite that double-digit increase, November was a relatively quiet month on the news front, but we continue to favor the shares given that they sit at the intersection of the demographic shift associated with an aging population and the senior housing shortage pain point. Data from the senior housing analytics company NIC MAP find that by 2030, the senior living sector faces a potential shortfall of approximately 595,000 units. We see that driving favorable rent escalation figures, especially as capacity levels continue to rise, leading to further margin improvement and higher FFO per share figures. Given Welltower’s REIT structure, that should also lead to further dividend increases. As the Fed moves further down the Fed funds rate curve, we should see WELL share benefit from lower project hurdle rates and investors revisiting its dividend stream and corresponding yield. Our intent is to remain long-term holders of WELL shares, and we are interested in adding to the Pro Portfolio’s exposure, reflecting the total return potential we see over the coming years. However, because the shares are in a deeply overbought condition with their RSI level over 84, we are not inclined to commit fresh capital near-term. We will continue to evaluate entry points and share those with you.
November Price Change: 15.0%; Yield: 1.42%
INVESTMENT THESIS: Welltower, a real estate investment trust (REIT), owns interests in properties concentrated in major, high-growth markets in the United States, Canada, and the United Kingdom, consisting of seniors housing, post-acute communities, and outpatient medical properties. We see the company benefiting from the intersection of the demographic shift that is the aging population and the looming pain point that is the shortage of inventory for senior housing, which fell below 1% in Q2 2025, according to the National Investment Center for Seniors Housing & Care. Over the next five years, more than 4 million boomers will hit age 80, and that’s in addition to the roughly 4% of the U.S. population that is 80-plus years old in 2024. As this demographic shift unfolds, we should see a relatively steady growth rate in Welltower’s revenue, NOI, and FFO, which, in turn, given its REIT status, should drive its payable dividend stream higher. Because of the favorable demographic tailwind and lower interest rate path telegraphed by the Federal Reserve, which should reduce construction costs over time, as well as bring REIT stocks back into favor, we intend to be long-term holders of WELL shares. Our plan is to build the position size methodically, increasing the Portfolio’s dividend stream along the way.
Target Price: $205; Rating: Two
Panic Point: $141
RISKS: Operational risk, operator and tenant risk, competitive risks, and acquisition risk.
Not Rated
EPS Diplomats Model; 2.17%; Sector: N/M
UPDATE: On November 17, we enacted the EPS Diplomats model strategy as part of the Pro Portfolio, and during the second half of November, the model returned 9.6% compared to 1.7% for the S&P 500. Each position initially accounted for 0.25% of the Pro Portfolio’s assets, leading the basket to start off at 2.0% of the overall Pro Portfolio. On December 31, we will exit the model’s holdings, book expected gains, and reconstitute the model’s strategy based on updated consensus EPS figures for 2025 and 2026, effective January 2. At that time, the total basket will be reset to 2.0% of the Pro Portfolio’s assets. Some of the initial holdings in the basket will likely change, but there could be one or two that remain. In that case, we will reset the corresponding position size back to 0.25% of the Pro Portfolio so the new basket will begin the quarter at 2.0%. The only time we may adjust the model’s composition during the quarter is if a company is acquired. Otherwise, the model is set until the next reconstitution. As such, there are no price targets or ratings for each of the positions that make up the basket. That same selection process will be repeated quarterly, which means housekeeping for the model should be minimal. It also means you can expect that minimal activity to occur at quarter-end and the start of the new quarter. With that in mind, the next set of active dates for the model will be 12/31/25, 1/02/26, 3/31/26, 4/01/26, and so on.
November Price Change: 9.6%; Yield: 0.70%
INVESTMENT THESIS: EPS Diplomats is a model of large-cap companies that offer the fastest rate of EPS growth over a multi-year period. That basket is screened regardless of industry sector or sub-sector, which means the down-selected list of companies can span a wide array of sectors. The focus is on earnings growth because earnings growth is often seen as a signal of a company's competitive strength, operational efficiencies, and future growth potential. Shares of companies that provide historically consistent earnings growth faster than the stock market receive premium valuations compared to those awarded to the S&P 500. And as we’ve often discussed with you, multiple expansion paired with earnings growth tends to drive outperformance relative to the market, better known as alpha. The basket of eight stocks is reconstituted on a quarterly basis to reflect updated EPS expectations for the current year and the following one.
Target Price: N/M
Panic Point: N/M
RISKS: Macro and end market risk, individual company risk, and consensus EPS expectations.
