Monthly Roundup: The Great April Turnaround
The market and TheStreet Pro Portfolio made impressive strides during the month, with notable double-digit gains from multiple holdings.
You've reached your free article limit
You've read 0 of 1 free Pro articles.
When folks think of “in like a lion, out like a lamb” they often think of March weather, however, we could also use it to describe the stock market’s performance in April. You no doubt remember the volatile start to the month, one that saw the S&P 500 and Nasdaq Composite hit levels last seen in early 2024. That dragged the Pro Portfolio down despite the ongoing volume of confirmation points we shared as the market focused on the disruption from Trump tariffs on the economy and corporate earnings.
The combination of slowing economic data mixed with softening earnings expectations for some companies and falling poll numbers for President Trump led to a softening of some tariffs and the administration jawboning trade talk progress with a variety of countries save China. Some also started to see greater prospects for Fed rate cuts leaning into the Fed potentially throwing the economy a life preserver even though signs pointed to inflation perking back up. Those and other factors led the market to find its footing mid-month and start to rebound from oversold levels.
As the March-quarter earnings season unfolded, several concerns that plagued the market relating to key constituents for both the S&P 500 and Nasdaq Composite fell by the wayside as Amazon AMZN, Nvidia NVDA, Alphabet GOOGL, Microsoft MSFT, and Meta META reaffirmed AI and data center demand. Those reports helped the market finish April with the wind at its back, with the S&P 500 falling less than 1% while the Nasdaq Composite closed the month up just shy of 1%.
Reports point to a thawing in potential trade talks between the U.S. and China, which helped goose the market on Friday. We view these reports as constructive and while we may be hopeful about what comes next, we continue to think these talks will be measured in weeks not days, and that the ultimate details will be what matters most. Our two cents is that recent economic data, including the Q1 2025 GDP contraction, renewed inflation pressures seen in the April ISM Manufacturing PMI and what we are likely to see in the corresponding Services data next week, is helping spur the White House in trade talks with China as well as the other 17 key trading partners for the U.S. Gaming things out, as the initial dominos fall with the first few announced trade deals, we’ll have a better sense of headwinds for the economy, inflation and corporate earnings.
As the market responds with a sigh of relief or a dash of renewed hopium, we’ll enjoy it, but also recognize the potential for fits and starts with trade talks between the two countries. We also see some resistance ahead for both the S&P 500 and Nasdaq Composite with their respective 100-day and 200-day moving averages. Viewed from a different perspective, following the double-digit moves for both the S&P 500 and the Nasdaq Composite off their April lows, potentially sobering comments from Fed Chair Powell next week about the likely pace of rate cuts and the pivot to retail earnings that will showcase the impact of tariffs could lead the market to give back some of its quick gains. Following comments about sharp drops in cargo and airfreight volumes and other companies contemplating price target increases to fend off tariff pressures, we suspect Powell could have more to say than usual next week.
So, while we’ve enjoyed the market action in the last two weeks and the wonderful impact it’s had on the Pro Portfolio, we are mindful that even as we play the long game, there could be a few more near-term disruptions the market may have to contend with. Those could bring a few more opportunities to put capital to work at better prices, but we’ll also be on the hunt for companies that stand to benefit from progress on trade talks and the potential rollback on Trump tariffs.
Our plan, which helped us navigate the Pro Portfolio over the last few months, remains the same — follow the data, heed the signals we collect, connect the dots as more information is available, be opportunistic when it makes sense, and reposition the Pro Portfolio as needed.
Catching Up on the Pro Portfolio This Week
Blending the S&P 500’s 0.8% move lower in April with the near 1% gain registered by the Nasdaq Composite, we find multiple things to be pleased about when it comes to the Pro Portfolio’s performance for the fourth month of 2025. Demonstrative double-digit gains were had with Palantir PLTR, ServiceNow NOW, Axon Enterprise AXON, and Vulcan Materials VMC. We also saw outsized moves in the First Trust Nasdaq Cybersecurity ETF CIBR, Costco COST, Eaton ETN, Alphabet GOOGL, Labcorp LH, and a handful of others.
Those gains were tempered by April declines in Apple AAPL, Amazon AMZN, Bank of America BAC, Meta META, and the ProShares Short QQQ PSQ shares. However, as we kick-started May, the continued market rebound rippled through the Pro Portfolio, especially following the quarterly results from Meta and Microsoft MSFT, driving the majority of our holdings higher.
Given the swirling of uncertainty that colored April, we made only two trades. The first was to pick up additional shares of Marvell MRVL at $54.77 just as the market was putting in its early April bottom. A few days later, we made a multi-pronged move by scooping up more MRVL shares and also shares of Apple, Elastic ESTC, Meta, and Universal Display OLED. Checking the trade levels on the Portfolio’s Holdings page against where those stocks finished this week confirms those were smart moves.
Soon we will move into the latter stages of the current earnings season and that means a shift to retail-facing companies, ones that are likely to show the greatest impact of tariffs. Next week also brings the Fed’s next policy meeting, and as we discuss below in The Week Ahead, recent inflation data does not augur well for rate cuts. On Thursday, we discussed the multiple layers of technical resistance the S&P 500 faces between its 50-, 100-, and 200-day moving averages. The same goes for the Nasdaq Composite. We’ll also continue to watch MACD levels for both indexes as well as their relative strength index (RSI) levels and those for Pro Portfolio holdings.
That combination sees us sticking with our inverse ETF positions for a bit longer. However, as new information, including trade deal announcements, arrive, we’l revisit their role in the Pro Portfolio.
Before we move on, we want to share that we are reviewing all of the panic points associated with the Pro Portfolio holdings. For that reason, when you peruse the holding write-ups below, you will see “Under revision” next to the corresponding panic point. We expect to unveil these updated figures in the coming days, but we figure a quick heads-up would head off any potential questions. As we make those updates, we’ll likely do the same for relative strength index levels for all of the holdings as well as key market indexes.
This Week's Portfolio Videos
We cover a lot of ground during the week in our Daily Rundowns. If you happened to miss one or more of them, here are some helpful links:
Monday, April 28: Nvidia Will Get Major Updates from These 4 Holdings
Wednesday, April 30: TheStreet Stocks & Markets Podcast #3: Manage Risk Like a Pro With Bob Byrne
Thursday, May 1: Boosts From These Holdings Can't Buoy the Market Alone
Key Global Economic Readings
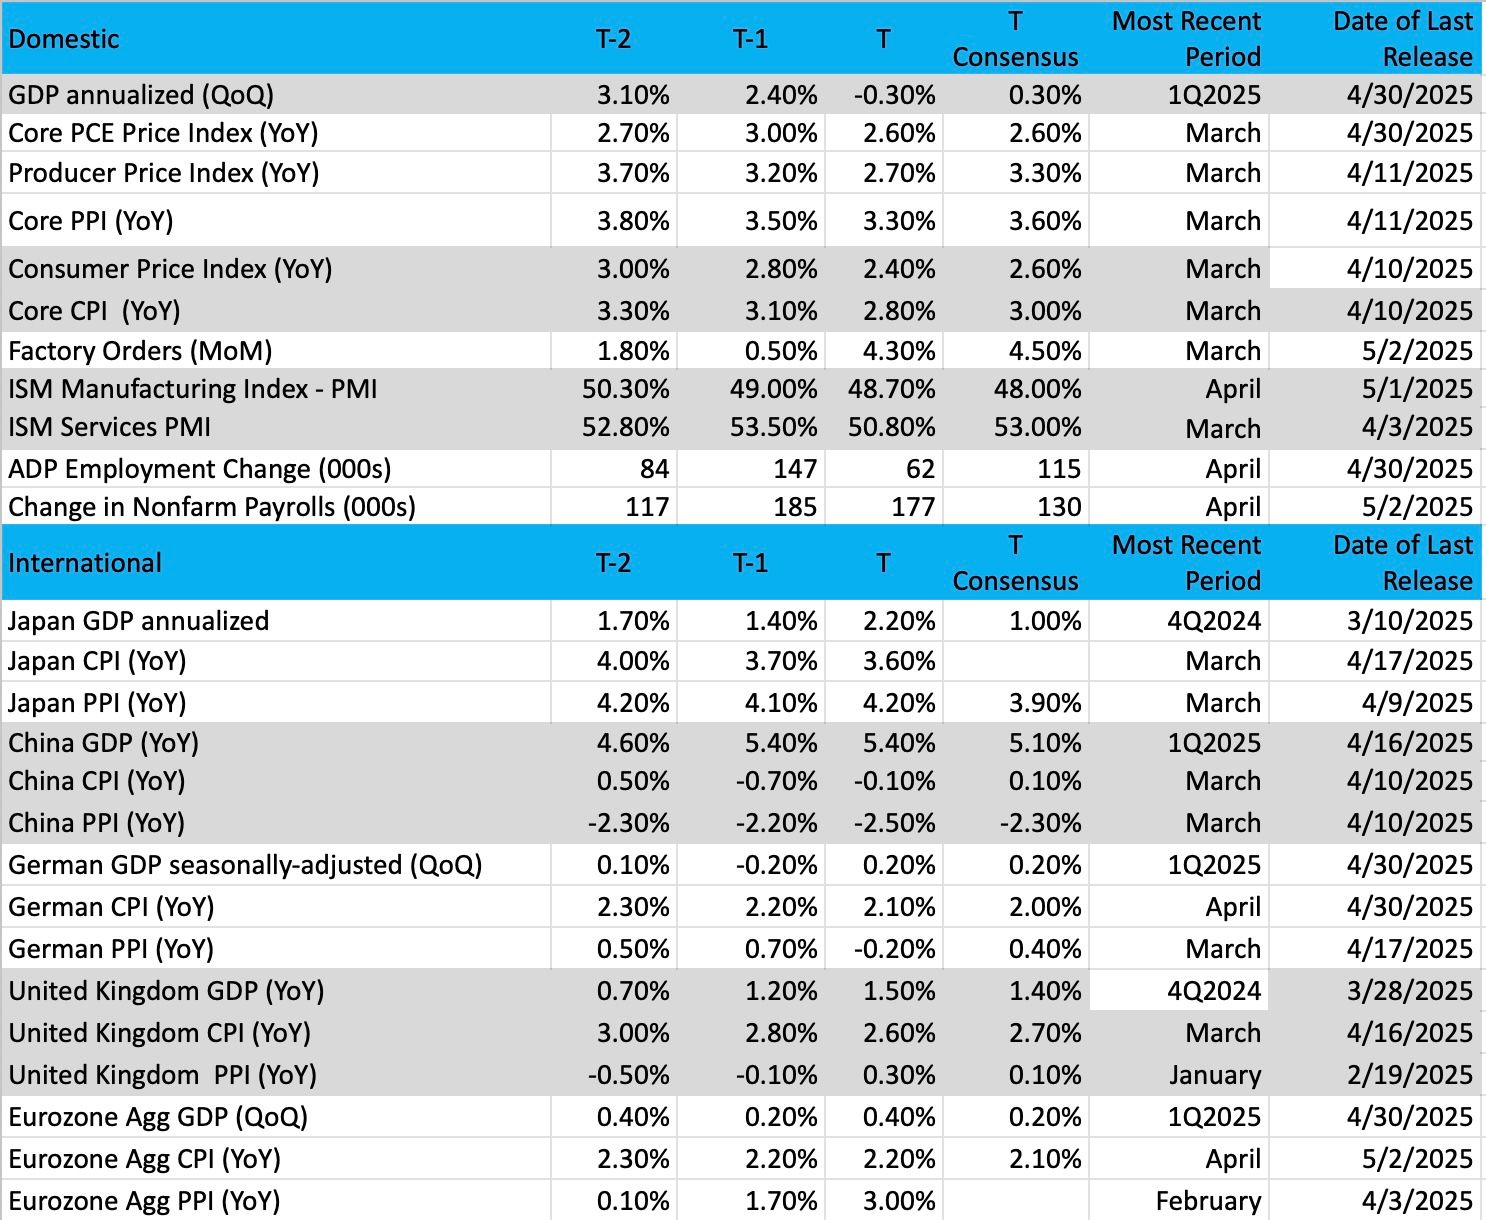
(Note: T is the most recent period, T-1 is the prior period's reading and T-2 is two periods back, the intent being to illustrate any trends)
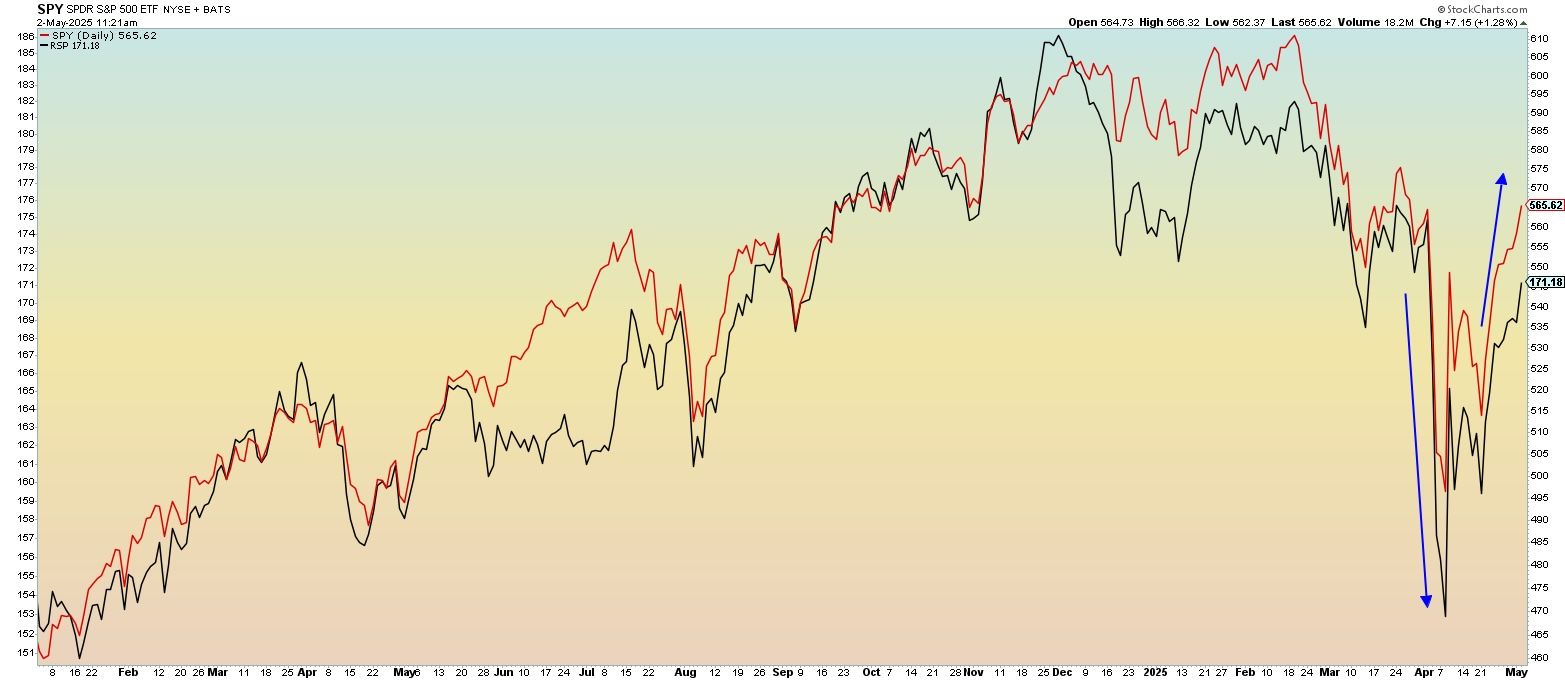
Chart of the Week: S&P 500 – Market Cap Weighted vs. the Equal Weighted
As the stock market has rallied sharply over the last several days one thing sticks out to us as we do our monthly review of the SPY ETF vs the equal-weighted S&P index, or the RSP. The chart shows a strong relationship between the two ETFs, something we have become accustomed to over long periods, but the investment/trade certainly favors the SPY.
Remember that ETF is cap-weighted towards the biggest companies in the world, so they have a much stronger influence over the SPY. In fact, the Magnificent Seven names are about one-third (32%) of the weighting in the SPY.
But it’s a different story with the RSP, which is an equal-weighted index that gives each member just "one vote" towards the index. With such enormous valuations at the top of the S&P 500 one might expect the weighted version to be more "valuable." That is indeed the case; the SPY is about 3.3 times more than the RSP, which means it can move with more force and volatility.
When the two ETFs are in sync it is telling there is broad participation across many sectors. Big investors are not just interested in big tech, rather they see opportunity and value in other groups like housing, financials/banks, retail, metals, discretionary, and staples.
The chart shows this nice correlation. With the recent drop, both ETFs fell sharply together while this recent rebound shows the same. That is a good sign of health for the markets, but no question both ETFs are coming up on heavy resistance, so we might look for a pullback soon. Seeing the strength in RSP (performing better in 2025 than SPY) means we are looking for longer and more sustained rallies, all things being equal.
Other charts we shared with you this week were:
Monday, April 28: S&P 500 - Here's the New Battleground for the Index
Monday, April 28: Eaton Corp. (ETN) - As This Holding's Earnings Approach, Resistance Looms Overhead
Tuesday, April 29: Meta Platforms (META) - Meta Could Bounce on Earnings But Will Volume Remain an Obstacle?
Wednesday, April 30: Microsoft (MSFT) - 'Wildcard' Microsoft Is in Need of Good News
Thursday, May 1: Apple (AAPL) - Is Apple About to Turn Over?
The Week Ahead
Following last week’s string of economic data points for April and the modest contraction found in Q1 2024 GDP, it’s safe to say that we and the rest of the market will be focusing on Monday’s twin looks at Services PMI data. Because that part of the economy accounts for ~90% of GDP, an up-and-down review of the data will be needed to get a full view of how the economy kicked off the current quarter. We’ll also be sizing up the analogous data for China, the eurozone, and other key parts of the global economy to get another take on tariffs and their impact.
Parsing this week’s initial Q1 2025 GDP report showed the GDP Price Index climbed to 3.7% from 2.3% in Q4 2024, a much hotter figure than the market consensus of 3.1%. Even the core PCE Price Index reading for Q1 2025 came in hotter than expected at 3.5% versus 2.6% in Q4 2024, and that was before the impact of tariffs. While some may want the Fed to cut rates given the initial Q1 2025 GDP of -0.3%, the odds of Fed Chair Powell delivering on that are, at least for now, low, given what those GDP Price Index figures revealed.
To that, we can add the inflation findings seen in ISM’s April Manufacturing PMI and the stronger-than-expected April Employment Report. Next up we have the April ISM Services data, which will be the last meaningful data point before the Fed delivers its next monetary policy decision this coming Wednesday afternoon. Like the April Manufacturing PMI data, it will reveal the impact of tariffs put in place during the month.
The Fed isn’t expected to deliver a rate cut next week, but with the market expecting multiple rate cuts between the Fed’s June and December policy meetings, we won’t be the only ones paying close attention to the Fed Chair’s remarks. Given the data, we expect another dose of sobering comments despite President Trump continuing to call for rate cuts.
Here's a closer look at the economic data coming at us next week:
U.S.
Monday, May 5
· S&P Global Final Services PMI – April (9:45 AM ET)
· ISM Services PMI – April (10:00 AM ET)
Tuesday, May 6
· Trade Balance – March (8:30 AM ET)
Wednesday, May 7
· MBA Mortgage Applications Index – Weekly (7:00 AM ET)
· EIA Crude Oil Inventories – Weekly (10:30 AM ET)
· FOMC Rate Decision (2 PM ET)
· Consumer Credit – March (3 PM ET)
Thursday, May 8
· Initial & Continuing Jobless Claims – Weekly (8:30 AM ET)
· Unit Labor & Productivity Costs – 1Q 2025 (8:30 AM ET)
· Wholesale Inventories – March (10:00 AM ET)
· EIA Natural Gas Inventories – Weekly (10:30 AM ET)
International
Tuesday, May 6
· China: Caixin Services PMI – April
· Eurozone: HCOB Services PMI – April
· UK: S&P Global Services PMI – April
· Eurozone: Producer Price Index - March
Wednesday, May 7
· Japan: Jibun Bank Services PMI – April
· Eurozone: Retail Sales - March
Thursday, May 8
· Germany: Industrial Production – March
· UK: Bank of England Interest Rate Decision
Friday, May 9
· China: Imports/Exports – April
· Japan: Leading Economic Index – March
· UK: Industrial Production - March
From the Pro Portfolio’s perspective, we have three holdings reporting next week – Palantir PLTR, Axon Enterprise AXON, and Dutch Bros BROS. All three have been solid performers for us so far this year, but as we dig into their reports and guidance, we’ll be mindful of their respective technical setups. For example, exiting April, PLTR shares moved into overbought territory. This likely means expectations for management’s guidance are running high, especially following the whopper of a move over the last few weeks. Axon shares have also moved notably higher in recent weeks, and while the shares are not overbought, that move likely raises the stakes for its guidance.
Outside of those three holdings, we have another week of connecting the dots as we pour over another busy week of corporate earnings. As we collect data points and other nuggets next week, we’ll continue to update our thoughts on the market, the portfolio’s holdings, and stocks on our radar. What is said about the impact of tariffs, consumer spending, hiring, and other industry-specific comments will be high on our list of items to watch and listen for.
Here's a closer look at the earnings reports coming at us next week:
Monday, May 5
· Open: Cummins (CMI), Freshpet (FRPT), onsemi (ON), Tyson Foods (TSN)
· Close: Air Lease (AL), Clorox (CLX), Denny’s (DEN), Ford Motor (F), Hims & Hers Health (HIMS), IAC (IAC), Interparfums (IPAR), Lattice Semi (LSCC), Mattel (MAT), Palantir (PLTR), Realty Income (O)
Tuesday, May 6
· Open: ADM (ADM), Data Dog (DDOG), Duke Energy (DUK), Ferrari (RACE), GlobalFoundries (GFS), Marriott (MAR), Philips (PHG), TopBuild (BLD), TreeHouse Foods (THS)
· Close: AMD (AMD), Coty (COTY), International Flavors (IFF), Redfin (REFN),
Wednesday, May 7
· Open: Bandwidth (BAND), Edgewell Personal Care (EPC), Kennametal (KMT), Rockwell Automation (ROK), Shopify (SHOP), Uber (UBER), Walt Disney (DIS)
· Close: American States Water (AWR), Arm Holdings (ARM), Axon (AXON), Carvana (CVNA), DoorDash (DASH), Dutch Bros (BROS), Fastly (FSLY), Fortinet (FTNT), GoodRX (GDRX), Radware (RDWR), Skyworks (SWKS), Zillow (ZG)
Thursday, May 8
· Open: Canada Goose (GOOS), Hanesbrands (HBI), Installed Building Products (IBP), Molson Coors Brewing (TAP), Nomad Foods (NOMD), Papa John’s (PZZA), Tapestry (TPR), Warner Brothers Discovery (WBD)
· Close: Affirm (AFRM), AMN Healthcare (AMN), Cloudflare (NET), Expedia Group (EXPE), Rackspace (RXT), Rocket Lab (RKLB), Synaptics (SYNA), Toast (TOST)
Friday, May 9
· Open: Construction Partners (ROAD)
Portfolio Investor Resource Guide
· Economic Data: Here's a List of Links to the Key Economic Data We Closely Watch
· Investing Terminology: 16 Key Terms Club Members Should Know
· 10-Ks: Want to Know About a Stock? Read the Company's Reports
· 10-Qs: Unlock the Numbers and Key Information Behind Your Stock With the 10-Q
· Income Statement: Our Cheat Sheet to Understanding This Financial Document
· Balance Sheet, Cash Flow Statements, and Dividends: How to Know If a Company Is Off-Kilter? Read Its Balance Sheet
· Valuation Metrics: Everyone Wants a Value. Here's How Investors Can Find
· Thematic Investing 101 Webinar
The Portfolio Ratings System
1 - Buy Now (BN): Stocks that look compelling to buy right now.
2 - Stockpile (SP): Positions we would add to on pullbacks or a successful test of technical support levels.
3 - Holding Pattern (HP): Stocks we are holding as we wait for a fresh catalyst to make our next move.
4 - Sell (S): Positions we intend to exit.
ONES
Alphabet GOOGL; $164.03; 1,035 shares; 3.60%; Sector: Communication Services
UPDATE: After getting clobbered along with other tech stocks during the March quarter, Alphabet GOOGL rebounded modestly in April following the company’s March-quarter earnings report that quelled concerns that weighed on the shares. Even after adjusting for the $8 billion unrealized gain on a private investment company investment housed in Alphabet’s Other Income line, it still delivered a head-and-shoulder consensus EPS beat for the quarter led by better-than-expected revenue but also meaningful margin improvement at Google Services and Google Cloud. However, a more conservative stance led us to trim our price target to $200 from $210 while others boosted theirs. The only knock we would point out was the modest sequential revenue improvement at Google Cloud, but it was still up a hefty 28% year over year. Alphabet reaffirmed its $75 billion capital spending plan for this year, which should address those constraints. At the same time, it authorized an additional $70 billion for its share repurchase program and upped its quarterly dividend by 5% to $0.21 per share. The combination of 2025 capital spending levels and increases in both the share repurchase program and the dividend send a signal about the company’s confidence in its prospects. Our view has been that given its position in search and the presence it has through YouTube as well as its ability to monetize both, Alphabet remains well positioned in the AI race. The next known catalyst for the shares will be its Google I/O 2025 event on May 20 to May 21. The first payment of the company’s new quarterly dividend will be on June 16 to stockholders of record as of June 9.
1-Wk. Price Change: 1.3%; Yield: 0.5%
INVESTMENT THESIS: We believe that while search and digital ad dominance are what will carry shares in the near-to mid-term, longer-term it is the company's artificial intelligence "moat" that will provide for new avenues of growth. Exiting the March 2025 quarter, Alphabet reported over 270 million paid subscriptions across YouTube and Google One. YouTube Music and Premium alone reached 125 million subscribers globally. AI is what has made the company's search, video, and targeted ad capabilities best-in-class and is the driving force behind the company's success in voice (Google Home) and autonomous driving (Waymo). Furthermore, we believe it is this AI expertise that will also make the company more prevalent in other industries, including healthcare via its subsidiary Verily, as AI and machine learning continue to disrupt operations across industries. Exiting the March 2025 quarter, across all of its products Alphabet had 0.5 billion users using its Gemini models. Adding to our positive view of the company's future opportunities, we believe that Alphabet's free cash flow generation and solid balance sheet set it apart and are what will allow the company to continue taking chances on far-out ground-breaking and potentially world-changing projects as well as fund capital returns to shareholders. We will continue to monitor advertising spend as well as the competitive landscape for the company’s core Search and Advertising business.
Target Price: Reiterate $200; Rating: One
Panic Point: Under revision
RISKS: Regulatory risk (data privacy), competition, and macroeconomic slowdown impacting consumers and therefore ad buyer activity.
Amazon AMZN; $189.98; 861 shares; 3.48%; Sector: Consumer Discretionary
UPDATE: Like other tech-related stocks, shares of Amazon AMZN trended lower in April, adding to their cumulative decline for the first four months of the year. Weighing on the shares were concerns over AI and data center adoption as well as capital spending levels, but also the impact of Trump tariffs on its domestic digital shopping business. Entering May, the company reported March-quarter EPS that topped expectations while revenue matched the market consensus. Parsing those figures, we explained in our Alert the driver behind that was the company’s margin improvement that results from a favorable revenue mix shift toward higher margin businesses including Amazon Web Services (AWS) and advertising services, as well as the adoption of AI across its digital shopping businesses. We continue to see further gains ahead in those businesses in part as Amazon addresses lingering capacity constraints but also because we are still in the relatively early innings for AI and cloud adoption. As investors, it’s that step function higher in profit growth that we want to participate in with AMZN shares. While Amazon issued June-quarter revenue guidance that bookended market expectations, its outlook for operating income was modestly below what the market was looking for. The culprit is the impact of tariffs on Amazon’s North America digital shopping business, however, we also have to recognize that Amazon tends to skew overly conservative with its operating income forecasts. Helping buoy AMZN shares as we exit the week are reports of potential thawing in trade talks between the U.S. and China, and the impact that progress on that front could have on tariffs. We view those reports as constructive, and while we may be hopeful about what comes next, we continue to think these talks will be measured in weeks not days, and that the ultimate details will be what matters most. Any rollback or elimination of Trump tariffs would lead to Wall Street revisiting H2 2025 expectations for Amazon. Near-term, however, we will soon be hearing from retailers that lack those higher-margin businesses housed inside Amazon that will help minimize the overall impact of tariffs on Amazon’s bottom line. In our view, that context to come will remind folks that, while Amazon should continue to win consumer wallet share, it is much more than just a digital shopping company.
1-Wk. Price Change: 0.5%; Yield: 0.0%
INVESTMENT THESIS: We believe the upside will result from Amazon's continued eCommerce dominance, AWS's continued leadership in the public cloud space, and ongoing growth of the company's advertising revenue stream, which feeds off Amazon's eCommerce business. Additionally, we think profitability will continue to improve as AWS and advertising account for a larger portion of total sales as both these segments sport higher margins than the eCommerce operation. While we believe the increasing share of the revenue from these higher margin businesses will be key to driving profitability longer-term, we think margins on eCommerce stand to improve as the company's infrastructure is further built out and economies of scale further kick in. The embedded call option is that management is always looking to enter a new space and generate new revenue streams.
Target Price: Reiterate $260; Rating: One
Panic Point: Under revision
RISKS: High valuation exposes the stock to volatile swings, eCommerce has exposure to slower consumer spending and competition, management is not afraid to invest heavily, potential headwinds resulting from new eCommerce regulation in India, and management is not scared to invest aggressively for growth, which can at times cause volatile reactions as near-term concerns arise relating to the impact on margins.
American Express AXP; $276.85; 490 shares; 2.88%; Sector: Financial Services
UPDATE: Coming off the almost 10% move lower during the March quarter, American Express AXP shares rebounded off their early April lows to finish the month down modestly. Like many other of our holdings, the catalyst for the April bounce was the company’s March-quarter earnings report that showed the power, and, in our view, differentiation tied to its membership business model. During the quarter, roughly 70% can be attributed to net card fees, which climbed 18% year over year. That overshadowed the 5% gain in network volumes and a nice increase in average member spending. Management continues to plan multiple product refreshes this year, but on the topic of increasing card fees we suspect that much like Costco, Amex is only going to do so when the time is right. For Amex that means being able to bring even more value to the membership base, and, in our view, that helps keep retention rates high. Another reason why we like membership business models. While we boosted our AXP price target following the company’s December-quarter results, given the current environment we’ve taken a more conservative stance, which led us to reduce our AXP target to $310 from $345 in mid-April. During the March quarter, American Express repurchased 2.3 million common shares at an average price of $297.37, and under its current program, it is still authorized to repurchase another 72.9 million. Given the current share price, we would not be surprised to learn Amex flexed that program during April.
1-Wk. Price Change: 4.5%; Yield: 1.2%
INVESTMENT THESIS: American Express is a globally integrated, membership-driven payments company, providing customers with access to products, insights, and experiences that enrich lives and build business success. The company has four reportable operating segments: U.S. Consumer Services (USCS), Commercial Services (CS), International Card Services (ICS), and Global Merchant and Network Services (GMNS). American Express targets the premium consumer space by continuing to deliver membership benefits that span our customers’ everyday spending, borrowing, travel, and lifestyle needs, expanding its roster of business partners around the globe, and developing a range of experiences that attract high-spending customers. In 2024, the company’s net card fee revenue accounted for 65% of its pre-tax income, which we see providing a differentiated business model that should continue to grow as Amex wins new card members and drives its average fee per card higher.
Target Price: Reiterate $310; Rating: One
Panic Point: Under revision
RISKS: Slowdown in consumer spending, competition, membership growth, merchant acceptance, lack of new product innovation.
Bank of America Corp. BAC; $41.07; 4,410 shares; 3.84%; Sector: Financial Services
UPDATE: In the Monthly Roundup for February, we shared that continued stock market volatility could weigh on IPO expectations despite the continued growth in transaction filings. That is what unfolded and even though M&A activity perked up, Bank of America BAC slumped further in March and April as deal-making activity continued to slow as tariff uncertainty rattled the stock market. During the company’s March-quarter earnings call, the BofA management team shared that the investment banking pipeline is “healthy,” but clients are waiting on clarity before moving forward with intended transactions. When it comes to BofA’s investment banking activity, M&A deals should remain a favorable driver, and market volatility should keep its trading revenue elevated. When we see the IPO market re-open on a sustained basis or M&A activity accelerate in a meaningful way, that would be a reason for us to revisit our BAC price target and could be a catalyst to revisit our rating. We suspect BofA will continue to make inroads against smaller, regional banks allowing continued growth in its overall account base, a lead generator for its wealth management business, and vice versa. Management targets 2% to 3% expense growth this year, and a tight rein on costs could translate into larger stock buybacks, especially if we see an acceleration in investment banking activity. In response to the revised near-term outlook for investment banking activity, we reduced our BAC target to $45 from $53. Should we see BAC shares move past the $40 level without signs of a pick-up deal activity, we may need to revisit the current rating. BofA’s next quarterly dividend of $0.26 per share will be paid on June 27 to shareholders of record as of June 6.
1-Wk. Price Change: 3.5%; Yield: 2.5%
INVESTMENT THESIS: Bank of America is one of the world's leading financial institutions, serving individual consumers, small and middle-market businesses, and large corporations with a full range of banking, investing, asset management, and other financial and risk management products and services. The company provides unmatched convenience in the United States, serving approximately 67 million consumer and small business clients with approximately 3,900 retail financial centers, approximately 16,000 ATMs, and award-winning digital banking with approximately 56 million verified digital users. Bank of America is a global leader in wealth management, corporate and investment banking, and trading across a broad range of asset classes, serving corporations, governments, institutions, and individuals around the world. Bank of America offers industry-leading support to approximately 3 million small business households through a suite of innovative, easy-to-use online products and services. The company serves clients through operations across the United States, its territories, and approximately 35 countries. From a reporting perspective, the company's business breaks down as follows: Net Interest Income breakdown: Consumer Banking 57%, Global Banking 23%, Global Wealth & Investment Management 14%, and Global Markets 6%; Income Before Tax breakdown: Consumer Banking 42%, Global Banking 27%, Global Wealth & Investment Management 16%, and Global Markets 15%. Bank of America pays a quarterly dividend of $0.26 per share, up from $0.18 a few years ago.
Target Price: $45; Rating: One
Panic Point: Under revision
RISKS: Financial markets, fiscal, monetary, and regulatory policies, economic conditions, and credit ratings.
Eaton Corp. ETN; $299.71; 630 shares; 4.00%; Sector: Industrials
UPDATE: After falling 18% in the March quarter, and moving even lower in early April, shares of Eaton ETN rebounded hard in April, rising more than 8% leading them to easily outpace the overall market for the month. This week, the company reported March-quarter results that edged out market expectations, lifted its 2025 organic growth forecast, and reiterated 2025 EPS guidance of $11.80-$12.20. Backing up that outlook was continued bookings related to data center and utility work for its electrical business, while defense spending and other programs benefited Eaton’s aerospace business. During the company’s earnings call management shared U.S. data center construction backlog now stands at nine years based on the 2024 build rates, up from the seven years exiting 2024. Outside the U.S. it noted strong activity in the EMEA and APAC regions as well, which is not surprising given what we’re reading about global data center construction. Those stats back up what we are hearing from Big Tech companies as they reiterated their AI and data center capital spending plans last week and this week. As we see the mix shift in that industry move toward AI data centers, we should see Eaton’s dollar per megawatt content rise given greater power density, larger volumes of electrical equipment but also greater cooling requirements. In our view that is the driving story behind the opportunity in Eaton’s shares and one we aim to capture as shareholders. We recognize there will be some modest margin pressure, largely on the company’s Vehicle segment, due to tariffs, but if trade deals emerge and Trump tariffs rolled back that would be another catalyst for the shares. From the strong move up from the April low near $240, we see layers of resistance ahead for the shares near $309 and $316. Given the growing potential for the Fed to push back on rate-cut timing next week following what we saw in the April ISM Manufacturing Report and Friday’s stronger-than-expected April Employment Report, a more compelling pick-up point for this One rated holding would be closer to $290. Even more so closer to $282.
1-Wk. Price Change: 3.8%; Yield: 1.4%
INVESTMENT THESIS: Eaton is an intelligent power management company that makes products for data center, utility, industrial, commercial, machine building, residential, aerospace, and mobility markets. That business is positioned to capitalize on the megatrends of electrification, energy transition, and digitalization. We see Eaton helping address the power pain point created by data center, EV charging infrastructure, and other drivers of electricity demand. Research estimates that data center power demand will grow 160% by 2030, accounting for 3%-4% of global power up from 1%-2% today. Data centers will use 8% of U.S. power by 2030, compared with 3% in 2022.
Target Price: Reiterate $400; Rating: One
Panic Point: Under revision
RISKS: Raw material costs, labor costs, end market volatility, government legislation.
Elastic N.V. ESTC; $82.92; 1,792 shares; 3.14%; Sector: Consumer Cyclical
UPDATE: After matching the Nasdaq Composite in shedding 10% during the March quarter, Elastic ESTC shares bottomed out in early April. We used the disconnect between the continued pressure on ESTC and the multiple data points and other signals pointing to accelerating AI adoption to pick up more shares for the portfolio in mid-April at $81.65. ESTC share rebounded following quarterly results from SAP SE and ServiceNow, which added further support for AI and other productivity-led spending. The next known catalyst for the shares will be AI adoption comments from other software vendors and Elastic’s quarterly results that if history holds should be reported in mid-May. Between now and then we’ll be looking for program and customer wins, refining our price target as needed. We have some room to add to the portfolio’s ESTC position, and a pullback in the market would only improve the already compelling risk-to-reward trade-off in the shares.
1-Wk. Price Change: -1.5%; Yield: 0.0%
INVESTMENT THESIS: As digital transformation drives mission-critical business functions to the cloud, Elastic N.V. brings the portfolio exposure to search AI adoption across IT and enterprise business lines as companies look to drive productivity. Elastic bills itself as the Search AI company and its Elastic Search AI Platform as a hosted, managed service across major cloud providers, including Amazon Web Services (AWS), Google Cloud, and Microsoft’s Azure in more than 55 public cloud regions globally. Customers can also deploy Elastic’s platform across hybrid clouds, public or private clouds, and multi-cloud environments. What we like even more about this is Elastic’s subscription-based business model, which accounts for just over 93% of its total revenue stream. As we’ve discussed before with other companies, this affords not only good visibility but also predictable cash flow and earnings. Moreover, the gross margins associated with the subscription business are above 80%, which helps explain the rising margin profile and EPS as that business has come to account for a greater percentage of overall revenue. When it comes to potential risks, one sign that would lead us to reconsider owning the shares would be if either Elastic’s customer count or its subscription revenue per customer stalled. Another item we’ll be watching because of Elastic’s geographic mix, with 40% of its revenue outside of the U.S., is the dollar and its corresponding foreign exchange impact.
Target Price: Reiterate $140; Rating: One
Panic Point: Under revision
RISKS: Enterprise software spending, AI adoption, competitive dynamics, foreign exchange risk.
Marvell Technology MRVL; $62.33; 2,775 shares; 3.65%; Sector: Technology
UPDATE: After being battered during the March quarter, shares of Marvell MRVL continued to trend lower in April along with the Nasdaq Composite and other tech stocks. In early April, following the growing number of AI adoption data points we used the cumulative move lower to pick up some MRVL shares at $54.77 and did so again a few weeks later at $55.19. Weighing on the shares during the month were questions over AI capital spending levels, which were put to rest when Alphabet and Microsoft reiterated their 2025 capital spending plans and Meta lifted its capital spending plans for this year. During Amazon’s March-quarter results, it shared that its new custom AI chip Trainium2 is “starting to lay in capacity in larger quantities with significant appeal and demand” and that its AI capacity constraints continue to throttle revenue. When Marvell reported its January-quarter results, management said that the mix of AI is now over 50% of data center revenue, which means when annualizing that January-quarter figure and factoring in the continued ramp of custom AI solutions with Amazon, Meta, and Alphabet, it’s easy to see why Marvell expects “to very significantly exceed [its] $2.5 billion target in fiscal 2026.” Add in the continued rebound in carrier infrastructure and enterprise networking as AI adoption drives network congestion, and we continue to see a very nice tailwind behind Marvell’s business for this year into next year, especially as its custom AI solution with Microsoft starts to ship in calendar 2026.
1-Wk. Price Change: 5.8%; Yield: 0.4%
INVESTMENT THESIS: Marvell is a fabless supplier of high-performance standard and semi-custom infrastructure semiconductor solutions. These solutions power the data economy, enabling the data center, carrier infrastructure, enterprise networking, consumer, and automotive/industrial end markets. With roughly 75%-80% of Marvell's revenue stream tied to digital infrastructure, we see it continuing to benefit from rising content consumption and creation. Pointing to that rising demand that necessitates network densification and the build of digital infrastructure, Ericsson sees global monthly average usage per smartphone reach 46 gigabytes (GB) by the end of 2028 vs. 19 GB in 2023 and 15 GB in 2022.
Target Price: Reiterate $115; Rating: One
Panic Point: Under revision
RISKS: Technology risk, customer risk, competition risk, reliance on manufacturing partners, and supply chain constraints.
Morgan Stanley MS; $120.22; 1,462 shares; 3.73%; Sector: Financial Services
UPDATE: In the Monthly Roundup for March, we discussed the cooling outlook for IPO activity following the lower-than-expected pricing of CoreWeave’s initial share offering. After that pricing and given market turmoil and uncertainty erupting from Trump tariffs, both Klarna and StubHub announced they would both hold back their IPOs. While all eyes are on Trump tariffs, we will continue to follow developments on the regulatory front that could give way to a rebound in M&A activity. During Morgan Stanley's March earnings call, the management team noted robust M&A pipelines, with activity driven by financial sponsors and mid-size deal growth. While we can surmise that near-term deal activity is stalled given market volatility and uncertainty, the firm's message was that underlying demand for strategic advice and capital raising remains strong. However, a strong pipeline doesn’t answer the question of when a pick-up in deal activity will begin. That answer will likely come when market volatility and Trump-related uncertainty begin to subside. We reduced our MS target to $125 from $145, but will need to revisit it when deal-making and IPO activity re-accelerate. The portfolio’s position in MS is on the larger side, so should a challenging March quarter earnings season lead MS back to the $100 level that could be a nice place to round out the position. With less than a 10% upside to our new price target, barring a rebound in deal-making activity, we may need to revisit our current One rating before too long.
1-Wk. Price Change: 3.6%; Yield: 3.1%
INVESTMENT THESIS: Morgan Stanley reports in three business segments: Institutional Securities (42% of trailing 12-month revenue, 38% of trailing 12-month Income Before Tax), Wealth Management (48%, 55%) and Investment Management (10%, 6%). While the IPO window has yet to reopen, the potential IPO class for 2025 continues to build with recent additions including Klarna and StubHub. That would be a boon to private equity firms and others that have been nursing IPO candidates during the dark period and a positive for Morgan Stanley's investment banking business. Expected deregulation under the Trump administration is a potential catalyst for Morgan's M&A business. Meanwhile, folks continuing to be behind in retirement savings bodes well for Morgan Stanley's wealth management business in the coming quarters while continued market volatility bodes well for its equity trading business.
Target Price: $125; Rating One
Panic Point: Under revision
RISKS: Market and interest rate risk, credit risk, country risk, and operational risk, including cybersecurity.
Nvidia Corp. NVDA; $114.50; 1,535 shares; 3.71%; Sector: Technology
UPDATE: Following their cumulative move lower during the March quarter, shares of Nvidia NVDA remained volatile throughout April but ultimately finished the month modestly higher. Weighing on the shares during the month were questions over AI capital spending levels, which were largely put to rest when Alphabet and Microsoft reiterated their 2025 capital spending plans and Meta lifted its capital spending plans for this year. Comments from Amazon that it sees no slowdown in AI demand or data center construction last week also brought another layer of support for our owning NVDA shares. While Nvidia’s top-line guidance for the current quarter was above market forecasts, the accelerated ramp for its Blackwell solutions is dinging near-term gross margin prospects. As we explained in our Alert, as production matures, Nvidia’s management expects those margins will return to the mid-70s “later this year,” which means that, in the near term, meeting consumer demand trumps cost improvement efforts. Ramping to meet demand isn’t easy under normal conditions but when there is a sea change underway that drives explosive demand, it’s even more challenging. If it sounds like we’re inclined to give Nvidia a pass, we are, but only because of rising AI adoption levels and capital spending to expand the digital infrastructure to support it. We continue to think rising AI adoption across consumers, enterprises, and other institutions (including local, state, and federal governments), driving productivity and other efficiencies, means we have a multi-year explosion of digital content creation and consumption ahead of us that will pressure data center and network capacity. With that in mind, CEO Nelson Huang estimated that by the end of the decade, and potentially sooner, data center build-out should top $1 trillion. That keeps us bullish on Nvidia and others in the portfolio. Nvidia will report its April quarter results on May 28.
1-Wk. Price Change: 3.1%; Yield: 0.0%
INVESTMENT THESIS: Nvidia is well positioned to benefit from ramping AI and data center spending. The company pioneered accelerated computing to help solve the most challenging computational problems. Nvidia is now a full-stack computing infrastructure company with data-center-scale offerings that are reshaping the industry. The company's full stack includes the foundational CUDA programming model that runs on all Nvidia GPUs, as well as hundreds of domain-specific software libraries, software development kits, or SDKs, and Application Programming Interfaces, or APIs. This deep and broad software stack accelerates the performance and eases the deployment of Nvidia accelerated computing for computationally intensive workloads such as artificial intelligence, model training and inference, data analytics, scientific computing, and 3D graphics, with vertical-specific optimizations to address industries ranging from healthcare and telecom to automotive and manufacturing. Nvidia reports in two business segments: Compute & Networking and Graphics. The Compute & Networking segment (78% of revenue, 85% of operating income) is comprised of Data Center accelerated computing platforms and end-to-end networking platforms, including Quantum for InfiniBand and Spectrum for Ethernet; NVIDIA DRIVE automated-driving platform and automotive development agreements; Jetson robotics and other embedded platforms; Nvidia AI Enterprise and other software; and DGX Cloud software and services. The Graphics segment (22% of revenue, 15% of operating income) includes GeForce GPUs for gaming and PCs, the GeForce NOW game streaming service and related infrastructure; Quadro/NVIDIA RTX GPUs for enterprise workstation graphics; virtual GPU, or vGPU, software for cloud-based visual and virtual computing; automotive platforms for infotainment systems; and Omniverse Enterprise software for building and operating metaverse and 3D internet applications.
Target Price: $150; Rating One
Panic Point: Under revision
RISKS: Market and interest rate risk, credit risk, country risk, and operational risk, including cybersecurity.
Qualcomm Inc. QCOM; $139.81; 1,220 shares; 3.62%; Sector: Technology
UPDATE: Closing out April, Qualcomm QCOM shares were down just over 3% on a year-to-date basis, outperforming the 9.65% drop posted by the Nasdaq Composite over the same period. Following Qualcomm’s March-quarter results this week, we lowered our price target to $180 for $220 given the likely pull forward in smartphone and PC demand ahead of Trump tariffs in April and uncertainty for pending Trump tariffs on those devices and others. As we monitor those developments, we’ll remind members that our play with Qualcomm is the valuation re-think as the company reduces its exposure to the smartphone market and Apple by leaning into the Android market and ramping automotive, AI PC, and IoT revenue. The company’s chip business, better known as QCT, posted an 18% year-over-year revenue increase in the March quarter led by stronger gains in automotive and IoT. While the rate of growth for the much larger handset business was slower, at 12% year over year, it too was better than expected given the typical seasonal pattern. Given program wins, including 90 flagship designs shipping or announced globally across major Android OEMs, and 14 commercial vehicle launches during the March quarter (29 over the last six months) we see a stronger H2 2025 for Qualcomm compared to H1 2025. Because of that and tariff uncertainty, it’s not surprising folks are taking a more cautious stance and that likely means near term the smartphone and PC story will be a “show me” one. As fresh data becomes available, we will revisit our price target and, if need be, our rating. With QCOM shares falling in response to the earnings report, given the position size in the portfolio, we may be a buyer in the coming days as the shares settle out. However, for members who are underweight QCOM, this latest pullback is a nice spot to collect some shares. Catalysts we will be watching include upcoming quarterly results from Apple, Skyworks, and others tied to the smartphone market, PC comments from AMD, monthly revenue reports from Taiwan Semiconductor, and Qualcomm management’s appearance on May 14 at the J.P. Morgan 53rd Annual Global Technology Media and Communications Conference.
1-Wk. Price Change: -5.9%; Yield: 2.5%
INVESTMENT THESIS: Qualcomm focuses on foundational technologies for the wireless industry, including 3G (third generation), 4G (fourth generation), and 5G (fifth generation) wireless technologies and processor technologies including high-performance, low-power computing, and on-device artificial intelligence technologies. As a connected processor company, its technology roadmap aims to enable the connected intelligent edge (the next generation of smart devices) across industries and applications beyond handsets, including automotive and the Internet of Things (IoT). Qualcomm has three reportable segments: QCT (Qualcomm CDMA Technologies) semiconductor business, which develops and supplies integrated circuits and system software based on 3G/4G/5G and other technologies for use in mobile devices; automotive systems for connectivity, digital cockpit, and ADAS/AD; and IoT including consumer electronic devices; industrial devices; and edge networking products. QCT accounts for 80%-85% of revenue. QTL (Qualcomm Technology Licensing) licensing business grants licenses or otherwise provides rights to use portions of the company's intellectual property portfolio, which includes certain patent rights essential to and/or useful in the manufacture and sale of certain wireless products. QTL accounts for ~15% of Qualcomm's revenue but contributes a greater portion of the company's operating income. Our focus on QCOM shares is revenue diversification as part of management's intended strategy to lessen its reliance on the smartphone market, by tapping into the AI PC, IoT, and automotive chip markets. We see this unfolding over the next few years, which should lead Wall Street to revisit how it values the shares. It is that opportunity we aim to capture by owning the shares over the longer term.
Target Price: $180; Rating: One
Panic Point: Under revision
RISKS: Customer risk, technology advancement, competition risk, third-party supplier, and manufacturing partner risk.
ServiceNow NOW; $977.36; 207 shares; 4.29%; Sector: Technology
UPDATE: After peaking in January, shares of ServiceNow NOW, like many other tech companies, were hard hit during the March quarter. During February and March, we used the pullback to build the portfolio’s position size, and in April that effort was rewarded following the company’s impressive March-quarter earnings report. Leading up to that report, we shared multiple data points about continued, if not accelerating AI adoption as companies and other institutions sought to drive a combination of productivity and savings. The company’s March quarter showcased the continued adoption of AI and cloud, which benefited pricing, margins and grew its subscription revenue. For the June quarter, ServiceNow sees subscription revenue coming in at $3.03 billion-$3.04 billion, which implies overall revenue near $3.1 billion, in line with consensus forecasts. The lift in that outlook is backed by the company’s current remaining performance obligations (cPRO) of $10.3 billion and remaining performance obligations (RPO) of $22.3 billion exiting the March quarter. Those same figures, which were up 19% and 23%, respectively, on a year-over-year basis, also back the higher subscription revenue outlook of $12.64 billion‑$12.68 billion for this year. We’ll look for more insight on the afternoon of May 5 when the company hosts its 2025 Financial Analyst Day. As we digest that event, we will revisit our fresh NOW price target of $1,100 as needed.
1-Wk. Price Change: 3.4%; Yield: 0.0%
INVESTMENT THESIS: The addition of ServiceNow adds exposure to the enterprise as it deploys AI-enabled solutions across its enterprise workflow platform. The company’s “Now Platform” is a cloud-based solution with embedded AI and machine learning (ML) capabilities that help unify and digitize workflows, driving productivity. At the heart of it, the company’s platform automates workflows across an entire enterprise by connecting disparate departments, systems, and silos in a seamless way to unlock productivity. ServiceNow counts more than 8,100 global customers, including 85% of the Fortune 500, with 97% of its revenue from subscriptions that have notched a 98% renewal rate. During the March 2025 quarter, ServiceNow also announced plans to acquire Moveworks, which offers front-end AI assistant and enterprise search technology, and Logik.ai, which provides AI-powered, and composable configure, price, quote solutions for sales teams. We see these moves augmenting its offering and helping pave the way for further adoption of AI and subscription-based revenue.
Target Price: Reiterate $1,100; Rating: One
Panic Point: Under revision
RISKS: Industry and economic risk, competition and competitive pressures, and acquisition risk.
United Rentals URI; $665.40; 270 shares; 3.82%; Sector: Industrials
UPDATE: Throughout the March quarter, whether it was favorable data points on infrastructure construction projects from Tudor Perini, similar comments made at Eaton’s 2025 Investor Day or year-over-year gains in nonresidential construction spending, shares of United Rentals URI moved lower. We took advantage of that in early March when the portfolio scooped up additional shares at $612.69. URI shares continued to move lower with the market, bottoming in early April before jumping higher following consensus-topping March-quarter results. Management reiterated its 2025 guidance for total revenue between $15.6 and $16.1 billion and adjusted EBITDA of $7.2 billion to $7.45 billion. With nine months of domestic construction spending data yet to be reported, as the figures for April, May, and June are released, we’ll revisit management’s guidance. We’ll also factor in what other companies serving the construction industry have to say over the coming weeks. On the earnings call, management discussed the re-armed $1.5 billion share repurchase authorization, sharing expectations to fully utilize it by the end of the March 2026 quarter. For this year, including the $250 million repurchased in the March 2025 quarter, management targets repurchasing $1.5 billion in stock. Simple math tells us that means a big step up in activity over the coming quarters to hit that target, and that activity will be another reason why we see EPS forecasts get lifted by Wall Street analysts. As we move through the seasonally strong part of the year for construction activity, we will revisit our revised $800 price target as incoming data is received.
1-Wk. Price Change: 5.0%; Yield: 1.1%
INVESTMENT THESIS: United Rentals, the largest equipment rental company in the world, operates throughout the United States and Canada, and has a limited presence in Europe, Australia, and New Zealand. It serves industrial and other non-construction; commercial (or private non-residential) construction; and residential construction. Industrial and other non-construction rentals represented approximately 50% of rental revenue, primarily reflecting rentals to manufacturers, energy companies, chemical companies, paper mills, railroads, shipbuilders, utilities, retailers, and infrastructure entities; commercial construction rentals represented approximately 46% of rental revenue, primarily reflecting rentals related to the construction and remodeling of facilities for office space, lodging, healthcare, entertainment, and other commercial purposes; and residential rentals around 4% of revenue. We see the company benefiting on three fronts — the seasonal uptick in construction spending; the release of funds and projects associated with the five-year Biden Infrastructure bill; and the company's nip-and-tuck acquisition strategy that should further enhance its geographic footprint.
Target Price: Reiterate $800; Rating: One
Panic Point: Under revision
RISKS: Industry and economic risk, competition and competitive pressures, and acquisition risk.
Universal Display OLED; $144.02; 1,388 shares; 4.22%; Sector: Technology
UPDATE: Despite the continued move lower in April for Universal Display OLED shares, we continued to see signs of the shift toward organic light-emitting diode displays across smartphones, monitors, TVs, and other applications. That led us to take advantage of the cumulative move lower so far this year and add some OLED shares to the portfolio in mid-April at $116.27. As we’ve seen before, Universal’s management team delivered what looks to be conservative top-line guidance for 2025 despite besting March-quarter expectations and expectations for further organic light-emitting diode technology adoption in the coming quarters. Research firm Omdia that sees organic light-emitting diode adoption in smartphones growing mid-single digits this year to 848 million units; tablets, laptops, and monitors up 16% year-over-year to 27 million units; and TVs using the display technology rising 4.5% year-over-year to 7.1 million units. Those figures as well as adoption in the auto market and others keep us long-term bullish on OLED shares. We also saw Universal reach a key milestone with its blue offering as LG Display announced it is ready to commence commercialized volumes. This is key because much like with light-emitting diodes (LED), commercialized blue rounds out all three primary colors but also blue is the gateway to white organic light-emitting diodes. While we are not ones to jump the gun, we would point out that was one of the final hurdles for the LED market to attack the general lighting market. This bodes well not only for materials demand for Universal, but it will likely trigger negotiations for its royalty and licensing fee segment that carries significantly higher margins. It also reaffirms our long-term stance on OLED shares. Helping blunt near-term tariff uncertainty, which led Universal to not issue specific June-quarter guidance, the company announced a new share repurchase program that authorizes it to purchase up to $100 million of common stock. It also announced its next quarterly dividend of $0.45 will be paid on June 30 to shareholders of record on June 16. As clarity on the trade front comes, we will revisit what that means for market segments that are driving the adoption of organic light-emitting diodes. At the same time, we will also monitor demand signals from companies involved in the supply chain for those products. With that in mind, we will be keenly interested in Taiwan Semi’s April revenue report and company comments during the upcoming May conference season.
1-Wk. Price Change: 13.9%; Yield: 1.2%
INVESTMENT THESIS: Universal Display focuses on the development and commercialization of organic light-emitting diode (OLED) technologies and materials for use in display and solid-state lighting applications. OLED displays are capturing a growing share of the display market, especially in the mobile phone, television, monitor, wearable, tablet, notebook, personal computer, augmented reality (AR), virtual reality (VR), and automotive markets. This adoption reflects advantages over competing display technologies concerning power efficiency, contrast ratio, viewing angle, video response time, form factor, and manufacturing cost. Universal Display's business strategy is to develop new OLED materials and sell existing and new materials to product manufacturers for display applications, such as mobile phones, televisions, monitors, wearables, tablets, portable media devices, notebook computers, personal computers, and automotive applications, and specialty and general lighting products. The company also looks to license its OLED material, device design, and manufacturing technologies to those manufacturers. As such, Universal Display has a significant portfolio of proprietary OLED technologies and materials with more than 5,500 patents issued and pending worldwide.
Target Price: Reiterate $200; Rating: One
Panic Point: Under revision
RISKS: Patent and Intellectual property protection; maintaining OLED manufacturing and customer relationships; technology risk; market risk.
Vulcan Materials Company VMC; $267.05; 613 shares; 3.47%; Sector: Building Materials
UPDATE: The double-digit gain in April notched by shares of Vulcan Materials VMC more than offset their Q1 2025 decline, landing them back in the black through the first four months of 2025. Back when the company delivered its Q4 2024 earnings, the management team telegraphed a third consecutive year of double-digit year-over-year growth in the Aggregates segment, cash gross profit, and a more substantial increase in the Total Asphalt and Concrete segments cash gross profit. While first-quarter volumes were impacted by wet winter weather, pricing power drove meaningful margin expansion year over year, which led Vulcan to deliver a solid EPS beat. Management reiterated its 2025 guidance that calls for adjusted EBITDA between $2.35 and $2.55 billion versus $2.057 billion last year. We continue to see the housing market as a headwind for Vulcan given affordability factors and economic uncertainty. However, infrastructure spending and private non-residential construction, such as data centers and other buildings, remain a very nice tailwind for construction activity. Paired with opportunistic but disciplined pricing, we see Vulcan’s adjusted EBITDA expanding meaningfully as we exit the seasonally weakest quarter into the two seasonally strongest. For now, we’re going to keep our VMC target at $310. We will review that target as monthly construction spending data is reported and we collect more data points from others in and around the sector. But it’s more than enough upside to maintain our One rating on a company that is likely to see minimal disruption from tariffs. When VMC shares pass $270, barring any new data, we may need to revisit that One rating.
1-Wk. Price Change: 8.1%; Yield: 0.7%
INVESTMENT THESIS: Vulcan Materials operates primarily in the U.S. and is the nation's largest supplier of construction aggregates (primarily crushed stone, sand, and gravel), a major producer of asphalt mix and ready-mixed concrete, and a supplier of construction paving services. Its products are the indispensable materials used in building homes, offices, places of worship, schools, hospitals, and factories, as well as vital infrastructure including highways, bridges, roads, ports and harbors, water systems, campuses, dams, airports, and rail networks. Ramping spending associated with the Biden Infrastructure Law should drive demand for Vulcan's products over the coming years. Vulcan has historically complemented its organic growth prospects by acquiring businesses to expand its geographic reach and product scope. Since 2014, the company has acquired more than two dozen companies, including the 2021 acquisition of U.S. Concrete. That combination has allowed the company to deliver steady top and bottom-line growth over the last decade, with only a modest decline when the pandemic hit in 2020.
Target Price: Reiterate $310; Rating: One
Panic Point: Under revision
RISKS: General economic and business conditions; dependence on the construction industry; timing of federal, state, and local funding for infrastructure; changes in the level of spending for private residential and private nonresidential construction.
TWOS
Apple AAPL ; $205.35; 825 shares; 3.58%; Sector: Technology
UPDATE: Apple AAPL shares moved lower during April amid tariff speculation, and we saw that uncertainty weigh on Apple’s June-quarter guidance despite reporting consensus-topping March-quarter results this week. We were not surprised by Apple’s beat given data that showed it picked up smartphone market share during the quarter and our expectation the higher-margin Services segment would become a larger piece of the quarter’s revenue mix. We expect that trend to continue in the current quarter as it tends to be the seasonally weakest for smartphone demand. We attribute that in part to falling several months after Apple introduced its latest iPhone models and more than a few months before introducing its next ones. While Apple will look to minimize the impact of tariffs by flexing its world-class supply chain, management conceded there will be some margin impact on its Product business. That, the continued air of uncertainty of tariffs, and our taking a more conservative approach for the market’s multiple, we reduced our AAPL target to $235 from $270. That same tariff uncertainty overhang will likely keep AAPL shares restrained near-term and that is another reason for us to maintain our Two rating. All told, we would characterize Apple’s March quarter as a good one, which was made even more palatable with a 4% increase in the quarterly dividend to $0.26 per share and the additional $100 billion added to its share repurchase program. Adding that fresh buyback injection to the $40.8 billion remaining under Apple’s existing program exiting March brings it to a staggering figure. The company’s new dividend is payable on May 15 to shareholders of record as of the close of business on May 12. As clarity on the trade front comes, we will revisit what that means for Apple and monitor other companies in the smartphone, PC, and connected device supply chain for signs of device demand. With that in mind, we will be keenly interested in Taiwan Semiconductor's April revenue report. Meaningful progress on trade talks could lead to a re-think of H2 2025 expectations for Apple. Subject to where the shares are trading should that happen, we may round out our position in the shares. In the coming weeks, we expect to see more attention build for what Apple will unveil on June 9 as it kicks off WWDC2025.
1-Wk. Price Change: -1.9%; Yield: 0.5%
INVESTMENT THESIS: While we acknowledge that near-to-midterm performance remains heavily influenced by iPhone sales, the dynamic is shifting as investors finally place greater emphasis on Services growth. We are bullish on the 5G upgrade cycle and believe longer-term upside will continue to come as Services revenue grows its share of overall sales. Services provide for a recurring revenue stream at higher margins, a factor that serves to reduce earnings volatility while allowing for a higher percentage of sales to fall to the bottom line; as a result, we believe that Services growth and the installed base, are much more important than how many devices the company can sell in each 90-day period. In addition to improved profitability, we also believe the transparent nature of this revenue stream will demand an expanded price-to-earnings multiple as segment sales grow. Furthermore, we believe that Apple's desire to push deeper into the healthcare arena will help make its devices invaluable as more life-changing features are added and the company works to democratize health records. Lastly, also see upside resulting from increased adoption of wearables (think the Apple Watch) and potential new product announcements such as an AR/VR headset or an update on Project Titan, the company's secretive autonomous driving program.
Target Price: Reiterate $235; Rating: Two
Panic Point: Under revision
RISKS: Slowdown in consumer spending, competition, lack of new product innovation, elongated replacement cycles, failure to execute on Services growth initiative.
Axon Enterprise AXON; $628.16; 187 shares; 2.49%; Sector: Aerospace & Defense
UPDATE: In late February we called Axon Enterprise AXON up to the portfolio from the bullpen, starting the new position at $496.31 and we built that out further during March. Following the company’s December-quarter results we lifted our price target to $625 from $600 but we recognize that following the more than 15% move higher in April we will need to revisit that target following Axon’s quarterly earnings report next week. Setting the stage for that, late this week, the White House budget for 2026 calls for increases in defense and homeland security spending, a pending catalyst for Axon's various business segments. In reviewing Axon’s March-quarter results as well as its guidance, we will be looking for the service side of its revenue stream to become a larger part of the revenue mix. That should drive some nice incremental margin improvement as well. We will also be tracking annual recurring revenue metrics, which crossed $1 billion in the December quarter, as well as progress on the company’s AI front. As we adjust our price target we will contemplate our current Two rating, but the odds are that unless we see an upside share price potential past $725, we’re likely to keep our current rating intact.
1-Wk. Price Change: 4.0%; Yield: 0.0%
INVESTMENT THESIS: Axon Enterprise develops, manufactures, and sells conducted energy devices and cloud-based digital evidence management software designed for use by law enforcement, corrections, military forces, private security personnel, and private individuals for personal defense. The company operates in two segments: Taser (recently renamed Connected Devices) and Software & Sensors (recently renamed Software & Services). Taser develops and sells CEDs used for protecting users and virtual reality training. Software & Sensors manufactures fully integrated hardware and cloud-based software solutions such as body cameras, automated license plate reading, and digital evidence management systems. Axon delivers its products worldwide and gets most of its revenue from the United States. According to Mordor Intelligence, the wearable, and body-worn cameras market on its own was valued at $1.62 billion in 2020 and is expected to reach $424.63 billion by 2026. Public safety organizations are increasingly adopting cloud solutions, leading to significant spending in this area. The digital spending in public safety is projected to reach $201 billion by 2027.
Target Price: Reiterate $625; Rating: Two
Panic Point: Under revision
RISKS: Manufacturing and supply chain, competitive factors, government regulation, technology change.
Costco Wholesale COST; $1,088.30; 187 shares; 4.01%; Sector: Consumer Staples
UPDATE: Costco COST shares built on their modest March-quarter gains during April, leading them to meaningfully outperform the overall market during the first four months of 2025. A recent Bank of America survey found that nearly half of Americans at least somewhat agree with the statement, “I am living paycheck to paycheck.” At the same time, shoppers are increasingly tightening their belts, looking to stretch their disposable spending dollars where they can as they brace for prolonged inflation pressures. Along with the pickup in layoffs found in the February and March Challenger Job Cuts reports and federal government cutbacks, consumers are likely to become even more cautious in their spending. That plays into Costco’s positioning rather nicely and we see that powering further share gains as Costo continues to expand its warehouse footprint and flex its digital commerce platforms. The next catalyst for Costco will be its April sales report on May 7 and its quarterly earnings report on May 29. As we move through the balance of 2025, Costco should realize the benefits of its 2024 membership fee increase as it continues to win consumer wallet share. In mid-April, Costco boosted its quarterly dividend to $1.30 per share from $1.16, and the first such payment will be made on May 16 to shareholders of record as of May 2.
1-Wk. Price Change: 3.2%; Yield: 0.5%
INVESTMENT THESIS: We like Costco's long-term prospects, driven by a club-based operating model that focuses on volumes, not margins, and therefore offers its customers a value proposition of everyday low prices. The strength of this model has created an incredibly loyal customer base with low churn and continued share gains in both bricks-and-mortar and e-commerce. This is a global concept, evidenced by the strength of sales both in the U.S. and abroad, which includes an emerging China opportunity. We see the company's membership model as a key differentiator vs. other retailers and its plans to open additional warehouse locations in the coming quarters should drive retail volumes and the higher-margin membership fee income as well. We also appreciate management's approach to capital returns and their willingness to return cash when it is in excess on the balance sheet.
Target Price: Reiterate $1,100. Rating: Two
Panic Point: Under revision
RISKS: Inability to pass through higher costs, fuel prices, weaker consumer, and membership churn.
Dutch Bros BROS; $61.10; 2,053 shares; 2.66%; Sector: Consumer Cyclical
UPDATE: Following their 18% move higher during the March quarter, shares of Dutch Bros BROS finished April down modestly. While we took some BROS chips off the table in mid-February at $84.50, we bought back some shares roughly a month later at $63.37. On March 27, the company held its latest Investor Day at which it laid out its long-term growth plan and contained some very supportive data points for the current quarter as well. As we explained in our Alert recapping the event, the management team did not deliver a formal guidance increase in a challenging market environment. However, what we did see both near and longer term keeps our bullish stance on the shares intact. Ahead of Dutch Bros reporting its quarterly results on May 7, which should show continued customer traction, pricing power, and its continued footprint expansion, Starbucks delivered March-quarter results that saw U.S. comps sales fall 2%. We attribute that to Starbucks rationalizing its menu and overhauling its U.S. operations, items that, per Starbucks management, are expected to take time to be fully implemented. Starbucks exited the March quarter with 17,122 locations, which suggests ample room for Dutch Bros to further grow its shop count as it continues to expand west to east. Exiting December that tally stood at 982 (670 company-operated and 312 franchise locations across 18 states). As we digest Dutch’s earnings report, we’ll update our price target and rating as required.
1-Wk. Price Change: -3.6%; Yield: 0.0%
INVESTMENT THESIS: Dutch Bros is an operator and franchisor of drive-thru shops that focus on serving high-quality, hand-crafted beverages with unparalleled speed and superior service. Coffee-based beverages make up ~50% of the menu mix, and ~25% of the menu mix is based upon the company’s proprietary Blue Rebel energy drink, which is highly customizable with flavors and modifiers and can be served blended or over ice. The energy platform helps unlock the afternoon daypart and broadens the company’s appeal. The remaining 25% of the menu mix is a wide variety of teas, lemonades, sodas, and smoothies. The company’s west-to-east expansion is a time-tested strategy that should drive revenue and EPS growth over the next several years. Leveraging that footprint expansion and low-single-digit comp sales growth, management reiterated its long-term guidance of around 20% annual revenue growth. Helping support that guidance, the company confirmed it will introduce an expanded food menu in 2026. Dutch Bros is slated to enter the consumer-packaged goods (CPG) space in a deal with Trilliant Food & Nutrition.
Target Price: Reiterate $85; Rating: Two
Panic Point: Under revision
RISKS: Commodity risks, labor costs, interest rate risk, inflation.
First Trust Nasdaq Cybersecurity ETF CIBR; $67.68; 2,188 shares; 3.14%; Sector: Cybersecurity
UPDATE: Each time we note ripped-from-the-headlines confirmation points for the portfolio and its underlying strategy, one constant is the signals for cybersecurity demand. Artificial intelligence will super-charge familiar threats in 2025, putting new wrinkles on old security challenges such as phishing, insider threats, and ransomware. Research firm Gartner expects that cybersecurity spending will increase 15% in 2025, from $183.9 billion to $212 billion. We continue to favor the diversified exposure CIBR brings to the portfolio, which complements the cybersecurity efforts at Elastic, Microsoft, and Alphabet. During April, CIBR shares gained ground, making them a positive contributor to the portfolio’s performance during the month. The shares have stiff resistance at the 50-day and 100-day moving averages near $65. A better entry point for new members and those underweight CIBR shares is near $62. As we move through the March-quarter earnings season and digest results and guidance from key holdings in this ETF, we’ll revisit our price target as needed.
1-Wk. Price Change: 3.6%; Yield: 0.0%
INVESTMENT THESIS: The First Trust Nasdaq Cybersecurity ETF seeks investment results that correspond generally to the price and yield (before the fund's fees and expenses) of an equity index called the Nasdaq CTA Cybersecurity Index. The Nasdaq CTA Cybersecurity Index is designed to track the performance of companies engaged in the cybersecurity segment of the technology and industrial sectors. It includes companies primarily involved in the building, implementation, and management of security protocols applied to private and public networks, computers, and mobile devices to protect the integrity of data and network operations. To be included in the index, a security must be listed on an index-eligible global stock exchange and classified as a cybersecurity company as determined by the Consumer Technology Association. Each security must have a worldwide market capitalization of $250 million, have a minimum three-month average daily dollar trading volume of $1 million, and have a minimum free float of 20%.
Target Price: Reiterate $72; Rating: Two
Panic Point: Under revision
RISKS: Cybersecurity spending, technology, and product development, the timing of product sales cycle, new products, and services in response to rapid technological changes and market developments as well as evolving security threats.
Labcorp Holdings Inc. LH; $247.66; 710 shares; 3.73%; Sector: Healthcare
UPDATE: Following their 1.5% gain during the March quarter, shares of Labcorp LH jumped higher following the company’s March-quarter earnings report leading them to close April up more than 3.5%. For Labcorp, the story remains one of an expanding array of diagnostic tests, testing relationships with medical offices and hospitals, and footprint expansion. While results can be lumpy quarter to quarter, we see Labcorp benefiting from those factors as well as the aging domestic population and the subsequent tailwind for medical testing. We saw that in the company’s earnings report this week, after which we reiterated our $265 price target. One of the key aspects of Labcorp is its multi-faceted growth strategies, which include nip-and-tuck acquisitions and expanding its testing capabilities. In March, Labcorp announced an agreement to acquire select assets of BioReference Health Oncology and related clinical testing services. This transaction will extend its oncology position. The company also completed the acquisition of select assets of North Mississippi Health Services, an ambulatory outreach laboratory business, and became a referral lab for its seven hospitals and clinical laboratories. After the quarter’s end, Labcorp introduced HPV and SDI Self-collection Options in Labcorp patient service centers and physician offices. More recently it launched its pTau Beta Amyloid Ratio Test, a new blood-based biomarker test to aid in the diagnosis of Alzheimer's disease, expanding its portfolio for Alzheimer's disease and dementia. We expect there will be some pricing pressure, but the gains coming from Invitae should help offset that, which allowed Labcorp to keep its EPS outlook for the year intact. Based on the duration of tariffs and potential trade deals, there could be some incremental EPS upside in H2 2025. Based on what develops, we’ll revisit our LH price target as needed.
1-Wk. Price Change: 8.5%; Yield: 1.2%
INVESTMENT THESIS: Labcorp is a global leader in innovative and comprehensive laboratory services that provides vital information to help doctors, hospitals, pharmaceutical companies, researchers, and patients make clear and confident decisions. By leveraging its diagnostics and drug development capabilities, the company provides insights and accelerates innovations to improve health and improve lives. The company is organized under two segments, consisting of Diagnostics Laboratories (Dx), which includes routine testing and specialty/esoteric testing, and Biopharma Laboratory Services (BLS), consisting of Early Development Research Laboratories and Central Laboratory Services. Our attraction to LH shares stems from the combination of the aging population driving diagnostic testing growth and the increasing array of diagnostic testing as well. That combination is expected to drive the healthcare testing services market to $12.6 billion by 2029, from $7.4 billion in 2024, according to Markets and Markets. To augment its position in oncology, women's health, autoimmune diseases, and neurology, the company has been expanding through acquisitions and partnerships with health systems and regional local labs.
Target Price: Reiterate $265; Rating: Two
Panic Point: Under revision
RISKS: Macroeconomic factors, changes in healthcare reimbursement models and products, government regulations, product discontinuations or recalls.
Meta Platforms META; $597.02; 248 shares; 3.14%; Sector: Communication Services
UPDATE: After declining modestly during the March quarter, Meta META shares followed the market lower in April. Following their bottoming in the first half of the month, we scooped up more shares for the portfolio at $555.17. In subsequent weeks, the company announced further strides in AI, but the company’s March-quarter earnings report on April 30 led the shares to move nicely higher. Meta reported quarterly earnings per share of $6.43, $1.20 better than the market consensus. Revenue climbed 16.1% year over year to $42.31 billion, outstripping the $41.34 billion consensus. One of our points about Meta is the improving margin profile as the company reaps the benefit of using AI to drive productivity and pricing. We saw that again in the March quarter as the operating margin clocked in at 41% compared to 38% in the year-ago quarter. Meta continued to grow its daily active user base, hitting 3.43 billion in March, up 6% year over year, but it also shared that one billion monthly active users are using Meta AI. That should bring the company an ample amount of data to train and refine its models, keeping its offering competitive. What we like about this is the learning that Meta gathers that it can apply to its advertising business, something we also see at Google. It stands to reason that as Meta improves its AI and more of the user base uses it, the sharper it will become in matching advertisers with targeted users. As that happens, we are likely to see further improvement in the average price per ad, which rose 10% year over year in the March quarter. Coming off the company’s earnings report, we reiterated our long-term price target of $725. Near-term, given some of the economic data pieces we received earlier this week and the potential impact of tariffs, we will want to track corporate discretionary spending, including advertising spend. Our thinking is that any such spending cuts are likely to lean more toward traditional media (radio, TV, print) than digital but we could see META shares bob and weave based on spending cut headlines. At just under 3% of the portfolio’s assets, we have some room to pick up more META shares, but odds are we will need to be opportunistic.
1-Wk. Price Change: 9.1%; Yield: 0.4%
INVESTMENT THESIS: Meta segments its business between Family of App Products, which includes Facebook, Instagram, Messenger, Threads, and WhatsApp, and Reality Labs Products, which includes its metaverse and investments and future product R&D. Family of Apps accounts for ~99% of company revenue and 100% of company operating profit. Substantially all of Meta’s revenue is currently generated from advertising on Facebook and Instagram. Family daily active people (DAP) was 3.43 billion on average for March 2024. Meta expects to spend $64 billion to $72 billion on capex in 2025, a significant increase year over year, with the majority of this spending focused on AI infrastructure and initiatives. Meta is positioned to benefit from the ongoing shift toward digital advertising and the adoption of AI across its product offerings. We recognize Meta is ramping up capital spending as part of the current AI arms race, but we see that as an investment that should drive productivity in its core advertising business. As the company harvests that investment, we could see a step up in margins much like we saw in 2023.
Target Price: Reiterate $725; Rating: Two
Panic Point: Under revision
RISKS: Ability to add and retain users and user engagement; marketing spend; new products or changes to existing ones; competitive risk, geopolitical risk.
Microsoft Corp. MSFT; $435.28; 425 shares; 3.92%; Sector: Technology
UPDATE: Following Microsoft’s MSFT consensus-topping March-quarter results, we reiterated our $480 price target. We can tie the upside surprise in the March quarter as well as the sequential improvement for the current one back to Microsoft’s Azure and other cloud services business. While Microsoft has exposure across multiple markets including PC, gaming, and others, results are increasingly driven more by its service segment (78% of sales, 65% gross margins) than its product segment (23% of sales, 78% gross margins). In recent quarters that business has been capacity-constrained, but as that has been addressed, we are seeing the expected re-acceleration emerge, one that Microsoft management telegraphed. That pushes back strongly on the concerns over the company’s AI competitive position, while the reiteration of its 2025 capital spending plans also put to rest other chatter that plagued the shares during April. When we stand back and look at Microsoft’s March quarter and its guidance, the message to walk away with is the strength in AI and cloud that permeates across multiple business lines and is still somewhat capacity-constrained, is strong enough to more than offset the near-term uncertainty in the company’s hardware business. The reaction we’re seeing in the shares is partly one of “better than feared” even as the market resets tariff-related expectations. Much like our thoughts on Meta, we should see Microsoft’s margins rebound as it moves from ramping up AI infrastructure to monetizing it. On the tariff front, we’ll wait and see what comes next, but we believe any announced tariff is likely to be less than the 145% Trump slapped on imports from China. But until that level is announced it’s going to remain a layer of uncertainty. With that in mind, we’ll focus on where Microsoft is likely to be 12 months from now, and we see it even better positioned as AI adoption across the enterprise continues. Catalysts that will drive MSFT shares toward our $480 stock price include further confirmation that Azure is monetizing Microsoft’s spending and driving margins higher, and clarity on tariffs.
1-Wk. Price Change: 11.1%; Yield: 0.8%
INVESTMENT THESIS: We believe the cloud to be a secular growth trend and that the upside to the shares will result from Microsoft's hybrid cloud leadership as the company grabs market share in this expanding industry. While companies may look to build out multi-cloud environments, Microsoft's Azure offering will be a prime choice thanks to its decision to provide the same "stack" used in the public cloud, to companies for their on-premises data centers. Additionally, we would note that hybrid environments are currently the preference for most companies because they allow them to maintain critical data in-house while taking advantage of the agility and scalability provided by public clouds. Outside of the cloud opportunity, we maintain a positive view on the company's growing gaming business, which we believe is becoming an increasingly prominent factor in the Microsoft growth story as gaming becomes more mainstream, management works to convert its gaming revenue from one-time license purchase to a recurring subscription model and as technologies like augmented/virtual reality evolve. Finally, as it relates to LinkedIn and other subscription-based services such as O365 and various Dynamics products, we continue to value them highly for their recurring revenue streams, which, we remind members, provide for greater transparency of future earnings.
Target Price: $480; Rating: Two
Panic Point: Under revision
RISKS: Slowdown in IT spending, competition, cannibalization of on-premises business by the cloud.
Palantir Technologies PLTR; $124.28; 822 shares; 2.16%; Sector: Financial Services
UPDATE: Shares of Palantir technologies PLTR were a strong performer for the Pro Portfolio in April. We’d remind members that following the selloff in PLTR shares from mid-February peak near $125, we added the name to the Bullpen in early March near $77. Shortly thereafter we graduated them to the portfolio near $79 with an initial price target of $87, sharing that for us, the fundamental reason for owning PLTR is to capture the benefits of the company’s expanding and diversifying customer base as well as AI adoption to drive productivity. Leading up to Palantir’s AIPCon 6 event, we added more shares to the portfolio near $83.50 and after the event, we boosted our price target to $95. In mid-April, we boosted our PLTR target to $105 from $95 following the company’s NATO program win. We boosted our target again this week to $125, ahead of Palantir’s quarterly earnings report on May 5, in part due to the company’s new collaboration with Google Cloud to bring FedStart platform to public sector customers. The target increase also had to do with the shrinking prospect of DOGE-related cuts and the potential for a larger than previously expected defense spending program. As we made that latest price target adjustment, we noted the strong run in PLTR shares has them knocking on overbought territory, suggesting expectations for its upcoming earnings report could be exuberant. The Pro Portfolio’s PLTR position is on the smaller side, and being the disciplined investors we are, we would be open to using any meaningful pullback in the stock to add to our holdings. With that in mind, we’ll keep close tabs on PLTR and key support levels and plot our next move following the company’s earnings report next week.
1-Wk. Price Change: 10.2%; Yield: 0.0%
INVESTMENT THESIS: Palantir Technologies specializes in big data analytics and builds software platforms that help organizations integrate, analyze, and make sense of vast amounts of data for both commercial and government clients. While much has been made about the company’s exposure to the federal government, its software is used across 90 industries and the larger global government sector accounted for 55% of revenue last year. The balance was from the commercial sector. While those percentages matched the ones for 2023, Palantir’s customer count jumped to 711 exiting 2024 from 497 at the end of 2023, nearly double compared to the end of 2023. For 2024, the average revenue across its top 20 customers was $64.6 million, up from $54.6 million in 2023 and $49.4 million in 2022. Commercial remaining deal value (RDV) stood at $1.79 billion exiting 2024, up 49% sequentially and 99% on a year-over-year basis. That equates to about 47% of the expected 2025 revenue. We will continue to monitor Palantir’s RDV and deferred revenue metrics, but in our view, key items to watch will be the continued diversification of its customer base across industries and increasing revenue per customer. Because we are still in the relatively early innings of AI adoption, we are inclined to be long-term owners of PLTR shares. Exiting 2024, Palantir had just over $935 million remaining under its current share repurchase program.
Target Price: $125; Rating Two
Panic Point: Under revision
RISKS: Economic and IT budget spending risk, technology risk, competition and competitive pressures, and customer acquisition risk.
VanEck Uranium and Nuclear ETF NLR; $81.63; 615 shares; 1.06%; Sector: Industrials
UPDATE: Over the last month, shares of the Uranium and Nuclear ETF NLR rebounded from their March selloff, rising more than 7%. Our rationale for owning the shares remains unchanged — to capture the growing interest in using nuclear power to help solve the data center and larger power demand problem. Today nuclear power provides ~10% of the world’s electricity and about 20% of Europe’s electricity. Per Goldman Sachs, power demand from data centers is on track to grow more than 160% by 2030, compared to 2023 levels. In the U.S. alone, big tech companies have signed new contracts for more than 10 GW of possible new nuclear capacity in the last year. From Texas to France and Germany to Japan, fresh plans for nuclear capacity are being put forth. We are inclined to be patient with NLR shares given the emerging energy pain point. We are also open to picking up additional ones should the right opportunity present itself, but we do not envision them becoming a significant position size for the portfolio.
1-Wk. Price Change: 4.7%; Yield: 0.0%
INVESTMENT THESIS: The VanEck Uranium and Nuclear ETF seeks to replicate as closely as possible, before fees and expenses, the price and yield performance of the MVIS Global Uranium & Nuclear Energy Index (MVNLRTR), which is intended to track the overall performance of companies involved in: (i) uranium mining or uranium mining projects; (ii) the construction, engineering, and maintenance of nuclear power facilities and nuclear reactors; (iii) the production of electricity from nuclear sources; or (iv) providing equipment, technology and/or services to the nuclear power industry. We see the companies captured in NLR helping address the energy paint point that will be created in part by the expected data center build-out. Figures from the International Energy Agency see a potential doubling of global data center electricity consumption by 2026, driven primarily by the rise of artificial intelligence (AI) applications, potentially reaching over 1,000 terawatt hours (TWh) from the current 460 TWh in 2022. In response, we’ve seen companies ranging from Blackstone to Microsoft and Meta announce plans to invest in nuclear power to help power its growing AI operations.
Target Price: $98; Rating: Two
Panic Point: Under revision
RISKS: Nuclear energy and energy market risks, currency and foreign exchange, political and economic.
Waste Management WM; $233.94; 620 shares; 3.07%; Sector: Industrials
UPDATE: In early March, we took advantage of the overbought status for Waste Management WM shares to lock in a slice of double-digit year-to-date gains, a move that helped lift the portfolio’s cash position. We maintained the balance of that position in April, which saw the shares drift modestly lower. Following the company’s March-quarter earnings report, which reaffirmed our investment thesis on the stock, we reiterated our $245 price target ahead of the company’s June 24 Investor Day. The core waste business accounts for 90% of the company’s revenue steam with the balance coming from the renamed WM Healthcare Solutions business, which houses the acquired Stericycle business. We view the sharp margin difference between the two segments as one of the opportunities for the Waste Management team, and at the upcoming Investor Day we look forward to more detailed integration plans and cost savings initiatives. That includes a granular look at achieving $250 million in annual run rate synergies by 2027. While WM has paused its buyback program, management shared on the earnings call that it continues to focus on identifying tuck-in acquisitions for the core waste business. The team expects to close on more than $500 million of solid waste acquisitions in 2025. Near-term, if WM shares found their way back to the $215 level we would be interested buyers at those levels.
1-Wk. Price Change: 2.5%; Yield: 1.4%
INVESTMENT THESIS: 2025 will see more nonresidential construction activity because of the Biden Infrastructure Law, but now we can finally factor in activity for the CHIPs Act, which saw its first award this week. Other potential drivers include spending associated with the Inflation Reduction Act, including the much-awaited start of building out a nationwide network of EV charging stations. Alongside that bright outlook for WM's commercial business, automation efforts and pricing power in its sticky residential business should drive margins and EPS generation higher in the coming quarters. We are in the early days of WM Healthcare Solutions, but we see the business growing as management integrates and cross-sells against its core business, and flexes the ability to integrate nip-and-tuck acquisitions like it has at the core waste business.
Target Price: $245; Rating: Two
Panic Point: Under revision
RISKS: Industry and economic risk, competition and competitive pressures, and acquisition risk.
Not Rated
ProShares Short QQQ ETF PSQ; $38.19; 1,430 shares; 1.16%
UPDATE: During April, the Pro Portfolio’s position in the ProShares Short QQQ ETF (QQQ) helped insulate it from the swings we saw in the market. We will continue to evaluate market dynamics and the rationale for continuing to own PSQ in the portfolio. Should President Trump deliver trade deals that lead to the reduction of Trump tariffs and those from other countries on U.S. goods that may give us sufficient reason to unwind the position. We will also continue to monitor EPS expectations for the S&P 500 as well as inflation data, recognizing the market may be overestimating the number of Fed rate cuts to be delivered by the Fed this year.
1-Wk. Price Change: -3.2%; Yield: 0.0%
INVESTMENT THESIS: ProShares Short QQQ ETF seeks daily investment results, before fees and expenses, that correspond to the inverse (-1x) of the daily performance of the Nasdaq 100 Index. The Nasdaq 100 Index includes 100 of the largest domestic and international non-financial companies listed on The Nasdaq Stock Market based on market capitalization. Given the tactical nature of this position, we do not expect to hold PSQ shares for the same length of time as we do the portfolio's long positions.
Target Price: N/A
Panic Point: N/A
RISKS: Because PSQ shares track the inverse of the Nasdaq 100 Index, PSQ shares will move lower when the Nasdaq 100 Index moves higher.
ProShares Short S&P500 ETF SH; $43.45; 1,250 shares; 1.15%
UPDATE: During April, the Pro Portfolio’s position in the ProShares Short S&P 500 ETF SH helped insulate it from the swings we saw in the market. We will continue to evaluate market dynamics and the rationale for continuing to own SH in the portfolio. Should President Trump deliver trade deals that lead to the reduction of Trump tariffs and those from other countries on U.S. goods that may give us sufficient reason to unwind the position. We will also continue to monitor EPS expectations for the S&P 500 as well as inflation data, recognizing the market may be overestimating the number of Fed rate cuts to be delivered by the Fed this year.
1-Wk. Price Change: -2.7%; Yield: 0.0%
INVESTMENT THESIS: ProShares Short S&P500 ETF seeks daily investment results, before fees and expenses, that correspond to the inverse (-1x) of the daily performance of the S&P 500. We are using SH shares to blunt market volatility and hedge the portfolio's performance against its benchmark, the S&P 500. Given the tactical nature of this position, we do not expect to hold SH shares for the same length of time as we do the portfolio's long positions.
Target Price: N/A
Panic Point: N/A
RISKS: Because SH shares track the inverse of the S&P 500, SH shares will move lower when the S&P 500 moves higher.
