Monthly Roundup: Starting 2025 Off Strong as Potential Tariffs Add Uncertainty
Next week’s economic data and earnings make it a big one for the market. We will take action as needed to protect the portfolio, but also be open to opportunities.
You've reached your free article limit
You've read 0 of 1 free Pro articles.
While at times it looked like a rollercoaster ride for the markets, all the major stock market barometers closed January in positive territory as did the TheStreet Pro Portfolio. Folks that follow the "January Effect" indicator should be pleased, but as we learned late this week, President Trump’s threatened tariffs on China, Canada, and Mexico are expected to take effect on Saturday, Feb. 1. So far, the market has been rather blazé about the potential tariffs, focusing more this week on questions over DeepSeek, the Fed’s as-expected policy meeting on Wednesday, and the current earnings season.
As of now, reporting suggests Trump will slap 25% tariffs on Mexico and Canada and a 10% levy on China as soon as Saturday, but we are also reading and hearing the White House is examining and contemplating deals that could either push off, dial back or limit the scope of those tariffs. As we have said many times about other things, the details will matter and that means we’ll be following developments closely over the weekend. As we dig into those details, we’ll contemplate the impact on particular sectors and drivers of the economy as well as corporate earnings.
As you are likely aware, our goal with the Pro Portfolio is to maximize its returns over the long term. Part of that is being mindful of potential pitfalls and the impact of changing landscapes, protecting the portfolio as needed. But as we’ve seen several times over the last year, at the right time opportunities will present themselves if we’re ready. We saw this in August, September, and November of last year, and arguably again earlier this week when DeepSeek-related headlines were causing chaos in the market. Times like those remind us of one of Warren Buffett’s less-famous quotes: "Fear is the most contagious disease you can imagine. It makes the virus look like a piker."
What we like to do is take advantage of situations when the herd is reacting in a “shoot first, ask questions later” way, pressuring not only stocks that should be but ones that shouldn’t. When we see situations like that arise, it’s a far more famous Buffett quote that populates our frontal lobes: “Be fearful when others are greedy and be greedy when others are fearful.”
We know next week’s economic data and earnings would make it a big one for the market. Adding potential weekend developments on tariffs means we could start February trading running even faster out of the starting blocks. But let’s not get ahead of ourselves until we have more details to work with so we can more accurately assess the impact.
What this means is we will have a very early start on Monday as we guide you and the Pro Portfolio through what’s to come next.
Catching Up on the Portfolio This Week
Despite the weak finish to the month, as we discussed above, January was a positive one for the markets. It was also a very good one for the portfolio as it started off the new year the same way it finished 2024 — nicely ahead of the S&P 500. That outperformance reflected strong double-digit moves in Dutch Bros BROS, Meta META, Applied Materials AMAT, Morgan Stanley MS, and Qualcomm QCOM as well as high-single-digit gains across several other holdings. Laggards during the month were Nvidia NVDA, Microsoft MSFT, and Apple AAPL, while a post-earnings retreat in ServiceNow NOW and Lockheed Martin LMT shares added to those headwinds late in January.
Recapping the portfolio’s January moves, we started the new year picking up more shares of ServiceNow and soon followed that by locking in big gains when we trimmed the portfolio’s positions in Nvidia near $145 and Marvell MRVL near $116 following Nvidia CEO Jensen Huang’s 2025 CES address. On the heels of the stronger-than-expected December Employment Report and what we saw in December inflation indications and the rollover in new mortgage contracts, we opted to pull the plug on Four-rated Builders FirstSource BLDR.
Mid-January we added to positions in American Express AXP, Universal Display OLED, and United Rentals URI and scooped up additional shares of ServiceNow. Later in the month, we purchased more shares of Trade Desk TTD following the thesis-confirming earnings report from Netflix. This week, we used the market disruption caused by DeepSeek-related headlines to add back NVDA and MRVL shares at lower prices compared to where we sold them earlier in the month. Alongside that trade, we also bought more Eaton ETN shares and initiated a new position in the VanEck Uranium and Nuclear ETF NLR.
Our final actions in January were to take advantage of the more than 50% moves in Amazon AMZN and Morgan Stanley shares and the more than 30% move in Mastercard MA shares over the last several months. That allowed us to lock in a slice of those gains, a move that contributed to the portfolio’s cash position.
With a slew of economic data coming next week and another few weeks of earnings to come, we’ll continue to look for opportunities to both monetize some of the portfolio’s positions when and where it makes sense as well as put some capital to work at better prices.
This Week's Portfolio Videos
We cover a lot of ground during the week in our Daily Rundowns. If you happened to miss one or more of them, here are some helpful links:
Monday, January 27: As DeepSeek Rattles AI Expectations and Nvidia, Here’s What We’re Watching
Tuesday, January 28: Upcoming Earnings Reports Will Impact These Five Holdings
Wednesday, January 29: Here Are the Next Earnings Reports That Can Impact Our Holdings
Friday, January 31: Why We Rang the Register on Shares of This Holding
Key Global Economic Readings
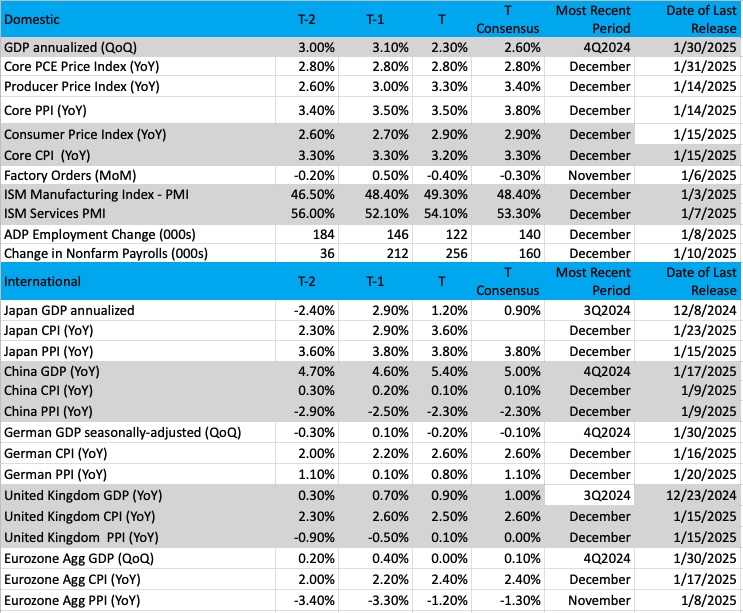
(Note: T is the most recent period, T-1 is the prior period's reading and T-2 is two periods back, the intent being to illustrate any trends)
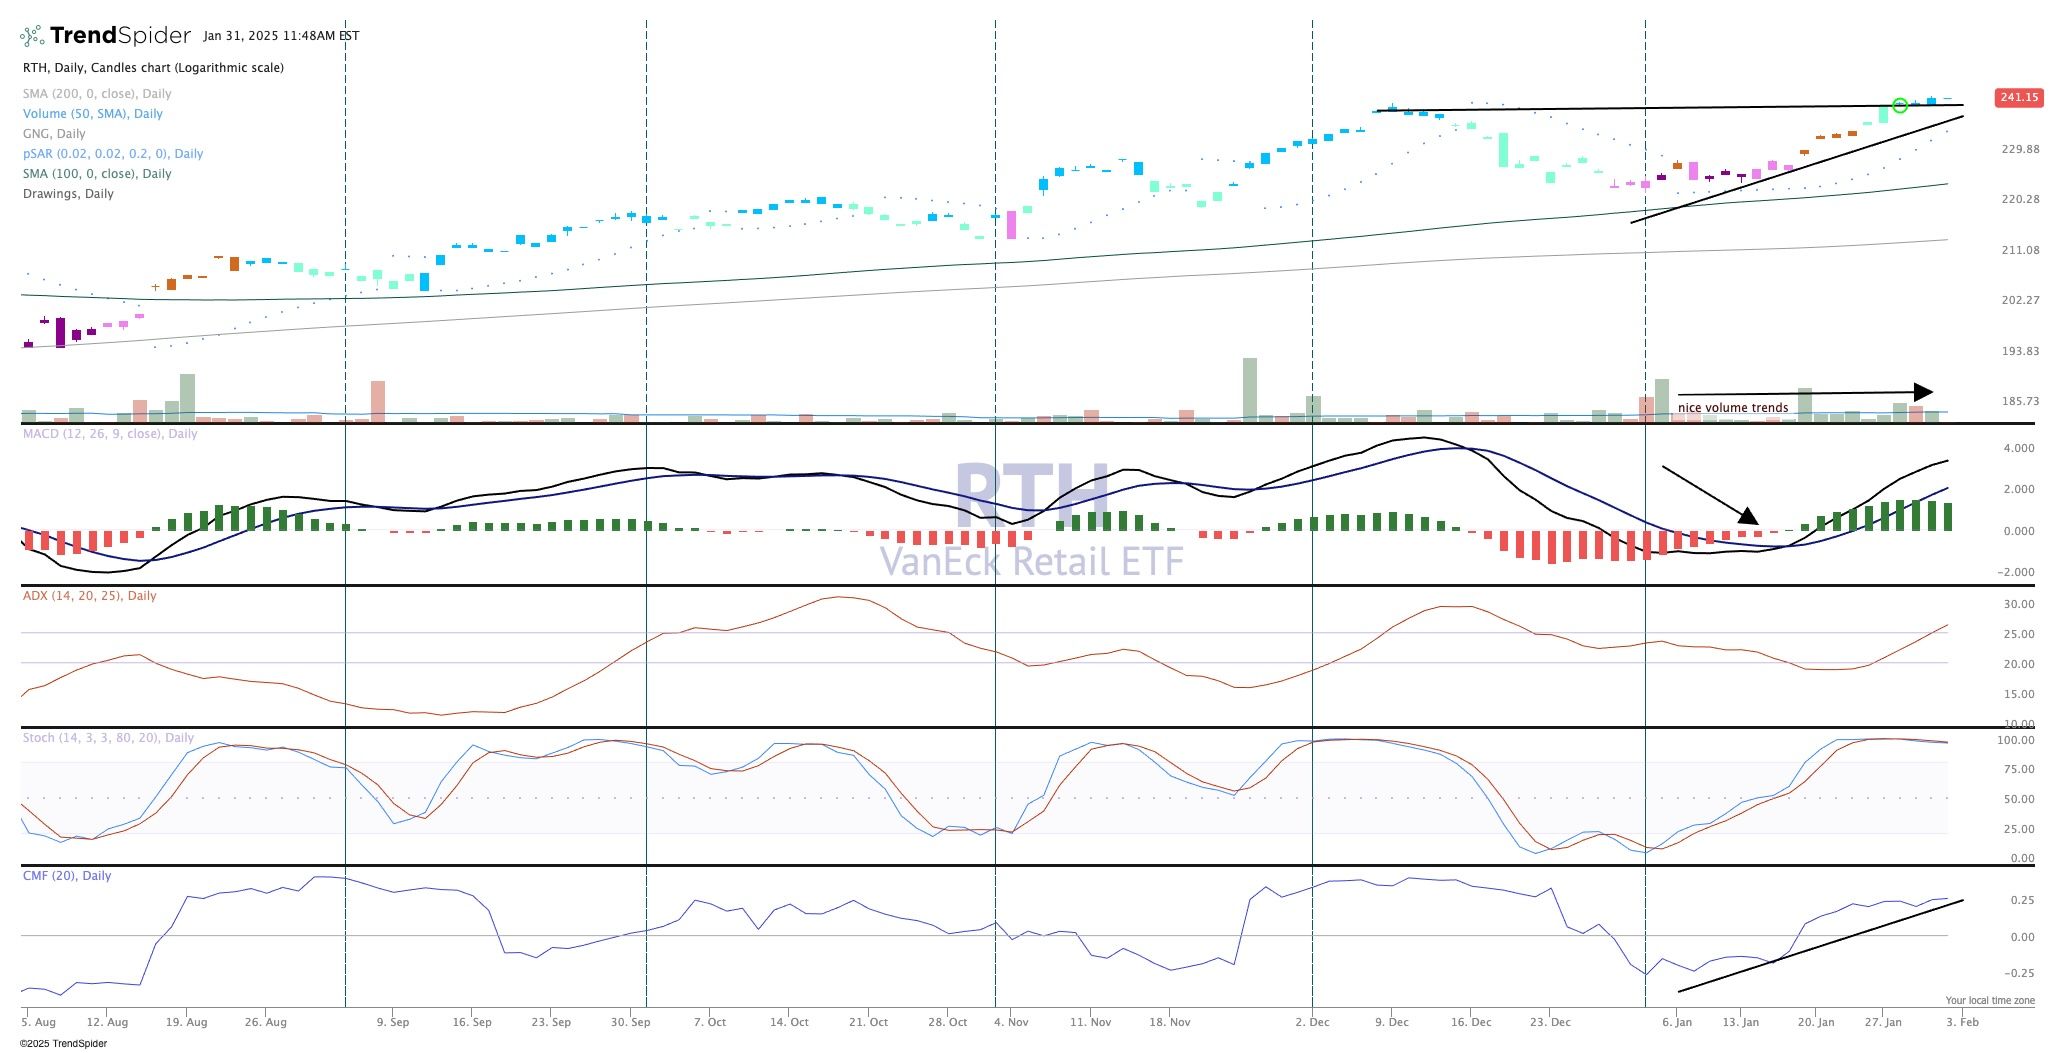
Chart of the Week: The VanEck Retail ETF (RTH)
At this point in the current earnings season, we like to take a deep dive into retail names. This group is going to be reporting numbers very soon, with a large contingent will be on display starting next week. None other than the big name, Amazon, will be delivering numbers for the holiday quarter. This stock is by far the heaviest weighting of the VanEck Retail ETF RTH, and as such moves the ETF around the most. It works much like the Mag 7 names for other broad indexes like the S&P 500, influencing the price as buyers/sellers step up to buy the RTH.
The biggest holdings of the RTH include Walmart, Costco, Lowe's, Target, and Home Depot HD along with the aforementioned Amazon. So why buy an ETF rather than a smattering of stocks? It’s a good question, and of course, the answer is diversification. That is the only free lunch on Wall Street (Nobel Prize laureate Harry Markowitz).
The RTH provides a great deal of diversification within a concentrated sector. We can get away from a bias towards/against retail by simply adding the RTH with the awareness of many names that might be correlated together. The more correlation stocks have to each other the better chance they move in unison. Think about semiconductor companies, homebuilders, or restaurant names. Ubiquitous businesses that are very similar and tend to move together.
The RTH provides a nice level of diversification which alleviates risk in the entire group. The chart also shows positive qualities, with a series of higher highs, and higher lows which is our textbook definition of an uptrend.
Notice the MACD (moving average convergence/divergence) is already on a buy signal, the money flow is strong, and the parabolic SAR (stop and reverse) in the top pane has been bullish for a month. New highs recently continue to push upward, and we could see this ETF reach $250 in short order. But watch Amazon next week then Walmart/Target in February. They will be pacing the RTH into the spring and beyond.
Other charts we shared with you this week were:
Monday, January 27: S&P 500 - Indexes Make a Run at New Highs
Monday, January 27: Vulcan Materials (VMC) - A Look at the Newest Portfolio Position
Tuesday, January 28: VanEck Uranium and Nuclear ETF (NLR) - A Look at the Newest Portfolio Position
Wednesday, January 29: Broadcom (AVGO) - Broadcom's AI Slide Might Be an Opportunity
Thursday, January 30: Eaton Corp. (ETN) - This Holding Was Slammed. How's It Looking Now?
The Week Ahead
We switch gears a bit next week as we enter the second trading month of 2024 with a more balanced flow of economic data and corporate earnings. With the Fed’s January policy meeting behind us, we will also see the return of several Fed speakers next week. Eyes will also be on Washington over the weekend as incremental Trump tariffs loom on Mexico, Canada, and China. Based on what we learn about these potential tariffs — which countries, when they begin, what goods they are placed on, what their size is, and so on — we will adjust the portfolio as needed.
In terms of the known economic data points being published next week, it’s the usual cast of start-of-the-month characters: Manufacturing and Services PMI reports and those for job creation and wage gains. Based on S&P Global’s Flash January PMI, we should expect winter weather to have clipped the speed of the economy, but new order growth and hiring should remain robust as should hiring. If that’s what the data show, it will likely fall into the camp of "good news for the economy is bad news for future rate cuts."
The icing on that cake will be what next week’s data, including the January reading for the FAO Food Price Index, show for inflation. Referring again back to S&P’s January Flash PMI findings, it reported:
Inflationary pressures meanwhile intensified in January. Both input costs and average selling prices rose at the fastest rates for four months, the rate of inflation of the latter now having increased for two successive months… Higher costs were passed on to customers, with average prices charged for services rising at the fastest rate since last September. An even larger rise was reported for goods, the rate of inflation of which hit a ten-month high.
If next week’s findings support that view, odds are we’re going to see rate cut expectations for the 1-2 cuts expected by the market get pushed out to H2 2025. If history holds, that will weigh on interest-sensitive sectors, including housing. As we look to gauge the market’s reaction, we’ll be looking at changes captured by the CME FedWatch Tool, but also 10-year Treasury yields and the dollar.
Here's a closer look at the economic data coming at us next week:
U.S.
Monday, February 3
· S&P Global Final Manufacturing PMI – January (9:45 AM ET)
· ISM Manufacturing PMI – January (10:00 AM ET)
· Construction Spending – December (10:00 AM ET)
Tuesday, February 4
· Factory Orders – December (10:00 AM ET)
· JOLTS Job Openings & Quits – December (10:00 AM ET)
Wednesday, February 5
· MBA Mortgage Applications Index – Weekly (7:00 AM ET)
· ADP Employment Report – January (8:15 AM ET)
· S&P Global Final Services PMI – January (9:45 AM ET)
· ISM Services PMI – January (10:00 AM ET)
· EIA Crude Oil Inventories – Weekly (10:30 AM ET)
Thursday, February 6
· Challenger Job Cuts Report – January (7:30 AM ET)
· Initial & Continuing Jobless Claims – Weekly (8:30 AM ET)
· Productivity & Unit Labor Cost (Prelim) – Q4 2024
· EIA Natural Gas Inventories – Weekly (10:30 AM ET)
Friday, February 7
· FAO Food Price Index – January (4 AM ET)
· Employment Report – January (8:30 AM ET)
· University of Michigan Consumer Sentiment Index (Prelim) – February
· Consumer Credit – December (3 PM ET)
International
Monday, February 3
· Japan: Jibun Bank Manufacturing PMI – January
· China: Caixin Manufacturing PMI – January
· Eurozone: HCOB Manufacturing PMI – January
· UK: S&P Global Manufacturing PMI – January
· Eurozone: Flash Inflation Rate - January
Wednesday, February 5
· Japan: Jibun Bank Services PMI – January
· China: Caixin Services PMI – January
· Eurozone: HCOB Services PMI – January
· UK: S&P Global Services PMI – January
· Eurozone: Producer Price Index - December
Thursday, February 6
· Eurozone: Retail Sales – December
· UK: Bank of England Monetary Policy Decision
Friday, February 6
· Germany: Industrial Production – December
With 131 S&P 500 companies reporting next week, that means by the time it ends ~62% of the S&P 500 will have reported their December-quarter results. Normally, that would start to give us a good sense of EPS prospects for the first half of 2025 and a preliminary read on those for full-year 2025. However, over the weekend, we will move past Feb. 1, the day President Trump alluded to as the potential start date for a new round of tariffs. What we learn in the coming days could influence not only EPS expectations for the current quarter but also the balance of the year. That gives us another batch of things to listen to as the current earnings season and our data collection efforts continue.
Looking at the companies set to report next week, four of the portfolio’s constituents are on deck — Alphabet GOOGL, Qualcomm QCOM, Labcorp LH, and Amazon AMZN — and we’ll be reviewing their price targets as warranted. We will also be interested in end-market comments from NXP Semiconductor (NXPI), comments on food prices from Tyson Foods (TSN), Chipotle (CMG), Hershey (HSY), Yum! Brands (YUM), and Mondelez (MDLZ).
Comments about California rebuilding and ongoing infrastructure spending will be top of mind when we dig into comments from CNH Industrial (CNJI), Terex (TEX), and Construction Partners (ROAD). Those companies could also give us some insight into data center construction activity and other megaprojects we discussed as part of Eaton’s December-quarter earnings this week. We’ll combine those learnings with ones from Cummins (CMI), Lumen Technologies (LUMN), Juniper (JNPR), and Lumentum (LITE). Rounding out our tech reading will be quarterly results from Skyworks Solutions (SWKS), Synaptics (SYNA), and InterDigital (IDCC).
Here's a closer look at the earnings reports coming at us next week:
Monday, February 3
· Open: Tyson Foods (TSN)
· Close: Clorox (CLX), NXP Semiconductors (NXPI), Palantir (PLTR), Rambus (RMBS)
Tuesday, February 4
· Open: CNH Industrial (CNHI), Cummins (CMI), Estee Lauder (EL), Ferrari (RACE), Jacobs Solutions (J), Merk (MRK), PayPal (PYPL)
· Close: Alphabet (GOOGL), Chipotle (CMG), Juniper Networks (JNPR), Kulicke & Soffa (KLIC), Lumen Technologies (LUMN), Mondelez (MDLZ), Snap (SNAP)
Wednesday, February 5
· Open: Capri Holdings (CPRI), Emerson (EMR), Stanley Black & Decker (SWK), Sunrise Realty (SUNS), Uber (UBER), Walt Disney (DIS), Yum! Brands (YUM)
· Close: Cognizant (CTSH), Ford (F), Hologic (HOLX), MicroStrategy (MSTER), Omega Health (OH), Skyworks (SWKS),
Thursday, February 6
· Open: Canada Goose (GOOS), Equifax (EFX), Hershey (HSY), Hilton (HLT), Honeywell (HON), Interdigital (IDCC), Labcorp (LH), Ralph Lauren (RL), Terex (TEX), Yum China (YUMC)
· Close: Affirm (AFRM), Amazon (AMZN), Cloudflare (NET), Expedia (EXPO), Fortinet (FTNT), Lumentum (LITE), Pinterest (PINS), Qualcomm (QCOM), Synaptics (SYNA), Take-Two (TTWO)
Friday, February 7
· Open: Construction Partners (ROAD).
Portfolio Investor Resource Guide
· Economic Data: Here's a List of Links to the Key Economic Data We Closely Watch
· Investing Terminology: 16 Key Terms Club Members Should Know
· 10-Ks: Want to Know About a Stock? Read the Company's Reports
· 10-Qs: Unlock the Numbers and Key Information Behind Your Stock With the 10-Q
· Income Statement: Our Cheat Sheet to Understanding This Financial Document
· Balance Sheet, Cash Flow Statements, and Dividends: How to Know If a Company Is Off-Kilter? Read Its Balance Sheet
· Valuation Metrics: Everyone Wants a Value. Here's How Investors Can Find
· Thematic Investing 101 Webinar
The Portfolio Ratings System
1 - Buy Now (BN): Stocks that look compelling to buy right now.
2 - Stockpile (SP): Positions we would add to on pullbacks or a successful test of technical support levels.
3 - Holding Pattern (HP): Stocks we are holding as we wait for a fresh catalyst to make our next move.
4 - Sell (S): Positions we intend to exit.
ONES
Alphabet GOOGL; $204.02; 1,035 shares; 4.10%; Sector: Communication Services
UPDATE: Shares of Alphabet (GOOGL) experienced a choppy ride in January but one that ultimately left the shares nicely higher. When the company reports next week, we’ll be interested in how it addresses some additional search engine share loss during the December quarter and plans to reverse that trajectory. Make no mistake, Google is still far and away the search market share leader, but we are noticing some shift toward AI tools and apps. This means we will also be listening closely for comments about Gemini and Google’s other AI initiatives. Following Netflix’s comments about digital advertising and YouTube’s strong position in video streaming, we suspect it will be a bright star in next week’s earnings report. With Google Cloud, we will be looking to see if the business was a market share gainer by matching its revenue up against those for Microsoft and eventually Amazon. We will also be looking for further operating margin improvement from Cloud compared to the 17% figure posted in the September quarter. Given share price levels in October and again in late November, we would not be surprised to find Alphabet tapped the $59.7 billion left under its share repurchase authorization exiting the September quarter. We continue to see the company well positioned for AI adoption, given its treasure trove of data across its search, advertising, and YouTube businesses, which should benefit it in the coming months with an upswing in digital advertising. As AI matures, we see that resulting in further lift to Google Cloud’s revenue and profit generation. We’ll continue to evaluate our price target and rating as necessary. We’ll also be watching developments on the FTC front and what that could mean for Alphabet in the coming quarters. Should TikTok be banned in the U.S. that would be a positive for YouTube’s Shorts products and related monetization efforts. Alphabet will report its quarterly results on Tuesday, February 4 at which time we will either revisit our price target or the current investment rating.
1-Wk. Price Change: 1.9%; Yield: 0.39%
INVESTMENT THESIS: We believe that while search and digital ad dominance are what will carry shares in the near- to mid-term, longer-term it is the company's artificial intelligence "moat" that will provide for new avenues of growth. AI is what has made the company's search, video, and targeted ad capabilities best-in-class and is the driving force behind the company's success in voice (Google Home) and autonomous driving (Waymo). Furthermore, we believe it is this AI expertise that will also make the company more prevalent in other industries, including healthcare via its subsidiary Verily, as AI and machine learning continue to disrupt operations across industries. Adding to our positive view of the company's future opportunities, we believe that Alphabet's free cash flow generation and solid balance sheet set it apart and are what will allow the company to continue taking chances on far-out ground-breaking and potentially world-changing projects. The company is also preparing to roll out Gemini Subscription with enterprise plans for workspace, according to a report. All good news for Alphabet.
Target Price: Reiterate $210; Rating: One
Panic Point: $167
RISKS: Regulatory risk (data privacy), competition, and macroeconomic slowdown impacting consumers and therefore ad buyer activity.
Amazon AMZN; $237.68; 861 shares; 3.97%; Sector: Consumer Discretionary
UPDATE: Amazon shares have been a solid contributor to the portfolio with their January mid-single-digit increase. As the shares continued to climb late this month, we opted to take advantage of the more than 50% gain since early August to ring the register and lock in some of those outsized gains. Following the trade, the portfolio continues to have meaningful exposure to AMZN so we can capture further upside ahead. Comments shared so far in the December-quarter earnings season point to consumers' spending but remaining selective and embracing digital shopping to stretch their spending dollars. Recent signs that inflation pressures persist point to that continuing. Ongoing enterprise adoption of AI and data center bodes well for Amazon Web Services when Amazon reports its quarterly results next week. In that report, we’ll be interested to see the payoff in the company’s advertising services line item for its decision to bring advertising to Prime Video. As we parse that upcoming earnings report, we will be looking to see further benefits of cost containment efforts in Amazon’s margins and its bottom line. With clear signs the AI arms race is heating up, we could see Amazon deliver a higher-than-expected 2025 capital spending budget, but we’ll balance that against what we see with its margins for the December quarter and prospects for the coming year. Based on what we learn next week, we’ll look to adjust our AMZN price target as warranted. Because AMZN is one of the largest position sizes in the portfolio, we’re not inclined to add more shares. However, for members that are light on AMZN, support near $207 offers a potential pick-up point. Earlier this month, Scotiabank upped its AMZN target to $306 from $246, BMO Capital lifted its to $265 from $236, and Morgan Stanley named the shares a “Top Pick,” lifting its target to $280.
1-Wk. Price Change: 1.21%; Yield: 0.0%
INVESTMENT THESIS: We believe the upside will result from Amazon's continued eCommerce dominance, AWS's continued leadership in the public cloud space, and ongoing growth of the company's advertising revenue stream, which feeds off Amazon's eCommerce business. Additionally, we think profitability will continue to improve as AWS and advertising account for a larger portion of total sales as both these segments sport higher margins than the eCommerce operation. While we believe the increasing share of the revenue from these higher margin businesses will be key to driving profitability longer-term, we think margins on eCommerce stand to improve as the company's infrastructure is further built out and economies of scale further kick in. The embedded call option is that management is always looking to enter a new space and generate new revenue streams.
Target Price: Reiterate $260; Rating: One
Panic Point: $190
RISKS: High valuation exposes the stock to volatile swings, eCommerce has exposure to slower consumer spending and competition, management is not afraid to invest heavily, potential headwinds resulting from new eCommerce regulation in India, and management is not scared to invest aggressively for growth, which can at times cause volatile reactions as near-term concerns arise relating to the impact on margins.
Bank of America Corp. BAC; $46.30; 4,410 shares; 3.97%; Sector: Financial Services
UPDATE: After giving back some of their November gains in December, Bank of America shares rebounded in January, climbing more than 5%. Following the company’s better-than-expected December-quarter results, we maintained our $53 price target. The outlook for investment banking remains favorable, and expected net interest income growth of 6% to 7% this year reflecting, a 2% to 3% GDP economy, points to further upside ahead in the shares. To the extent management can create even more operating leverage in the coming quarters compared to the last two and investment banking activity surprises to the upside, there could be an upside to our $53 target. Goldman Sachs CEO David Solomon called for a pick-up in both equity capital raising and M&A activity under the Trump administration. The market is cautiously optimistic heading into 2025 about the IPO market strengthening given further rate cuts, deregulation, and a stable macroeconomic environment. There is also a health backlog of offerings, including high-profile companies like CoreWeave, Medline Industries, and Genesys Cloud Services. Barring those signs appearing, when BAC shares move past $48, we may need to revisit our One rating. But if market forces pull BAC back near $44 that could be a nice place to add some additional shares. During January, Truist lifted its BAC target to $53, while Morgan Stanley bumped its to $56.
1-Wk. Price Change: -0.47%; Yield: 2.25%
INVESTMENT THESIS: Bank of America is one of the world's leading financial institutions, serving individual consumers, small and middle-market businesses, and large corporations with a full range of banking, investing, asset management, and other financial and risk management products and services. The company provides unmatched convenience in the United States, serving approximately 67 million consumer and small business clients with approximately 3,900 retail financial centers, approximately 16,000 ATMs, and award-winning digital banking with approximately 56 million verified digital users. Bank of America is a global leader in wealth management, corporate and investment banking, and trading across a broad range of asset classes, serving corporations, governments, institutions, and individuals around the world. Bank of America offers industry-leading support to approximately 3 million small business households through a suite of innovative, easy-to-use online products and services. The company serves clients through operations across the United States, its territories, and approximately 35 countries. From a reporting perspective, the company's business breaks down as follows: Net Interest Income breakdown: Consumer Banking 57%, Global Banking 23%, Global Wealth & Investment Management 14%, and Global Markets 6%; Income Before Tax breakdown: Consumer Banking 42%, Global Banking 27%, Global Wealth & Investment Management 16%, and Global Markets 15%. Bank of America pays a quarterly dividend of $0.22 per share.
Target Price: $53; Rating: One
Panic Point: $39
RISKS: Financial markets, fiscal, monetary, and regulatory policies, economic conditions, and credit ratings.
Elastic N.V. ESTC; $112.58; 1,712 shares; 3.74%; Sector: Consumer Cyclical
UPDATE: Elastic shares continued to give back some of their November gains in early January, but they rebounded nicely later in the month making them a net positive for the portfolio. Throughout January we have received a growing number of company comments and other signals pointing to AI adoption across an expanding array of industries, which bodes well for Elastic. Quarterly results this week from ServiceNow, including its AI comments and jump in deferred revenue point to accelerating AI adoption in the enterprise. That meshes with findings in early January that enterprise leaders intend to spend a larger portion of IT budgets on AI this year. We suspect Elastic’s management’s operating margin outlook is conservative even though it reflects ongoing investments in AI to drive future growth. Morgan Stanley backed that view when it initiated coverage on Elastic shares in December with an "Overweight" rating" and a $130 price target. We have room to add back some shares and see nice support for the shares near the $99 support level, if we opt to do so. During January, Scotiabank reiterated its "Outperform" rating on ESTC but lowered its price target to $127 from $135, while Truist called out the company as a potential takeout candidate.
1-Wk. Price Change: 7.88%; Yield: 0.0%
INVESTMENT THESIS: As digital transformation drives mission-critical business functions to the cloud, Elastic N.V. brings the portfolio exposure to search AI adoption across IT and enterprise business lines as companies look to drive productivity. Elastic bills itself as the Search AI company and its Elastic Search AI Platform as a hosted, managed service across major cloud providers, including Amazon Web Services (AWS), Google Cloud, and Microsoft’s Azure in more than 55 public cloud regions globally. Customers can also deploy Elastic’s platform across hybrid clouds, public or private clouds, and multi-cloud environments. What we like even more about this is Elastic’s subscription-based business model, which accounts for just over 93% of its total revenue stream. As we’ve discussed before with other companies, this affords not only good visibility but also predictable cash flow and earnings. Moreover, the gross margins associated with the subscription business are above 80%, which helps explain the rising margin profile and EPS as that business has come to account for a greater percentage of overall revenue. When it comes to potential risks, one sign that would lead us to reconsider owning the shares would be if either Elastic’s customer count or its subscription revenue per customer stalled. Another item we’ll be watching because of Elastic’s geographic mix, with 40% of its revenue outside of the U.S., is the dollar and its corresponding foreign exchange impact.
Target Price: Reiterate $135; Rating: One
Panic Point: $85
RISKS: Enterprise software spending, AI adoption, competitive dynamics, foreign exchange risk.
Lockheed Martin Corp. LMT; $462.95; 388 shares; 3.49%; Sector: Aerospace & Defense
UPDATE: Headline concerns over the potential impact of the Department of Government Efficiency (DOGE) weighed on Lockheed Martin (LMT) shares toward the end of 2024. However, the company notched more than $1 billion in fresh program wins during January, adding to its record backlog of $176 billion exiting 2024. Following the company’s December-quarter earnings report that largely topped expectations and pointed to ramping demand as well as deliveries for the F-35, we trimmed our price target to $575 from $650 to reflect 2025 pension payments and higher interest expenses that will result in slower EPS gains despite stronger revenue and operating profit prospects. While some members may be frustrated with the position, the upcoming US F-35 lot passage this year as well as international demand for the F-35 and other Lockheed products points to further backlog improvement in the coming quarters. We see that translating into revenue and cash flow generation, and rising profit dollars. We expect to see EPS figures and other price targets adjusted lower and that could bring some additional pressure on LMT shares in the coming days. However, once that has washed over the shares, we suspect we will see the return of more value-oriented investors. At that point, the combined pullback may present a nice opportunity for new members or those whose LMT exposure is less than the portfolio’s. We will be mindful of potential hiccups on the horizon. The current continuing resolution funds U.S. government operations through March, and that means defense spending could become a hot button issue as both sides of the aisle look to hammer out a fresh funding deal. While our thought is that Trump recognizes a strong military is an effective deterrent, efforts to cut costs and streamline procurement processes could result in headline-related volatility.
1-Wk. Price Change: -6.84%; Yield: 2.85%
INVESTMENT THESIS: Lockheed Martin is the largest defense contractor globally and has dominated the Western market for high-end fighter aircraft since the F-35 program was awarded in 2001. Lockheed's largest segment is aeronautics, which is dominated by the massive F-35 program. Lockheed's remaining segments are rotary and mission systems, which is mainly the Sikorsky helicopter business; missiles and fire control, which creates missiles and missile defense systems; and space systems, which produces satellites and receives equity income from the United Launch Alliance joint venture. Historically, the stability of defense spending has been a haven during periods of economic uncertainty, and we see that repeating once again even as geopolitical conflicts are likely to lead to incremental demand for Lockheed's products. The company has increased its dividend consistently over the last 19 years and is widely expected to boost it again in the coming days. In October 2022, Lockheed announced its board authorized the purchase of up to an additional $14.0 billion of LMT stock under its share-repurchase program.
Target Price: $575; Rating: One
Panic Point: $445
RISKS: Contracts and budget risk with the U.S. government and the Department of Defense, F-35 program funding and renewal, competition, and subcontractor issues.
Nvidia Corp. NVDA; $120.07; 1,535 shares; 3.58%; Sector: Technology
UPDATE: Nvidia has been bearing the brunt of punishment lately as it relates to AI, chips, regulation, and other issues. That includes recent headlines over DeepSeek, but it has since been reported that model has poor accuracy levels at just 17% per an audit from NewGuard. We used the dip this week to add more shares at a discount, recovering shares from an earlier sell at near-record highs on NVDA in early January. This week both Microsoft and Meta reaffirmed robust capital spending plans and with signs confirming the AI arms race is alive and well, we suspect Amazon and Alphabet will offer similar guidance when they report next week. Looking at the NVDA chart, it is not in horrible shape, but hovering around the 200-day moving average is not what the big institutions want to see. The chart shows NVDA struggling here to find buyers, and with a huge gap in the chart to the upside, lower highs, and lower lows there is a good argument this stock may be headed towards the September lows. That would be about 17% lower than current levels and bring about full-fledged panic from the markets. The company reports earnings in late February but as we mentioned above, we will get capital spending comments from Amazon and Alphabet next week and January revenue reports from Taiwan Semiconductor and Foxconn shortly thereafter. Our position has been that we are seeing an AI arms race unfold as companies and other institutions adopt AI and that will continue to drive capacity demands for AI and data center chips, benefitting our positions in Nvidia and Marvell. Comments from Microsoft, ServiceNow, and others confirm that adoption is occurring, and that keeps us bullish on NVDA shares.
1-Wk. Price Change: -15.81%; Yield: 0.03%
INVESTMENT THESIS: Nvidia is well positioned to benefit from ramping AI and data center spending. The company pioneered accelerated computing to help solve the most challenging computational problems. Nvidia is now a full-stack computing infrastructure company with data-center-scale offerings that are reshaping the industry. The company's full stack includes the foundational CUDA programming model that runs on all Nvidia GPUs, as well as hundreds of domain-specific software libraries, software development kits, or SDKs, and Application Programming Interfaces, or APIs. This deep and broad software stack accelerates the performance and eases the deployment of Nvidia accelerated computing for computationally intensive workloads such as artificial intelligence, or AI, model training and inference, data analytics, scientific computing, and 3D graphics, with vertical-specific optimizations to address industries ranging from healthcare and telecom to automotive and manufacturing. Nvidia reports in two business segments: Compute & Networking and Graphics. The Compute & Networking segment (78% of revenue, 85% of operating income) is comprised of Data Center accelerated computing platforms and end-to-end networking platforms, including Quantum for InfiniBand and Spectrum for Ethernet; NVIDIA DRIVE automated-driving platform and automotive development agreements; Jetson robotics and other embedded platforms; Nvidia AI Enterprise and other software; and DGX Cloud software and services. The Graphics segment (22% of revenue, 15% of operating income) includes GeForce GPUs for gaming and PCs, the GeForce NOW game streaming service and related infrastructure; Quadro/NVIDIA RTX GPUs for enterprise workstation graphics; virtual GPU, or vGPU, software for cloud-based visual and virtual computing; automotive platforms for infotainment systems; and Omniverse Enterprise software for building and operating metaverse and 3D internet applications.
Target Price: $175; Rating One
Panic Point: $101
RISKS: Market and interest rate risk, credit risk, country risk, and operational risk, including cybersecurity.
Qualcomm Inc. QCOM; $172.93; 1,200 shares; 4.03%; Sector: Technology
UPDATE: After being a drag on the portfolio in late December, shares of Qualcomm (QCOM) rebounded in January, climbing just shy of 15% in the process. We attribute that rebound to the less-than-feared showing of the smartphone market in the December quarter and increasingly favorable comments for that market and the AI PC one in 2025. Smartphone shipments in the December quarter per data from IDC rose nicely in Q4 2024, especially with Qualcomm customer Apple, which benefited from a solid upgrade cycle for iPhone. For 2025, Canalys sees the rebound in the PC market continuing in part as businesses prepare for the end of Windows 10, and for wider refresh efforts as more AI-PC models hit the market. Canalys sees AI-PCs accounting for 35% of the PC market this year, up from around 20% last year. Korean memory company SK Hynix supported that view, sharing expectations for AI PC penetration to reach 30%-40% of all PC shipments this year. SK also sees the smartphone market growing by a low-to mid-single-digit percentage this year, but it also sees AI fostering the replacement cycle with those enabled models accounting for 30% of shipments this year. Paired with Apple’s better-than-feared December-quarter results and guidance, the above bodes well for Qualcomm’s earnings report next week. During that report and in successive ones, we will monitor the migration of Qualcomm’s AI PC, automotive, and other IoT from program wins. Progress on that front should lead Wall Street to revisit how it values the shares, and that is what we are aiming to capture by owning QCOM. Upcoming catalysts we’ll be watching include January monthly revenue reports from Taiwan Semi and Foxconn as well as 2025 shipment forecasts from IDC and other research firms. Ahead of the company’s earnings report on Wednesday, February 5, we’ll have a technical look at the chart early next week.
1-Wk. Price Change: 0.48%; Yield: 1.97%
INVESTMENT THESIS: Qualcomm focuses on foundational technologies for the wireless industry, including 3G (third generation), 4G (fourth generation), and 5G (fifth generation) wireless technologies and processor technologies including high-performance, low-power computing, and on-device artificial intelligence technologies. As a connected processor company, its technology roadmap aims to enable the connected intelligent edge (the next generation of smart devices) across industries and applications beyond handsets, including automotive and the Internet of Things (IoT). Qualcomm has three reportable segments: QCT (Qualcomm CDMA Technologies) semiconductor business, which develops and supplies integrated circuits and system software based on 3G/4G/5G and other technologies for use in mobile devices; automotive systems for connectivity, digital cockpit, and ADAS/AD; and IoT including consumer electronic devices; industrial devices; and edge networking products. QCT accounts for 80%-85% of revenue. QTL (Qualcomm Technology Licensing) licensing business grants licenses or otherwise provides rights to use portions of the company's intellectual property portfolio, which includes certain patent rights essential to and/or useful in the manufacture and sale of certain wireless products. QTL accounts for ~15% of Qualcomm's revenue but contributes a greater portion of the company's operating income.
Target Price: $200; Rating: One
Panic Point: $140
RISKS: Customer risk, technology advancement, competition risk, third-party supplier, and manufacturing partner risk.
ServiceNow NOW; $1,018.38; 145 shares; 2.86%; Sector: Technology
UPDATE: We started off the first day of trading in 2025 picking up additional ServiceNow (NOW) shares for the portfolio following findings that enterprise leaders intend to spend a larger portion of IT budgets on AI this year. We added further to our NOW position mid-month following the December Producer Price Index-induced market selloff. Soon thereafter NOW shares moved higher on renewed market enthusiasm for software stocks benefiting from AI adoption following supporting data points as the current earnings season progressed. This week ServiceNow reported December-quarter results that topped consensus EPS expectations and contained more than 21% top-line growth. Somewhat softer-than-expected forward guidance relative to arguably aggressive expectations led NOW shares to tumble lower. After reviewing the company’s results and earnings call, we lifted our price target to $1,250 from $1,200 and upgraded NOW shares to a One rating. Given the size of the portfolio’s existing position in NOW, we’re waiting for the shares to settle out from the post-earnings market reaction before making any additional moves. Had we had a smaller position, we would likely be taking some advantage of this drop in the shares.
1-Wk. Price Change: -9.48%; Yield: 0.0%
INVESTMENT THESIS: The addition of ServiceNow adds exposure to the enterprise as it deploys AI-enabled solutions across its enterprise workflow platform. The company’s “Now Platform” is a cloud-based solution with embedded AI and machine learning (ML) capabilities that help unify and digitize workflows, driving productivity. At the heart of it, the company’s platform automates workflows across an entire enterprise by connecting disparate departments, systems, and silos in a seamless way to unlock productivity. ServiceNow counts more than 8,100 global customers, including 85% of the Fortune 500, with 97% of its revenue from subscriptions that have notched a 98% renewal rate.
Target Price: Reiterate $1,250; Rating: One
Panic Point: $900
The Trade Desk TTD; $118.68; 1,590 shares; 3.66%; Sector: Technology
UPDATE: Shares of The Trade Desk (TTD) continued to edge higher in January as Wall Street firms, ranging from Morgan Stanley, KeyBanc, and BMO Capital, boosted their price targets to $140-$160 from $125-4130. Following the thesis-confirming results from Trade Desk partner Netflix and its growing digital advertising business, we boosted our TTD target to $155 from $140 and upgraded them to a One rating. Soon thereafter we picked up more shares for the portfolio. Data from Group M, WPP’s media investment group, see pure-play digital advertising remaining as the strongest channel growing another 10% this year to account for 72.9% of the total $1.1 trillion advertising market in 2025. That implies a pure-play digital advertising market of more than $800 billion. Measured against the $2.96 billion 2025 consensus revenue forecast that suggests Trade Desk has ample market-share opportunities. Helping augment its ability to tackle that market opportunity, in mid-January Trade Desk acquired Sincera, a digital advertising data company. Our thinking is that Sincera’s tools and data that identify advertising value will be a nice complement to Trade Desk’s service offering as advertisers increasingly tap digital platforms. Trade Desk will report its December-quarter results on February 12.
1-Wk. Price Change: -1.07%; Yield: 0.0%
INVESTMENT THESIS: The Trade Desk offers a cloud-based ad-buying platform that empowers its clients to plan and manage data-driven digital advertising campaigns across ad formats and channels, including video, display, audio, digital-out-of-home, and social. Modalities for those campaigns span a multitude of devices, such as computers, mobile devices, televisions, and streaming devices. This positions the Trade Desk to benefit from an accelerating shift toward digital advertising. That shift is expected to see digital advertising account for more than 70% of total ad spending in 2025 rising to ~74% by 2027. We also see the company benefiting from the use of digital advertising in the 2024 presidential campaign, which is expected to grow more than 150% compared to 2024, putting it around $3.5 billion.
Target Price: Reiterate $155; Rating: One
Panic Point: $115
RISKS: Advertising spending; customer risk and loss; evolving market dynamics and competitive landscape; platform disruptions and outages.
United Rentals URI; $758.06; 240 shares; 3.54%; Sector: Industrials
UPDATE: January started with the November Construction Spending report which showed continued strength in infrastructure spending captured by the year-over-year increase in public non-residential construction spending. We continued to rebuild the portfolio’s position in United Rentals (URI), taking advantage of the mid-January market pullback and oversold condition in URI shares to do so. Late in January, United Rentals delivered a mixed earnings report, with revenue for the December quarter up 9.8%, year over year, to $4.09 billion, topping the $3.93 billion consensus. However, EPS for the quarter fell short of the market consensus by $0.09 per share, a miss of less than 1%. The company’s outlook for 2025 bookends market consensus forecasts, but the reality is that the forecast will likely be revised when URI closes its pending acquisition of H&E Equipment later this quarter. That transaction should bring another $1.5 billion in revenue and the opportunity to bring H&E’s margins up to URI levels. When the deal closes, we expect URI will refresh its 2025 outlook and that will give us reason to revisit our price target. Until then, the next catalyst for us to watch will be quarterly results from other construction-related companies as well as next week’s December Construction Spending report. We continue to see the businesses at United Rentals and soon-to-be-acquired H&E benefiting from non-residential construction projects. Should inflation get back on track sooner than expected, the market may need to revisit rate-cut expectations and that could be another catalyst for URI shares.
1-Wk. Price Change: -3.99%; Yield: 0.86%
INVESTMENT THESIS: United Rentals, the largest equipment rental company in the world, operates throughout the United States and Canada, and has a limited presence in Europe, Australia, and New Zealand. It serves industrial and other non-construction; commercial (or private non-residential) construction; and residential construction. Industrial and other non-construction rentals represented approximately 50% of rental revenue, primarily reflecting rentals to manufacturers, energy companies, chemical companies, paper mills, railroads, shipbuilders, utilities, retailers, and infrastructure entities; commercial construction rentals represented approximately 46% of rental revenue, primarily reflecting rentals related to the construction and remodeling of facilities for office space, lodging, healthcare, entertainment, and other commercial purposes; and residential rentals around 4% of revenue. We see the company benefiting on three fronts — the seasonal uptick in construction spending; the release of funds and projects associated with the five-year Biden Infrastructure bill; and the company's nip-and-tuck acquisition strategy that should further enhance its geographic footprint.
Target Price: Reiterate $900; Rating: One
Panic Point: $650
RISKS: Industry and economic risk, competition and competitive pressures, and acquisition risk.
Universal Display OLED; $149.92; 1,290 shares; 3.74%; Sector: Technology
UPDATE: Similar to the late 2024 performance with the portfolio’s position in Qualcomm, Universal Display was a drag on the portfolio following the company’s September-quarter guidance. At the time, we remarked that the outlook appeared overly conservative given other comments about key end markets for the company, especially the smartphone market. As the shares trended lower we scooped up more in November and December, and again in mid-January. Supporting that move was Q4 2024 smartphone data from IDC as well as quarterly results and 2025 guidance from Taiwan Semi, SK Hynix, LG Display, and Corning. LG shared it sees its smartphone business growing 20% year over year, which is faster than overall smartphone growth forecasts, suggesting further inroads for organic light-emitting diode displays. On Friday, Samsung echoed those comments, sayinh that it too sees organic light-emitting diode adoption in smartphones continuing to rise with growing adoption in automotive and IT applications. Aggregating those comments sets up what we see as a favorable backdrop for Universal’s December-quarter earnings report on February 20.
1-Wk. Price Change: -0.52%; Yield: 1.07%
INVESTMENT THESIS: Universal Display focuses on the development and commercialization of organic light-emitting diode (OLED) technologies and materials for use in display and solid-state lighting applications. OLED displays are capturing a growing share of the display market, especially in the mobile phone, television, monitor, wearable, tablet, notebook, personal computer, augmented reality (AR), virtual reality (VR), and automotive markets. This adoption reflects advantages over competing display technologies concerning power efficiency, contrast ratio, viewing angle, video response time, form factor, and manufacturing cost. Universal's business strategy is to develop new OLED materials and sell existing and new materials to product manufacturers for display applications, such as mobile phones, televisions, monitors, wearables, tablets, portable media devices, notebook computers, personal computers, and automotive applications, and specialty and general lighting products. The company also looks to license its OLED material, device design, and manufacturing technologies to those manufacturers. As such, Universal has a significant portfolio of proprietary OLED technologies and materials with more than 5,500 patents issued and pending worldwide.
Target Price: Reiterate $250; Rating: One
Panic Point: $135
RISKS: Patent and Intellectual property protection; maintaining OLED manufacturing and customer relationships; technology risk; market risk.
Vulcan Materials Company VMC; $274.15; 613 shares; 3.27%; Sector: Building Materials
UPDATE: January has been an eventful month for Vulcan, at least from a chart perspective. The stock ran into a buzzsaw of sellers in December, with that month wiping out strong gains from a bullish October/November. But given where the stock is sitting now (in a no man’s land) we are confident the next move is going to be higher. It seems analysts see it the same way, too, as RBC, Citi, and Raymond James have maintained "buys" on VMC and in most cases kept their price targets high. The recent high at $299 or so looms large as a target, but with the stock less than 8% below that all-time high we like the possibility of making a run there and past $300. Strong industrial/manufacturing data over the past few weeks indicate to us there is still strong business in the pipeline for Vulcan. The company will report earnings on February 18 before the market open. Ahead of that, next week brings the December Construction Spending report and as earnings season continues, we’ll look to quarterly results from other construction-related companies, including Martin Marietta on February 12, to set the table for Vulcan’s results. Should inflation get back on track sooner than expected, the market may need to revisit rate-cut expectations and that could be another catalyst for VMC shares.
1-Wk. Price Change: -1.22%; Yield: 0.67%
INVESTMENT THESIS: Vulcan Materials operates primarily in the U.S. and is the nation's largest supplier of construction aggregates (primarily crushed stone, sand, and gravel), a major producer of asphalt mix and ready-mixed concrete, and a supplier of construction paving services. Its products are the indispensable materials used in building homes, offices, places of worship, schools, hospitals, and factories, as well as vital infrastructure including highways, bridges, roads, ports and harbors, water systems, campuses, dams, airports, and rail networks. Ramping spending associated with the Biden Infrastructure Law should drive demand for Vulcan's products over the coming years. Vulcan has historically complemented its organic growth prospects by acquiring businesses to expand its geographic reach and product scope. Since 2014, the company has acquired more than two dozen companies, including the 2021 acquisition of U.S. Concrete. That combination has allowed the company to deliver steady top and bottom-line growth over the last decade, with only a modest decline when the pandemic hit in 2020.
Target Price: Reiterate $300; Rating: One
Panic Point: $225
RISKS: General economic and business conditions; dependence on the construction industry; timing of federal, state, and local funding for infrastructure; changes in the level of spending for private residential and private nonresidential construction.
TWOS
American Express AXP; $317.45; 250 shares; 1.54%; Sector: Financial Services
UPDATE: In late December, we added American Express (AXP) shares to the portfolio with a $330 price target — and the shares have been a strong performer since that move. Leading up to the company’s December-quarter earnings report, positive comments on travel demand from Delta Air Lines, United Airlines, and American Airlines, and the implied multiplier impact on consumer spending, propelled AXP higher. While American Express delivered a fine December-quarter earnings report with continued growth in the number of cards in force, average fee per card, and a 17% dividend increase, the shares traded off in response. Despite that, we lifted our AXP price target to $345. On Amex’s earnings call, the management team shared its plans to refresh 35 to 50 card products this year. Typically, those refresh efforts tend to drive card fee growth as either existing members trade up to capture larger rewards and benefits or as new members join. In 2024, Amex added 13 million new cards with 70% of those acquired on fee-paying products as it refreshed part of its product line. As its refresh efforts continue, potentially including the Platinum card, we should see continued card fee growth ahead. Management targets mid-high teens card fee growth year over year. As we move through the balance of the current earnings season and get some clarity on potential Trump tariffs, should market forces pull AXP shares closer to the 50-day moving average of just over $300, which would also close a gap in the chart, it would be a nice place to pick up some additional shares. Following Amex’s earnings report, Argus and RBC Capital boosted their price targets to $350, while Keefe Bruyette upped its to $360 from $350.
1-Wk. Price Change: -1.21%; Yield: 0.88%
INVESTMENT THESIS: American Express is a globally integrated, membership-driven payments company, providing customers with access to products, insights, and experiences that enrich lives and build business success. The company has four reportable operating segments: U.S. Consumer Services (USCS), Commercial Services (CS), International Card Services (ICS), and Global Merchant and Network Services (GMNS). American Express targets the premium consumer space by continuing to deliver membership benefits that span our customers’ everyday spending, borrowing, travel, and lifestyle needs, expanding its roster of business partners around the globe, and developing a range of experiences that attract high-spending customers. In 2024, the company’s net card fee revenue accounted for 65% of its pre-tax income, which we see providing a differentiated business model that should continue to grow as Amex wins new card members and drives its average fee per card higher.
Target Price: Reiterate $345; Rating: Two
Panic Point: Reiterate $260
RISKS: Slowdown in consumer spending, competition, membership growth, merchant acceptance, lack of new product innovation.
Apple AAPL ; $236.00; 790 shares; 3.60%; Sector: Technology
UPDATE: Heading into Apple’s December-quarter earnings report this week there had been much speculation about iPhone sales, especially in China, even though third-party data from IDC showed global iPhone unit sales rose 33% sequentially in the quarter. The same data showed a small decline in iPhone unit shipments compared to Q4 2023. As we saw in Apple’s report, the shift to higher-price Pro models led to a more modest year-over-year decline in iPhone revenue of just 1% compared to IDC’s unit shipment figures. That iPhone revenue decline for the December quarter was far better than some of the whisper figures across Wall Street. With the upgrade cycle unfolding and the higher-margin Services business poised to become a larger part of the business mix, we lifted our AAPL target to $270 from $250. As we look to gauge Apple’s guidance, we will be closely watching comments and monthly revenue reports from Taiwan Semiconductor and Foxconn as well as upcoming earnings and investor conference comments from others in the smartphone food chain. Qualcomm and Skyworks Solutions report next week. Timing for Apple’s expected refresh of the iPhone SE and further Apple Intelligence updates in coming iOS updates, including a big one for Siri targeted for early in the June quarter, are other potential catalysts on our watch list. The portfolio’s position in AAPL is a meaningful one and that means we will need to be selective when it comes to adding additional shares. That’s another reason for us to pay close attention to upcoming smartphone and upgrade-related data. At the same time, should we see market weakness pull Apple shares back near the $220 level that would offer us a favorable risk-to-reward trade-off in the shares. Subject to the driver behind such a move, it could also give us enough to revisit our Two rating.
1-Wk. Price Change: 5.93%; Yield: 0.42%
INVESTMENT THESIS: While we acknowledge that near-to-midterm performance remains heavily influenced by iPhone sales, the dynamic is shifting as investors finally place greater emphasis on Services growth. We are bullish on the 5G upgrade cycle and believe longer-term upside will continue to come as Services revenue grows its share of overall sales. Services provide for a recurring revenue stream at higher margins, a factor that serves to reduce earnings volatility while allowing for a higher percentage of sales to fall to the bottom line; as a result, we believe that Services growth and the installed base, are much more important than how many devices the company can sell in each 90-day period. In addition to improved profitability, we also believe the transparent nature of this revenue stream will demand an expanded price-to-earnings multiple as segment sales grow. Furthermore, we believe that Apple's desire to push deeper into the healthcare arena will help make its devices invaluable as more life-changing features are added and the company works to democratize health records. Lastly, also see upside resulting from increased adoption of wearables (think the Apple Watch) and potential new product announcements such as an AR/VR headset or an update on Project Titan, the company's secretive autonomous driving program.
Target Price: Reiterate $270; Rating: Two
Panic Point: Reiterate $200
RISKS: Slowdown in consumer spending, competition, lack of new product innovation, elongated replacement cycles, failure to execute on Services growth initiative.
Applied Materials Inc. AMAT; $180.35; 970 shares; 3.40%; Sector: Semiconductor Manufacturing
UPDATE: While off their highs for the month, shares of Applied Materials climbed double digits in January making them a solid contributor to the portfolio’s start of the year. The strong start was fueled by Taiwan Semiconductor’s 2025 capital spending forecast of $38 billion to $42 billion, up as much as 41% compared to 2024 and about 19% higher than Wall Street expectations. The shares received another shot in the arm later this month with the beat and raise quarter reported by ASML Holding, which also included a dramatic acceleration in December-quarter bookings. Upon that strength, which ASML chalked up to AI demand, it also reiterated its 2025 revenue forecast of €30 billion to €35 billion compared to the €28.3 billion delivered in 2024. Shortly thereafter, Lam Research also issued stronger-than-expected guidance for the current quarter citing AI demand. Those forward views support trade group SEMI’s 2025 semiconductor manufacturing equipment sales forecast, which calls for a 16% year-over-year increase to $131 billion followed by further gains to $139 billion in 2026. Our thought continues to be that rising chip demand will tighten existing chip capacity driving demand for new equipment. That has been one of the components behind our Applied Materials thesis. The other has been global chip capacity re-shoring, which should start to kick in as CHIPs Act and other awards in 2024 matriculate. From a technical perspective, AMAT shares face technical resistance at just over $182 and again near $197. Upcoming catalysts we’ll be watching to see if the shares can pierce that $182 resistance level include Taiwan Semi’s January sales report and comments from other large semi-cap spenders. Applied will report its quarterly results on February 13.
1-Wk. Price Change: -3.43%; Yield: 0.89%
INVESTMENT THESIS: Applied provides manufacturing equipment, services, and software to the semiconductor, display, and related industries. With its diverse technology capabilities, Applied delivers products and services that improve device performance, power, yield, and cost. Applied's customers include manufacturers of semiconductor chips, liquid crystal, and organic light-emitting diode displays, and other electronic devices. Applied operates in three reportable segments: Semiconductor Systems (73% of 2022 revenue, 78% of 2022 operating income), Applied Global Services (22%, 19%), and Display and Adjacent Markets (5%, 2%). Key customers include Samsung (12% of 2022 sales), Taiwan Semiconductor (20%), and Intel (10%).
Target Price: Reiterate $210; Rating: Two
Panic Point: $160
RISKS: Manufacturing and Supply Chain, Competitive Factors, Government Regulation, Technology Change.
Costco Wholesale COST; $979.88; 210 shares; 4.00%; Sector: Consumer Staples
UPDATE: Despite Costco’s (COST) December sales report showing clear signs the company continues to win consumer wallet share and expand its footprint, the shares were a modest contributor this month. A recent Bank of America survey found that nearly half of Americans at least somewhat agree with the statement, “I am living paycheck to paycheck” and we see that powering further share gains as Costo continues to expand its warehouse footprint and flex its digital commerce platforms. In terms of digital advertising, Costco is still in the early innings of leveraging its online and app base, but management shared that it is working with over 25 suppliers interested in its digital advertising efforts. The way we see it, those companies want to tap into Costco’s growing digital membership base much the way its suppliers want to reach its membership when they visit Costco’s warehouses. As that digital effort matures, if it repeats what we’ve seen with Amazon and others, it should have a very nice impact on Costco’s margins in the quarters ahead. The next two known catalysts for COST shares will be the company’s January sales report on February 5, and its next $1.16 per share quarterly dividend that will be paid on February 21. After that, it will be Costco’s February sales report and its quarterly earnings report on March 6.
1-Wk. Price Change: 4.28%; Yield: 0.47%
INVESTMENT THESIS: We like Costco's long-term prospects, driven by a club-based operating model that focuses on volumes, not margins, and therefore offers its customers a value proposition of everyday low prices. The strength of this model has created an incredibly loyal customer base with low churn and continued share gains in both bricks-and-mortar and e-commerce. This is a global concept, evidenced by the strength of sales both in the U.S. and abroad, which includes an emerging China opportunity. We see the company's membership model as a key differentiator vs. other retailers and its plans to open additional warehouse locations in the coming quarters should drive retail volumes and the higher-margin membership fee income as well. We also appreciate management's approach to capital returns and their willingness to return cash when it is in excess on the balance sheet.
Target Price: Reiterate $1,050. Rating: Two
Panic Point: $850
RISKS: Inability to pass through higher costs, fuel prices, weaker consumer, and membership churn.
Dutch Bros BROS; $62.52; 2,850 shares; 3.46%; Sector: Consumer Cyclical
UPDATE: Shares of Dutch Bros (BROS) continued their ascent in January fueled by a fresh round of price and ratings increases from Baird, Barclays, Stifel, and Jefferies. Following management’s evolutionary presentation at the ICR conference, we upped our price target to $65 from $50. While that increase was a long time coming, it reflects the company’s mobile order launch that is already generating a mid-single-digit lift. Management also discussed its expanding food offering, and we expect more clarity on this during Dutch’s 2025 Investor Day on March 27. That offering should complement the company’s footprint expansion plans, driving favorable comp sales along the way. The employment data found in the Flash January PMI report alongside real wage growth is encouraging for consumer spending, and we see BROS benefiting. We will continue to monitor coffee prices as well as those for dairy inputs, adjusting our margin and EPS expectations as needed. If we saw BRO shares pull back to support near the 100-day moving average, that would be an opportune time for us to revisit our Two rating.
1-Wk. Price Change: 3.85%; Yield: 0.0%
INVESTMENT THESIS: Dutch Bros is an operator and franchisor of drive-thru shops that focus on serving high-quality, hand-crafted beverages with unparalleled speed and superior service. As of June 30, 2024, there were 912 shops in operation in 18 U.S. states, of which 612 were company-operated and 300 were franchised. Coffee-based beverages make up ~50% of the menu mix, and ~25% of the menu mix is based upon the company’s proprietary Blue Rebel energy drink, which is highly customizable with flavors and modifiers and can be served blended or over ice. The energy platform helps unlock the afternoon daypart and broadens the company’s appeal. The remaining 25% of the menu mix is a wide variety of teas, lemonades, sodas, and smoothies. Through the first half of 2024, Dutch Bros opened 81 shops and targets 150-165 new ones for all of 2024. The company’s west-to-east expansion is a time-tested strategy that should drive revenue and EPS growth over the next several years. Over the last week, Citi and Jefferies boosted their ETN price targets to $440.
Target Price: Reiterate $65; Rating: Two
Panic Point: $42
RISKS: Commodity risks, labor costs, interest rate risk, inflation.
Eaton Corp. ETN; $326.44; 535 shares; 3.43%; Sector: Industrials
UPDATE: Shares of electrical construction company Eaton (ETN) started January off strong out of the gate bolstered by positive AI and data center comments from Taiwan Semi and others. Prospects for rising AI and data center capital spending complemented other data for infrastructure and non-residential spending that point to multi-year construction activity. Over the next five years, U.S. electricity demand is expected to grow by almost 16%, according to Grid Strategies. That's massive for an industry that saw power consumption increase less than 1% annually over the past 20 years. Despite that outlook, following recent DeepSeek headlines, ETN shares sold off hard alongside other data center-related companies. We used that pullback to scoop up more ETN shares for the portfolio. When Eaton reported its December quarter, the results were mixed but adjusting for currency headwinds and the impact of Hurricane Helene early in the quarter, we have no issues with its results. While the company delivered guidance for the current quarter of EPS between $2.65-$2.70 that bookends the market consensus, we are encouraged by Eaton’s continued shift in business mix toward the higher-margin electrical business. The demand picture outlined above explains the double-digit strength in orders for the Electrical Americas segment as well as its 29% year-over-year backlog increase found in Eaton’s December-quarter results. The management chalks that strength up to $154 billion in construction megaprojects announced during Q4 2024. Through the end of 2024, the number of megaprojects announced reached 569 with a cumulative value of $1.7 trillion. Backlog levels for those projects stand at $1.9 trillion up 33% year over year. As impressive as those figures are, only 15% of those projects have started and expectations are a record number of starts will occur this year. This offers a very nice multi-year runway for Eaton. We will look to revisit potential buy points following next week’s quarterly results and capital spending comments from Amazon and Alphabet.
1-Wk. Price Change: -11.53%; Yield: 1.15%
INVESTMENT THESIS: Eaton is an intelligent power management company that makes products for data center, utility, industrial, commercial, machine building, residential, aerospace, and mobility markets. That business is positioned to capitalize on the megatrends of electrification, energy transition, and digitalization. We see Eaton helping address the power pain point created by data center, EV charging infrastructure, and other drivers of electricity demand. Research estimates that data center power demand will grow 160% by 2030, accounting for 3%-4% of global power up from 1%-2% today. Data centers will use 8% of U.S. power by 2030, compared with 3% in 2022.
Target Price: Reiterate $400; Rating: Two
Panic Point: $275
RISKS: Raw material costs, labor costs, end market volatility, government legislation.
First Trust Nasdaq Cybersecurity ETF CIBR; $67.60; 2,530 shares; 3.32%; Sector: Cybersecurity
UPDATE: Each time we note ripped-from-the-headlines confirmation points for the portfolio and its underlying strategy, one constant is the signals for cybersecurity demand. That explains the continued climb in shares of the First Trust Nasdaq Cybersecurity ETF (CIBR) in January. Artificial intelligence will super-charge familiar 2024 threats in 2025, putting new wrinkles on old security challenges such as phishing, insider threats, and ransomware. Research firm Gartner expects that cybersecurity spending is expected to increase 15% in 2025, from $183.9 billion to $212 billion. We’ll look to determine how conservative that outlook may be when key holdings in the CIBR ETF, including CrowdStrike, Cisco, Palo Alto Networks, Fortinet and others report their quarterly results. As those results roll in, we’ll revisit our CIBR price target as needed. We continue to favor the diversified exposure CIBR brings to the portfolio, which complements the cybersecurity efforts at Elastic, Microsoft, and Alphabet.
1-Wk. Price Change: 1.24%; Yield: 0.02%
INVESTMENT THESIS: The First Trust Nasdaq Cybersecurity ETF seeks investment results that correspond generally to the price and yield (before the fund's fees and expenses) of an equity index called the Nasdaq CTA Cybersecurity Index. The Nasdaq CTA Cybersecurity Index is designed to track the performance of companies engaged in the cybersecurity segment of the technology and industrial sectors. It includes companies primarily involved in the building, implementation, and management of security protocols applied to private and public networks, computers, and mobile devices to protect the integrity of data and network operations. To be included in the index, a security must be listed on an index-eligible global stock exchange and classified as a cybersecurity company as determined by the Consumer Technology Association. Each security must have a worldwide market capitalization of $250 million, have a minimum three-month average daily dollar trading volume of $1 million, and have a minimum free float of 20%.
Target Price: Reiterate $72; Rating: Two
Panic Point: Reiterate $57
RISKS: Cybersecurity spending, technology, and product development, the timing of product sales cycle, new products, and services in response to rapid technological changes and market developments as well as evolving security threats.
Labcorp Holdings Inc. LH; $249.80; 710 shares; 3.45%; Sector: Healthcare
UPDATE: In late December, the spreading H5N1 bird flu and the commercial availability of Labcorp’s (LH) H5 bird flu molecular test led us to scoop up additional shares of Labcorp (LH) for the portfolio near $230. We see that as a prime example of the company’s expanding array of testing, which complements the expanding array of medical tests for an increasingly aged population. When the company reports its quarterly results on February 6, we look forward to an update on its efforts to win hospital and medical office business, scaling its clinical lab services business. We will also be interested to hear more about Labcorp’s acquisition pipeline. Labcorp continues to see acquisitions being accretive next year, which bodes well for incremental profit dollars falling to the bottom line. Management has the capacity, and the company has the balance sheet for other nip-and-tuck acquisitions in this still-fragmented medical testing and diagnostics business. Following the continued climb since late May, which has LH flirting with overbought territory, should we see the shares climb further and encroach on our $260 target some prudent profit-taking may be called for.
1-Wk. Price Change: 1.54%; Yield: 1.15%
INVESTMENT THESIS: Labcorp is a global leader in innovative and comprehensive laboratory services that provides vital information to help doctors, hospitals, pharmaceutical companies, researchers, and patients make clear and confident decisions. By leveraging its diagnostics and drug development capabilities, the company provides insights and accelerates innovations to improve health and improve lives. The company is organized under two segments, consisting of Diagnostics Laboratories (Dx), which includes routine testing and specialty/esoteric testing, and Biopharma Laboratory Services (BLS), consisting of Early Development Research Laboratories and Central Laboratory Services. Our attraction to LH shares stems from the combination of the aging population driving diagnostic testing growth and the increasing array of diagnostic testing as well. That combination is expected to drive the healthcare testing services market to $12.6 billion by 2029, from $7.4 billion in 2024, according to Markets and Markets. To augment its position in oncology, women's health, autoimmune diseases, and neurology, the company has been expanding through acquisitions and partnerships with health systems and regional local labs.
Target Price: Reiterate $260; Rating: Two
Panic Point: Reiterate $200
RISKS: Macroeconomic factors, changes in healthcare reimbursement models and products, government regulations, product discontinuations or recalls.
Marvell Technology MRVL; $112.86; 1,867 shares; 4.11%; Sector: Technology
UPDATE: Following their strong December showing, shares of Marvell had their ups and downs in January, but gained little ground overall. Strong December-quarter revenue and guidance from Taiwan Semiconductor, robust 2025 capital spending levels on AI and data center, and accelerating AI adoption led MRVL higher in early January. That in turn led MRVL shares to move past a 4.5% position size for the portfolio triggering some prudent portfolio management that locked in some big gains. The January share gains were later erased amid concerns over the potential impact of DeepSeek’s models. We used that pullback to rebuild the portfolio’s MRVL position. It has since been reported that model has poor accuracy levels at just 17% per an audit from NewGuard, and this week Microsoft and Meta reaffirmed their targeted capital spending levels. Also this week, Corning reported its Optical Communications segment posted 51% year-over-year growth in the December quarter and touched on expanding fiber footprints at Verizon and AT&T, which should improve deployment for Corning’s carrier business this year. During its earnings call this week, T-Mobile USA shared its 2025 capital spending will be about $9.5 billion compared to $8.8 billion last year. Those are very favorable data points for Marvell’s Enterprise networking and carrier infrastructure segments. Our position has been that we are seeing an AI arms race unfold as companies and other institutions adopt AI and that will continue to drive capacity demands for AI and data center chips. We are starting to see a recovery in enterprise networking demand and carrier infrastructure. As enterprise and consumer AI adoption grows, we should see the rebound in those markets accelerate, a positive for Marvell. When Amazon and Alphabet report next week, we’ll be listening for comments on their capital spending levels for this year and progress on their proprietary AI chip efforts for which Marvell is a partner. While Marvell has not shared the date for its next quarterly earnings report it did announce it will hold an Investor Day on June 10.
1-Wk. Price Change: -9.00%; Yield: 0.21%
INVESTMENT THESIS: Marvell is a fabless supplier of high-performance standard and semi-custom infrastructure semiconductor solutions. These solutions power the data economy, enabling the data center, carrier infrastructure, enterprise networking, consumer, and automotive/industrial end markets. With roughly 75%-80% of Marvell's revenue stream tied to digital infrastructure, we see it continuing to benefit from rising content consumption and creation. Pointing to that rising demand that necessitates network densification and the build of digital infrastructure, Ericsson sees global monthly average usage per smartphone reach 46 gigabytes (GB) by the end of 2028 vs. 19 GB in 2023 and 15 GB in 2022.
Target Price: Reiterate $130; Rating: Two
Panic Point: $85
RISKS: Technology risk, customer risk, competition risk, reliance on manufacturing partners, and supply chain constraints.
Mastercard MA; $555.43; 230 shares; 2.50%; Sector: Info. Tech
UPDATE: After trading sideways for most of December, Mastercard (MA) shares started January off by pulling back further closed alongside the market but then sprang bank amid favorable consumer spending data and earnings from American Express. Those gains were built on further with Mastercard’s December-quarter results and low-double-digit revenue guidance for the current quarter, which led us to up our price target to $600. However, the post-earnings move put MA shares at an all-time high and in overbought territory. That prompted us to lock in a slice of the more than 30% move in MA since late July on Friday. The portfolio will continue to have exposure to MA shares as it continues to attack the use of cash and checks around the globe, which it estimates at $11 trillion and $1.5 trillion in respective transactions. Should employment and real wage growth prove to be stronger than expected in the coming months, it would give us reason to once again revisit our MA price target. We will also closely follow its efforts on the crypto front, which could expand investor enthusiasm for the shares. If we see MA shares pull back to support levels between $515 and $526, which would offer double-digit upside to our new price target, subject to our cash levels, we may consider buying back some MA shares. Because Friday’s trade occurs after the January 10 record date for Mastercard’s February 7 payment date for its first quarterly dividend of $0.76 per share, we will receive that payment for all 275 MA shares the portfolio owned prior to Friday’s trade.
1-Wk. Price Change: 4.11%; Yield: 0.55%
INVESTMENT THESIS: Mastercard is a card network company that benefits from the secular shift away from cash transactions and toward card-based and electronic payments. On Covid-19 dynamics, we view MA as a "reopening" play and an economic recovery play within technology because its cross-border volumes fell sharply during the pandemic but will rebound as mobility increases and travel restrictions ease. Mastercard has more international exposure relative to Visa (V), making its growth outlook more susceptible to new travel restrictions. However, we view MA as the better long-term play as we are betting on that inevitable recovery.
Target Price: $600; Rating: Two
Panic Point: $470
RISKS: The recovery in cross-border transactions, regulation in the payments market, competition from other fintechs, and pricing pressures.
Meta Platforms META; $689.18; 240 shares; 3.20%; Sector: Communication Services
UPDATE: We steadily built up the portfolio’s position in Meta (META) during the last five months of 2025 by leveraging pullbacks in the market and the shares to do so. That effort paid off nicely for the portfolio in January with the more than 15% move in the shares fueled by a combination of accelerating AI adoption and the accelerating shift to digital advertising. Data from Group M, WPP’s media investment group, sees pure-play digital advertising remaining as the strongest channel and forecasts it will account for almost 73% of total advertising in 2025. That backdrop as well as Meta’s utilizing machine learning and AI to deliver enhanced advertising programs across its Family of Apps bodes well for higher ad prices as companies look to reach Meta’s expanding base of users. Following the company’s consensus-beating December-quarter results that contained 20% top-line growth and continued margin expansion, we boosted our META price target to $725. As we noted in that Alert, however, META shares are in overbought territory and that was a factor in maintaining our Two rating. Meta clearly telegraphed an ambitious generative AI roadmap for this year, which could restrain the degree of margin improvement we see in the near term. That includes the management team reiterating it will spend $60 billion to $65 billion in capex this year, making it another year of investment. This could result in another step function step-up in margins once the company emerges from this spending ramp. We continue to see the company well positioned as the shift to digital advertising accelerates and as it focuses on monetizing more of its platforms. We’ll revisit our $725 target based on Meta’s monetization efforts and as its spending outlook is updated in the coming quarters. We will also be watching for Meta's next dividend announcement to see if it increases its quarterly payout to shareholders beyond the last $0.50 per share quarterly dividend payment.
1-Wk. Price Change: 6.44%; Yield: 0.29%
INVESTMENT THESIS: Meta segments its business between Family of App Products, which includes Facebook, Instagram, Messenger, Threads, and WhatsApp, and Reality Labs Products, which includes its metaverse and investments and future product R&D. Family of Apps accounts for ~99% of company revenue and 100% of company operating profit. Substantially all of Meta’s revenue is currently generated from advertising on Facebook and Instagram. Family daily active people (DAP) was 3.27 billion on average for June 2024, an increase of 7% year-over-year. Meta forecasts capital expenditures of approximately $37 billion to $40 billion in 2024 and expects its capital expenditures to grow significantly in 2025 to support our AI research and product development efforts. Meta is positioned to benefit from the ongoing shift toward digital advertising and the adoption of AI across its product offerings. We recognize Meta is ramping up capital spending as part of the current AI arms race, but we see that as an investment that should drive productivity in its core advertising business. As the company harvests that investment, we could see a step up in margins much like we saw in 2023.
Target Price: Reiterate $725; Rating: Two
Panic Point: $475
RISKS: Ability to add and retain users and user engagement; marketing spend; new products or changes to existing ones; competitive risk, geopolitical risk.
Microsoft Corp. MSFT; $415.06; 425 shares; 3.44%; Sector: Technology
UPDATE: Two-rated Microsoft (MSFT) was one of the few holdings to be a drag on the portfolio in January, albeit a modest one. Back in September, the company shared its cloud business was capacity-constrained, prompting a ramp in capital spending to bring more capacity online. Even so, Microsoft delivered 31% revenue growth at Azure when it reported its December quarter. While some were miffed at that figure, it was only at the lower end of the company’s 31%-32% guidance. Microsoft expects to match December-quarter spending levels in each of the next two quarters as it continues to bring more cloud capacity online and targets even higher spending in H2 2025 and H1 2026 to meet customer demand for AI and cloud. Supporting that outlook, Microsoft said its AI business annual revenue run rate surpassed $13 billion and was above expectations. Commercial bookings increased 67% and 75% in constant currency and its Commercial remaining performance obligation increased to $298 billion, up 34%. Roughly 40% will be recognized in revenue in the next 12 months, up 21% year over year, while the remaining portion recognized beyond the next 12 months increased 45%. With shares below $420, we see that as a good pick-up point consistent with our Two rating. Because converting bookings into a faster pace of revenue growth hinges on Microsoft’s firing up new cloud capacity, our plan is to revisit the company’s capacity ramp toward the end of the current quarter. Based on what we learn, we will revisit our current MA price target. Our thought is that as capacity comes online the re-energized revenue stream is a potential catalyst to break MSFT shares out of the trading range they’ve been in the last several months. Should market forces pull MSFT shares near the $405 level that would give us reason to revisit our Two rating.
1-Wk. Price Change: -6.53%; Yield: 0.80%
INVESTMENT THESIS: We believe the cloud to be a secular growth trend and that upside to the shares will result from Microsoft's hybrid cloud leadership as the company grabs market share in this expanding industry. While companies may look to build out multi-cloud environments, Microsoft's Azure offering will be a prime choice thanks to its decision to provide the same "stack" used in the public cloud, to companies for their on-premises data centers. Additionally, we would note that hybrid environments are currently the preference for most companies because they allow them to maintain critical data in-house while taking advantage of the agility and scalability provided by public clouds. Outside of the cloud opportunity, we maintain a positive view on the company's growing gaming business, which we believe is becoming an increasingly prominent factor in the Microsoft growth story as gaming becomes more mainstream, management works to convert its gaming revenue from one-time license purchase to a recurring subscription model and as technologies like augmented/virtual reality evolve. Finally, as it relates to LinkedIn and other subscription-based services such as O365 and various Dynamics products, we continue to value them highly for their recurring revenue streams, which, we remind members, provide for greater transparency of future earnings.
Target Price: $480; Rating: Two
Panic Point: Reiterate $375
RISKS: Slowdown in IT spending, competition, cannibalization of on-premises business by the cloud.
Morgan Stanley MS; $138.43; 1,462 shares; 3.93%; Sector: Financial Services
UPDATE: Shares of Morgan Stanley (MS) were a vibrant performer for the portfolio during Q4 2024 and that strength continued in January. Early gains were had amid bullish comments about investment banking prospects for 2025 by Jefferies, JPMorgan Chase, Goldman Sachs and others. That set the stage for Morgan’s blowout December-quarter results that benefited from revenue gains across all its business lines. In response to its healthy M&A pipeline and prospects for the IPO market, we boosted our MS price target to $145 from $140, but as Morgan’s pipeline of deals becomes announced transactions, we’ll look to revisit our price target as needed. The firm has ample firepower left under its new $20 billion share repurchase authorization and we suspect management will continue to shrink its outstanding share count, especially if the investment banking business is robust. Morgan will pay its next $0.925 per share quarterly dividend on February 14 to shareholders of record as of January 31. We were not alone in boosting our MS price target — Keefe Bruyette matched our new target while Barclays boosted its to $156 and BofA lifted its target to $153. As the shares continued to melt up during the last week of January, we opted to lock in a slice of the more than 50% move in MS shares since early August.
1-Wk. Price Change: 0.44%; Yield: 2.67%
INVESTMENT THESIS: Morgan Stanley reports in three business segments: Institutional Securities (42% of trailing 12-month revenue, 38% of trailing 12-month Income Before Tax), Wealth Management (48%, 55%) and Investment Management (10%, 6%). While the IPO window has yet to reopen, the potential IPO class for 2024 continues to build with recent additions including Panera Bread, Reddit, Fanatics, and Skims, which is backed by Kim Kardashian. This along with the Fed increasingly likely to start cutting rates in H2 2024, suggests we are far closer to the IPO window opening on a sustained basis than we have been in some time. That would be a boon to private equity firms and others that have been nursing IPO candidates during the dark period and a positive for Morgan's investment banking business. Marginally lower rates could also generate a pick-up in M&A activity as the cost of capital with rates improving. As the Fed continues its cutting cycle to get rates back to normalized levels, that effort would also reduce rates for stock market alternatives, ones that quashed the "there is no alternative" trade earlier this year. That along with folks continuing to be behind in retirement savings bodes well for Morgan's wealth management business in the coming quarters. We see several gaps in the chart over the last few months, and all things being equal if the shares retreated near $120, we would be inclined to revisit our Two rating.
Target Price: $145; Rating Two
Panic Point: $110
RISKS: Market and interest rate risk, credit risk, country risk, and operational risk, including cybersecurity.
VanEck Uranium and Nuclear ETF NLR; $89.38; 478 shares; 0.83%; Sector: Industrials
UPDATE: Early in the week, we added shares of the VanEck Uranium and Nuclear ETF (NLR) to the Bullpen. If you’ve been reading our weekend "signals" Alerts, then you know nuclear power is receiving much attention as a solution to the data center power demand problem. Following the pressure placed on the shares as part of the DeepSeek-related selloff, we called NLR shares up to the portfolio, establishing a $98 price target and a $73 panic point. While there was sufficient upside to warrant a One rating, as we discussed in Monday’s video, we could see a few more bumps in the coming days and that led us to take a cautious approach. With that in mind, we’ll watch the support level near $82.75 for NLR closely to pick up more shares, but for now, we’re starting the position with a Two rating.
1-Wk. Price Change: 4.93%; Yield: 0.0%
INVESTMENT THESIS: The VanEck Uranium and Nuclear ETF seeks to replicate as closely as possible, before fees and expenses, the price and yield performance of the MVIS®Global Uranium & Nuclear Energy Index (MVNLRTR), which is intended to track the overall performance of companies involved in: (i) uranium mining or uranium mining projects; (ii) the construction, engineering, and maintenance of nuclear power facilities and nuclear reactors; (iii) the production of electricity from nuclear sources; or (iv) providing equipment, technology and/or services to the nuclear power industry. We see the companies captured in NLR helping address the energy paint point that will be created in part by the expected data center build-out. Figures from the International Energy Agency see a potential doubling of global data center electricity consumption by 2026, driven primarily by the rise of artificial intelligence (AI) applications, potentially reaching over 1,000 terawatt hours (TWh) from the current 460 TWh in 2022. In response, we are seeing companies ranging from Blackstone to Microsoft and Meta announce plans to invest in nuclear power to help power its growing AI operations.
Target Price: $98; Rating: Two
Panic Point: $73
RISKS: Nuclear energy and energy market risks, currency and foreign exchange, political and economic.
Waste Management WM; $220.26; 835 shares; 3.59%; Sector: Industrials
UPDATE: In late December we picked up more shares of Waste Management (WM) for the portfolio at $205.67. Through most of January, the shares had a positive impact on the portfolio, and that impact became even greater following the company’s December-quarter earnings report and stronger-than-expected revenue and EBITDA guidance for 2025. After reviewing the results and digesting the company’s earnings call, we boosted our WM price target to $245 from $230 to reflect expected continued top-line growth and margin expansion over the coming quarters. Those efforts should be fueled by continued adoption of technology and automation across WM’s core residential business, management’s focus on disciplined pricing, and initial synergies of $100 million this year as it integrates Stericycle. Those acquisition synergies are expected to be more heavily weighted to the second half of 2025 and 2026, and a more meaningful update could come at WM’s June Investor Day. At the June Investor Day, we expect a more concrete roadmap for those cost synergies as well as revenue ones. As we get those details, we’ll revisit our new $245 target as needed. With just over 10% upside to that target, there isn’t enough to justify a rating upgrade just yet. However, if WM shares pullback to the $211-$213 level, which has nice support given the tightness of the 100-day and 200-day moving averages, that could give us enough upside to reconsider an upgrade. And that’s before we factor in the company’s 2025 annual dividend of $3.30 per share, up from $3.00 last year.
1-Wk. Price Change: 5.17%; Yield: 1.50%
INVESTMENT THESIS: 2025 will see more nonresidential construction activity because of the Biden Infrastructure Law, but now we can finally factor in activity for the CHIPs Act, which saw its first award this week. Other potential drivers include spending associated with the Inflation Reduction Act, including the much-awaited start of building out a nationwide network of EV charging stations. Recently President Biden announced an $8.2 billion passenger rail project, which will likely take several quarters to come onstream, leading us to think it's more of a 2025 catalyst. Alongside that bright outlook for WM's commercial business, automation efforts and pricing power in its sticky residential business should drive margins and EPS generation higher in the coming quarters.
Target Price: $245; Rating: Two
Panic Point: $185
RISKS: Industry and economic risk, competition and competitive pressures, and acquisition risk.
