Monthly Roundup: A Good May for the Market. Even Better for the Portfolio.
The Pro Portfolio made great strides in May, but we're mindful of upcoming data and near-term hurdles, while staying focused on the long-term.
You've reached your free article limit
You've read 0 of 1 free Pro articles.
Following what can only be described as a challenging March and April for the stock market, the S&P 500 and Nasdaq Composite rallied back in May amid renewed hopes for trade deals as investors digested economic data that showed less of a tariff impact than was feared. The more than 6% gain by the S&P 500 in May and the greater than 9.5% surge in the Nasdaq Composite were the best months for those market indexes since November 2023. The Pro Portfolio also made a very strong showing during May, spurred on by a significant number of its holdings outperforming the S&P 500 by a wide degree.
We certainly welcomed that rebound that landed the Pro Portfolio and those market indicators back in the green on a year-to-date basis. However, as we saw late this week, we are not out of the woods just yet on the tariff and trade deal front. We could be in for another round of saber-rattling by President Trump like we saw recently with the EU, but the longer we go without trade deals the more likely we’re apt to see second-half 2025 EPS expectations for the S&P 500 move lower. And as that happens, we suspect the number of investors posing questions about the S&P 500’s P/E multiple will grow. To help members get ready for that likely conversation, we’ll start next week off with a fresh look at S&P 500 EPS expectations for H2 2025 and 2025.
We also saw more companies warn this week about pending price increases to blunt the impact of tariffs on their bottom line. That along with the uptick in inflation pressures found in S&P Global’s Flash May PMI report reinforces our thinking the market is poised to be disappointed by the number of rate cuts the Fed will deliver this year. As we parse next week’s May data and its implications, we’ll be mindful of the Fed’s forthcoming economic projections update exiting its June 18 policy decision.
While our intention is to put more of the Pro Portfolio’s cash to work, given the above hurdles and others, we will take our time in deploying that capital, keeping an eye on the long-term prize. We are on the hunt for new Pro Portfolio and Bullpen candidates, but as we do so we will continue to follow our thematic and fundamental framework as well as remain sticklers for companies with superior EPS prospects relative to the S&P 500.
We will also continue to heed technical indicators for the market and for individual stocks, which could lead to some prudent profit-taking. In terms of our near-term shopping list, based on our May 30 comments, we are eyeing additional shares of Elastis ESTC and also Marvell MRVL.
With that, enjoy your weekend. We have a busy week coming at us as well as Office Hours on Monday, and a fresh Stocks & Market Podcast to share.
Catching Up on the Portfolio This Week
While the Pro Portfolio (and overall stock market) gyrated in May, it recovered quite a bit of ground lost from March and April to close the month in the green on a year-to-date basis. We can attribute that to strong May showings in shares of Axon Enterprise AXON, Nvidia NVDA, Dutch Bros BROS, Bank of America BAC, Meta META, Morgan Stanley MS, Microsoft MSFT, Universal Display OLED, and United Rentals URI. Each of those nine holdings posted double-digit gains during the month, making them sizable outperformers against the S&P 500’s “modest” gains of more than 6%. Other outperformers in the Pro Portfolio relative to that benchmark included Amazon AMZN, American Express AXP, Eaton ETN, and Labcorp LH.
We would be remiss if we didn’t touch on the few positions that declined during May – Apple AAPL, Elastic ESTC, and Qualcomm QCOM. Both Apple and Qualcomm shares reacted to President Trump’s bluster over a 25% tariff for smartphones sold in the U.S. that are not produced in the U.S. We’ll continue to follow tariff developments on this front but we’ll also follow the hard data furnished by Taiwan Semiconductor, Foxconn, and others and what it tells us about smartphone volumes. We will also continue to track Qualcomm’s diversification strategy, which based on comments from HP this week, should show nice progress in H2 2025. In our note discussing Elastic’s April-quarter earnings and guidance, we explained why we are inclined to use the May-end pullback in the shares to augment the Pro Portfolio’s position.
Actions taken by the Pro Portfolio in May included closing out our market-hedging positions in ProShares Short S&P 500 ETF SH and ProShares Short QQQ ETF PSQ on May 8. A few days later on May 12, we picked up shares of Amazon, American Express, Dutch Bros, Elastic, Meta, and Marvell MRVL. As the market chugged higher we took advantage of either significant moves off April lows or heeded overbought relative strength index levels and rang the register on the shares of Axon, Eaton, the First Trust Nasdaq Cybersecurity ETF CIBR, ServiceNow NOW and two other holdings on May 20. Our last move in May was to close out the relatively small, but very profitable position in the VanEck Uranium & Nuclear ETF NLR following a Trump-induced spike in the shares. We booked that exit at $99.25 on May 27, and we’ve already seen shares of the ETF trade off that level.
The total of those actions has the Pro Portfolio with 24 positions and more than 15% of its assets in cash. On May 23, we added shares of SuRo Capital SSSS to the Bullpen as a potential play on CoreWeave CRWV and OpenAI, and we’ll continue to monitor those shares closely.
This Week's Portfolio Videos
We cover a lot of ground during the week in our Daily Rundowns. If you happened to miss one or more of them, here are some helpful links:
Tuesday, May 27: Nvidia Earnings Loom Large Over Market
Wednesday, May 28: TheStreet Stocks & Markets Podcast #7: Wash, Rinse and Repeat With Bob Lang
Friday, May 30: Why We'll Be Extra Vigilant This Weekend
This Month’s Podcasts and Signals
Big discussions and insights are had during TheStreet Stocks & Markets Podcast and in the signals we share for the Pro Portfolio’s strategies. Here are some quick links to those conversations conducted over the last several weeks:
Apple Glasses, AI Travel Agents, Aging States and More News for Investing
TheStreet Stocks & Markets Podcast #6: The Next Market Catalyst with Jay Woods
Silver Tsunami, Google in Kuala Lumpur, Tunisian Telecoms and More News for Investors
TheStreet Stocks & Markets Podcast #5: First Technical Green Light with Louis Llanes
TheStreet Stocks & Markets Podcast #4: Nvidia Game Plan with Todd Campbell
Key Global Economic Readings
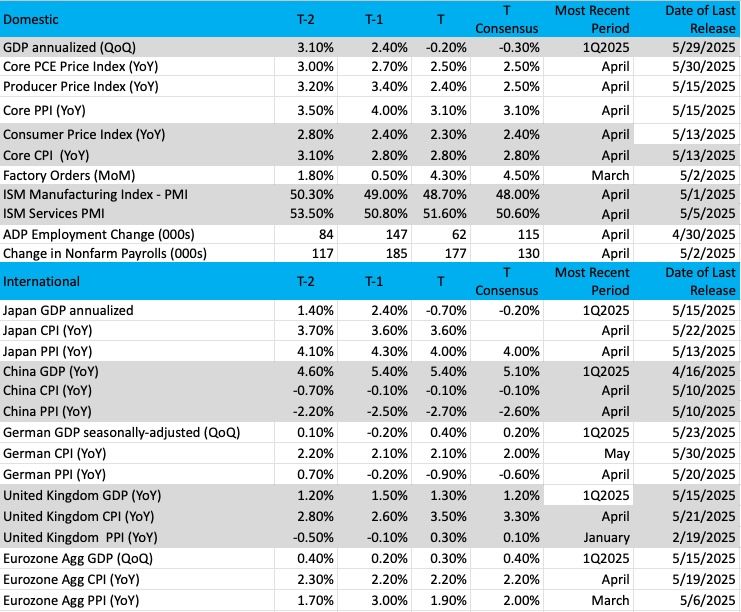
(Note: T is the most recent period, T-1 is the prior period's reading and T-2 is two periods back, the intent being to illustrate any trends)
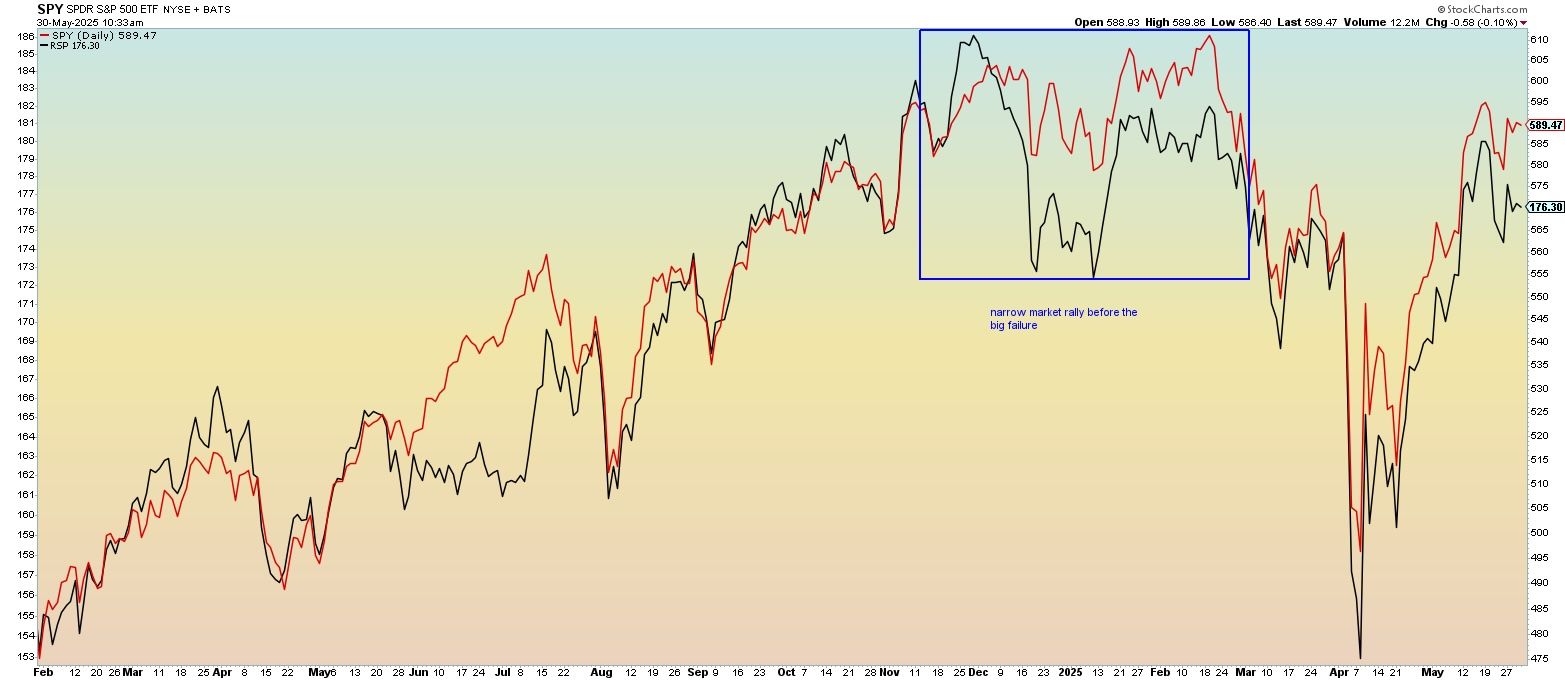
Chart of the Week: S&P 500 – Market Cap vs. Equal Weighted
We are back with another look at the SPDR S&P 500 ETF SPY versus the Invesco S&P 500 Equal Weight ETF RSP, or the weighted S&P 500 against the unweighted index. As you'll recall from previous Roundup charts, the SPY considers market capitalization when pricing in the SPY, so the most valuable companies in the universe have a much stronger influence. Conversely, the RSP is the equal-weighted index, meaning each company is equal in the eyes of the evaluator. In other words, Apple AAPL and ServiceNow NOW carry the same weight in the RSP though they have vastly different market caps.
We have seen good performance from both the RSP and SPY over the past month. In fact, the two have mostly been in sync, but the SPY has performed slightly better due to the strength in those Magnificent Seven names. For the year, the RSP and SPY are both up about 1%.
The technical picture looks good for the SPY and RSP here, but we would like to see the RSP continue to perform better. Why is that? A broadening of market participation is much preferred over a narrow rally. Recall back in late 2024/early 2025 the narrowness of the market rally and the domination of just a handful of stocks.
Broader market rallies tend to be much healthier and withstand corrections much better. During that period mentioned above (box in the chart) those handful of names performed well but most of the market did not and thus was vulnerable to some deep selling. We experienced that scenario in April of this year with a very nasty corrective period.
Today, there is some good participation from most groups, strong turnover, and broadening out. When we see a correction, it might be much milder than most would expect.
Other charts we shared with you this week were:
Tuesday, May 27: S&P 500 - Charting the S&P 500: Ready for a Move to Higher Ground
Tuesday, May 27: Costco (COST) - Costco Should Defy the Odds Once Again
Wednesday, May 28: Marvell (MRVL) - Marvell Arrives at Critical 'Decision Point'
Thursday, May 29: Morgan Stanley (MS) - As Morgan Stanley Steadies, Keep an Eye on This Key Level
The Week Ahead
When we return from the weekend, we enter the final month of the June quarter. While past performance is not an indicator of future performance, we will be mindful of how the market has performed in the past during the sixth month of the year.
In post-U.S. presidential election years over the past seven decades, the S&P 500 has typically struggled in early June as investors book profits heading into the summer months, which is particularly the case if stocks get a strong boost in May, like this year. While that is how the month tends to begin, data tabulated by Bloomberg show the S&P 500 has only suffered losses once in June over the last decade.
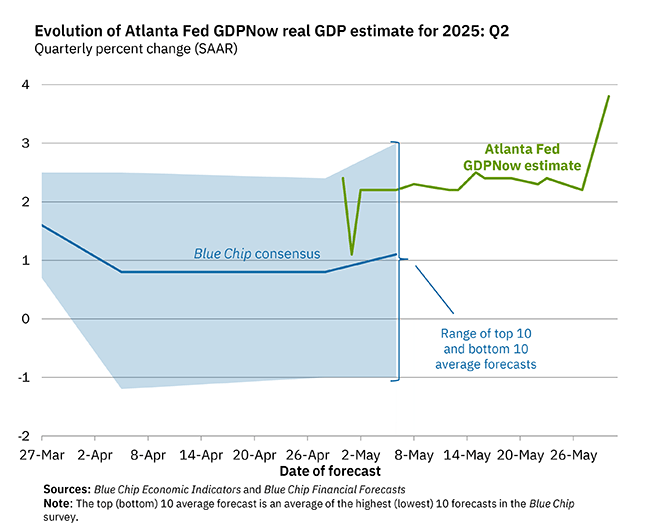
With that context in hand, the Atlanta Fed GDPNow model showing a staggering 3.8% rolling GDP forecast for the current quarter and the CME FedWatch Tool indicating the market still expects three 25-basis point rate cuts this year, we could see market turbulence return next week. There are two reasons to suspect that could be the case.
First, the onslaught of May economic data will refresh expectations for the Service sector, inflation pressures, and job creation. Those data points outlined below will lead the Atlanta Fed and other central banks to revisit current-quarter GDP models that are so far based only on April data. With each layer of new data, we’ll get a more refined look at the true picture of the economy, warts and all.
Much like the Fed, we’ll continue to focus on what the hard data reveals, updating our expectations, including potential rate-cut timing, along the way. If the May PMI data from ISM support the current GDP figure from the Atlanta Fed, it’s going to be very hard for the Fed to justify a rate cut anytime soon. To the extent that the same ISM data set confirms the jump in inflation captured in S&P Global’s Flash May PMI, it’s another reason for the Fed to disappoint market rate-cut expectations.
Second, as we discussed in Friday’s video, given comments by President Trump that China has violated a preliminary trade deal and so much for him being “Mr. Nice Guy,” we could see Trump repeat his recent EU tariff threat with China. While that salvo jump started EU trade negotiations, the initial reaction to that threat from Trump weighed on the market. Should we see Trump follow that playbook with China over the weekend or early next week, we could see the market begin June by giving back some of its outsized May gains.
Next week also brings the April Construction Spending Report, and based on what we see in that data, we’ll revisit our price targets for United Rentals URI and Vulcan Materials VMC as warranted.
Here's a closer look at the economic data coming at us next week:
U.S.
Monday, June 2
· S&P Global Final Manufacturing PMI – May (9:45 AM ET)
· ISM Manufacturing PMI – May (10:00 AM ET)
· Construction Spending – April (10:00 AM ET)
Tuesday, June 3
· JOLTS Job Opening & Quits – April (10:00 AM ET)
· Factory Orders – April (10:00 AM ET)
Wednesday, June 4
· MBA Mortgage Applications Index – Weekly (7:00 AM ET)
· ADP Employment Change Report – May (8:15 AM ET)
· ISM Services PMI – May (10:00 AM ET)
· EIA Crude Oil Inventories – Weekly (10:30 AM ET)
· Fed Beige Book (2 PM ET)
Thursday, June 5
· Challenger Job Cuts – May (7:30 AM ET)
· Initial & Continuing Jobless Claims – Weekly (8:30 AM ET)
· Productivity & Unit Labor Cost (Revision) – Q1 2025 (8:30 AM ET)
· EIA Natural Gas Inventories – Weekly (10:30 AM ET)
Friday, June 6
· Employment Report – May (8:30 AM ET)
· Consumer Credit – April (3 PM ET)
International
Monday, June 2
· China: NBS Manufacturing & Non-Manufacturing PMI - May
· Japan: Jibun Bank Manufacturing PMI – May
· Eurozone: HCOB Manufacturing PMI – May
· UK: S&P Global Manufacturing PMI – May
Tuesday, June 3
· China: Caixin Manufacturing PMI – May
· Eurozone: Inflation Rate - May
Wednesday, June 4
· Japan: Jibun Bank Services PMI – May
· Eurozone: HCOB Services PMI – May
· UK: S&P Global Services PMI - May
Thursday, June 5
· China: Caixin Services PMI – May
· Eurozone: Producer Price Index – April
· Eurozone: European Central Bank Interest Rate Decision
Friday, June 6
· Eurozone: Retail Sales – April
· Eurozone: GDP, Employment Change – Q1 2025
The good news on the earnings front is we have no Pro Portfolio companies reporting next week. Still, we will continue to “connect the dots” as we mine reports from those that are reporting, such as Broadcom (AVGO), Ciena (CIEN), CrowdStrike (CRWD), and Hewlett Packard Enterprise (HPE). We will also capture comments from Pro Portfolio holdings as well as their customers, suppliers, and competitors as they present at investor conferences in the first half of June. Such events next week include:
-- The Bank of America Global Technology Conference
-- The Baird 2025 Global Consumer, Technology, and Services Conference
-- William Blair 45th Annual Growth Stock Conference
Here's a closer look at the earnings reports coming at us next week:
Monday, June 2
· Open: Campbell Soup (CPB), Science Applications (SAIC)
· Close: Credo Technology (CRDO)
Tuesday, June 3
· Open: Dollar General (DG), Ollie’s Bargain Outlet (OLLI), Signet Jewelers (SIG)
· Close: CrowdStrike (CRWD), Hewlett Packard Enterprise (HPE)
Wednesday, June 4
· Open: Dollar Tree (DLTR), Sprinklr (CXM), Thor Industries (THO)
· Close: Five Below (FIVE), PVH (PVH),
Thursday, June 5
· Open: Brown-Forman (BF.B), Ciena (CIEN), Victoria’s Secret (VSCO)
· Close: Broadcom (AVGO), lululemon (LULU), Petco Health & Wellness (WOOF), ServiceTitan (TTAN),
Portfolio Investor Resource Guide
· Economic Data: Here's a List of Links to the Key Economic Data We Closely Watch
· Investing Terminology: 16 Key Terms Club Members Should Know
· 10-Ks: Want to Know About a Stock? Read the Company's Reports
· 10-Qs: Unlock the Numbers and Key Information Behind Your Stock With the 10-Q
· Income Statement: Our Cheat Sheet to Understanding This Financial Document
· Balance Sheet, Cash Flow Statements, and Dividends: How to Know If a Company Is Off-Kilter? Read Its Balance Sheet
· Valuation Metrics: Everyone Wants a Value. Here's How Investors Can Find
· Thematic Investing 101 Webinar
The Portfolio Ratings System
1 - Buy Now (BN): Stocks that look compelling to buy right now.
2 - Stockpile (SP): Positions we would add to on pullbacks or a successful test of technical support levels.
3 - Holding Pattern (HP): Stocks we are holding as we wait for a fresh catalyst to make our next move.
4 - Sell (S): Positions we intend to exit.
ONES
Alphabet GOOGL; $171.74; 1,035 shares; 3.59%; Sector: Communication Services
UPDATE: After getting clobbered along with other tech stocks during the March quarter, Alphabet GOOGL rebounded modestly in April following the company’s March-quarter earnings report that quelled concerns that weighed on the shares. Even after adjusting for the $8 billion unrealized gain on a private investment company investment housed in Alphabet’s Other Income line, it still delivered a head-and-shoulder consensus EPS beat for the quarter led by better-than-expected revenue but also meaningful margin improvement at Google Services and Google Cloud. The only knock we would point out was the modest sequential revenue improvement at Google Cloud, but it was still up a hefty 28% year over year. Alphabet reaffirmed its $75 billion capital spending plan for this year, which should address those constraints. At the same time, it authorized an additional $70 billion for its share repurchase program and upped its quarterly dividend by 5% to $0.21 per share. The combination of 2025 capital spending levels and increases in both the share repurchase program and the dividend send a signal about the company’s confidence in its prospects. In mid-May, Google held its annual Google I/O developer event and the company came out swinging, reminding investors it remains an AI player and, more importantly, showed how it is leveraging AI into search. That led GOOGL shares to rebound in May, rising more than 5%. We recognize the evolving AI landscape and that the growing number of features like those we are seeing in ChatGPT raise questions GOOGL investors haven’t had to face in some time. Our view on Alphabet remains that it would be a mistake to discount its AI position, given the vast quantities of data it can leverage through its search, shopping, advertising, and YouTube businesses. As we continue to look for a smart entry point to build up the Pro Portfolio’s exposure, we will continue to follow the efforts by the Department of Justice to split the company, and subject to the outcome we expect Alphabet will appeal thereby extending the timetable for any impact several years out. If the shares break strong support between $171-$172, the next layer of support clocks in near $159. The first payment of the company’s new $0.21 per share quarterly dividend will be on June 16 to stockholders of record as of June 9.
May Monthly Price Change: 8.1%; Yield: 0.5%
INVESTMENT THESIS: We believe that while search and digital ad dominance are what will carry shares in the near-to mid-term, longer-term it is the company's artificial intelligence "moat" that will provide for new avenues of growth. Exiting the March 2025 quarter, Alphabet reported over 270 million paid subscriptions across YouTube and Google One. YouTube Music and Premium alone reached 125 million subscribers globally. AI is what has made the company's search, video, and targeted ad capabilities best-in-class and is the driving force behind the company's success in voice (Google Home) and autonomous driving (Waymo). Furthermore, we believe it is this AI expertise that will also make the company more prevalent in other industries, including healthcare via its subsidiary Verily, as AI and machine learning continue to disrupt operations across industries. Exiting the March 2025 quarter, across all of its products Alphabet had 0.5 billion users using its Gemini models. Adding to our positive view of the company's future opportunities, we believe that Alphabet's free cash flow generation and solid balance sheet set it apart and are what will allow the company to continue taking chances on far-out ground-breaking and potentially world-changing projects as well as fund capital returns to shareholders. We will continue to monitor advertising spend as well as the competitive landscape for the company’s core Search and Advertising business.
Target Price: Reiterate $200; Rating: One
Panic Point: $145
RISKS: Regulatory risk (data privacy), competition, and macroeconomic slowdown impacting consumers and therefore ad buyer activity.
Amazon AMZN; $205.01; 881 shares; 3.66%; Sector: Consumer Discretionary
UPDATE: Like other tech-related stocks, shares of Amazon AMZN trended lower in April, adding to their cumulative decline for the first four months of the year. That move lower continued as we began May following June quarter guidance that included operating income that was below market expectations despite revenue guidance that bookends consensus expectations. The culprit was the impact of tariffs on Amazon’s North America digital shopping business, however, we also have to recognize that Amazon tends to skew overly conservative with its operating income forecasts. Getting back to that March quarter operating income, we can trace its upside surprise back to a few factors, including Amazon Web Services (AWS) revenue growth outpacing overall revenue growth for the quarter, making that higher margin business a larger portion of the revenue mix. The same can be said about Amazon’s advertising services business, which grew 11% year over year to account for about 9% of March quarter revenue, and its subscription services drove 7.5% of overall revenue for the quarter. All told, those three businesses accounted for more than 35% of March quarter revenue up from roughly 33% in the year-ago quarter. That’s not to dimmish revenue growth and margin expansion at Amazon’s North American or International segments during the March quarter, but rather to highlight how those faster-growing and higher-margin businesses can insulate Amazon’s profits from tariffs. To that end, during the earnings call CEO Andy Jassy called out the $117 billion annual revenue run rate for AWS with the backdrop that more than 85% of the global IT spend is still on-premises, not in the cloud as yet, there is ample room to run. As we moved deeper into May, the shares rebounded in part due to signs the trade standoff between the U.S. and China was thawing. For May in full, AMZN shares climbed nearly 10%. We continue to see Amazon winning consumer and advertising wallet share as well as benefitting from AI and cloud adoption. That led us to pick up some AMZN shares in mid-May. Two-thirds of the way through May Amazon CEO Andy Jassy said the company hasn’t seen any meaningful reduction in consumer spending or an increase in prices as a result of tariffs introduced by Trump earlier this year. Any rollback or elimination of Trump tariffs would lead to Wall Street revisiting H2 2025 expectations for Amazon.
May Monthly Price Change: 11.2%; Yield: 0.0%
INVESTMENT THESIS: We believe the upside will result from Amazon's continued eCommerce dominance, AWS's continued leadership in the public cloud space, and ongoing growth of the company's advertising revenue stream, which feeds off Amazon's eCommerce business. Additionally, we think profitability will continue to improve as AWS and advertising account for a larger portion of total sales as both these segments sport higher margins than the eCommerce operation. While we believe the increasing share of the revenue from these higher margin businesses will be key to driving profitability longer-term, we think margins on eCommerce stand to improve as the company's infrastructure is further built out and economies of scale further kick in. The embedded call option is that management is always looking to enter a new space and generate new revenue streams.
Target Price: Reiterate $260; Rating: One
Panic Point: $170
RISKS: High valuation exposes the stock to volatile swings, eCommerce has exposure to slower consumer spending and competition, management is not afraid to invest heavily, potential headwinds resulting from new eCommerce regulation in India, and management is not scared to invest aggressively for growth, which can at times cause volatile reactions as near-term concerns arise relating to the impact on margins.
American Express AXP; $294.05; 580 shares; 3.46%; Sector: Financial Services
UPDATE: Coming off the almost 10% move lower during the March quarter, American Express AXP shares rebounded off their early April lows to finish the month down modestly. During May they roared back, climbing ~10% to recapture levels last seen in mid-February. Fortunately for us, we scooped up more AXP shared in mid-May, building our exposure to this membership business model-driven company. The company’s March-quarter earnings report showed that powerful differentiation point as roughly 70% of the company’s pre-tax income was derived from net card fees, which climbed 18% year over year. That overshadowed the 5% gain in network volumes and a nice increase in average member spending. Management continues to plan multiple product refreshes this year, but on the topic of increasing card fees we suspect that much like Costco, Amex is only going to do so when the time is right. For Amex that means being able to bring even more value to the membership base, and, in our view, that helps keep retention rates high. Another reason why we like membership business models. Earlier in May, during Berkshire Hathaway Day, Warren Buffett stated the company could hold AXP for several more decades – that tells us that Buffett sees what we see in Amex’s business model. We will continue to monitor consumer spending trends, but when the company presents at the Morgan Stanley U.S. Financials Conference on June 11, we’ll be more interested in what is said about member growth and card refresh efforts. During the March quarter, American Express repurchased 2.3 million common shares at an average price of $297.37, and under its current program, it is still authorized to repurchase another 72.9 million. When Amex reports its June-quarter results, we would not be surprised to learn Amex flexed that program during April.
May Monthly Price Change: 10.4%; Yield: 1.1%
INVESTMENT THESIS: American Express is a globally integrated, membership-driven payments company, providing customers with access to products, insights, and experiences that enrich lives and build business success. The company has four reportable operating segments: U.S. Consumer Services (USCS), Commercial Services (CS), International Card Services (ICS), and Global Merchant and Network Services (GMNS). American Express targets the premium consumer space by continuing to deliver membership benefits that span our customers’ everyday spending, borrowing, travel, and lifestyle needs, expanding its roster of business partners around the globe, and developing a range of experiences that attract high-spending customers. In 2024, the company’s net card fee revenue accounted for 65% of its pre-tax income, which we see providing a differentiated business model that should continue to grow as Amex wins new card members and drives its average fee per card higher.
Target Price: Reiterate $310; Rating: One
Panic Point: $255
RISKS: Slowdown in consumer spending, competition, membership growth, merchant acceptance, lack of new product innovation.
Bank of America Corp. BAC; $44.13; 4,410 shares; 3.95%; Sector: Financial Services
UPDATE: In the Monthly Roundup for February, we shared that continued stock market volatility could weigh on IPO expectations despite the continued growth in transaction filings. That is what unfolded and even though M&A activity perked up, Bank of America BAC slumped further in March and April as deal-making activity continued to slow as tariff uncertainty rattled the stock market. During the company’s March-quarter earnings call, the BofA management team shared that the investment banking pipeline is “healthy,” but clients are waiting on clarity before moving forward with intended transactions. As M&A and IPO activity heated up in May, BAC shares rebounded strongly and we lifted our price target to $50 from $45. We suspect BofA will continue to make inroads against smaller, regional banks allowing continued growth in its overall account base, a lead generator for its wealth management business, and vice versa. However, it is the operating leverage as investment banking activity rebounds that is the greater reason for our owning the shares in the Pro Portfolio. As that activity heats up, we will revisit our price target and rating as needed. Management targets 2% to 3% expense growth this year, and a tight rein on costs could translate into larger stock buybacks, especially if we see an acceleration in investment banking activity. BofA’s next quarterly dividend of $0.26 per share will be paid on June 27 to shareholders of record as of June 6. The bank will report its June quarter results on July 16.
May Monthly Price Change: 10.7%; Yield: 2.4%
INVESTMENT THESIS: Bank of America is one of the world's leading financial institutions, serving individual consumers, small and middle-market businesses, and large corporations with a full range of banking, investing, asset management, and other financial and risk management products and services. The company provides unmatched convenience in the United States, serving approximately 67 million consumer and small business clients with approximately 3,900 retail financial centers, approximately 16,000 ATMs, and award-winning digital banking with approximately 56 million verified digital users. Bank of America is a global leader in wealth management, corporate and investment banking, and trading across a broad range of asset classes, serving corporations, governments, institutions, and individuals around the world. Bank of America offers industry-leading support to approximately 3 million small business households through a suite of innovative, easy-to-use online products and services. The company serves clients through operations across the United States, its territories, and approximately 35 countries. From a reporting perspective, the company's business breaks down as follows: Net Interest Income breakdown: Consumer Banking 57%, Global Banking 23%, Global Wealth & Investment Management 14%, and Global Markets 6%; Income Before Tax breakdown: Consumer Banking 42%, Global Banking 27%, Global Wealth & Investment Management 16%, and Global Markets 15%. Bank of America pays a quarterly dividend of $0.26 per share, up from $0.18 a few years ago.
Target Price: $50; Rating: One
Panic Point: $37
RISKS: Financial markets, fiscal, monetary, and regulatory policies, economic conditions, and credit ratings.
Eaton Corp. ETN; $320.20; 593 shares; 3.85%; Sector: Industrials
UPDATE: After falling 18% in the March quarter, and moving even lower in early April, shares of Eaton ETN rebounded hard in April, and that continued in May. Quarter to date the shares are up more than 15%, easily outpacing the broader market averages and that led us to take some very profitable ETN chips off the table mid-May. While May was a quiet month for Eaton-specific news, we continued to receive a growing number of signals and other announcements related to AI and data center demand as well as the looming electric power shortfall. Deloitte sees U.S. power sector investments reaching $1.4 trillion between 2025 and 2030. This six-year outlay is equivalent to the total capital expenditure of the U.S. power sector over the preceding 12 years, underscoring the challenge and the opportunity that lies ahead. As we see the mix shift move toward AI data centers, we should see Eaton’s dollar per megawatt content rise given greater power density, larger volumes of electrical equipment but also greater cooling requirements. In our view that is the driving story behind the opportunity in Eaton’s shares and one we aim to capture as shareholders. We recognize there will be some modest margin pressure, largely on the company’s Vehicle segment, due to tariffs, but if trade deals emerge and Trump tariffs rolled back that would be another catalyst for the shares. With ample upside to our $400 price target, we continue to rate ETN shares a One. Barring fresh developments that may lead us to revisit that target, as ETN shares approach $360, we may need to revisit our One rating.
May Monthly Price Change: 8.8%; Yield: 1.3%
INVESTMENT THESIS: Eaton is an intelligent power management company that makes products for data center, utility, industrial, commercial, machine building, residential, aerospace, and mobility markets. That business is positioned to capitalize on the megatrends of electrification, energy transition, and digitalization. We see Eaton helping address the power pain point created by data center, EV charging infrastructure, and other drivers of electricity demand. Research estimates that data center power demand will grow 160% by 2030, accounting for 3%-4% of global power up from 1%-2% today. Data centers will use 8% of U.S. power by 2030, compared with 3% in 2022.
Target Price: Reiterate $400; Rating: One
Panic Point: $274
RISKS: Raw material costs, labor costs, end market volatility, government legislation.
Elastic N.V. ESTC; $80.87; 1,965 shares; 3.20%; Sector: Consumer Cyclical
UPDATE: Shares of Elastic ESTC rebounded in May along with the market, but ultimately ended lower and back near our original buy points last October following the company’s April quarter earnings report this week. Despite the company delivering a consensus-topping April-quarter earnings report, issuing better-than-expected EPS guidance for the coming year, and multiple metrics moving in the right direction, we can trace the slump in the shares to management’s overly conservative top-line forecast for the coming year. We characterize its guidance as such given the continued expansion in its overall customer base, but notably for its Gen AI customers, and rising contract values that led to record remaining performance obligations and deferred revenue. At the same time management admitted its guidance was likely overly cautious when it shared, “Although we did not see macro impacts beyond the U.S. public sector in Q4, we extrapolated constraints that we saw in the U.S. public sector to potentially extend to our broader business. This is the largest factor affecting our revenue guidance range.” So, while we trimmed our price target to $120 from $140, adopting a more conservative stance similar to the one we’ve adopted with other holdings in recent weeks, we will look to take advantage of this disconnect between the Elastic share price and improving fundamental revenue, margin and EPS picture for the company’s business.
May Monthly Price Change: -6.2%; Yield: 0.0%
INVESTMENT THESIS: As digital transformation drives mission-critical business functions to the cloud, Elastic N.V. brings the portfolio exposure to search AI adoption across IT and enterprise business lines as companies look to drive productivity. Elastic bills itself as the Search AI company and its Elastic Search AI Platform as a hosted, managed service across major cloud providers, including Amazon Web Services (AWS), Google Cloud, and Microsoft’s Azure in more than 55 public cloud regions globally. Customers can also deploy Elastic’s platform across hybrid clouds, public or private clouds, and multi-cloud environments. What we like even more about this is Elastic’s subscription-based business model, which accounts for just over 93% of its total revenue stream. As we’ve discussed before with other companies, this affords not only good visibility but also predictable cash flow and earnings. Moreover, the gross margins associated with the subscription business are above 80%, which helps explain the rising margin profile and EPS as that business has come to account for a greater percentage of overall revenue. When it comes to potential risks, one sign that would lead us to reconsider owning the shares would be if either Elastic’s customer count or its subscription revenue per customer stalled. Another item we’ll be watching because of Elastic’s geographic mix, with 40% of its revenue outside of the U.S., is the dollar and its corresponding foreign exchange impact.
Target Price: Reiterate $120; Rating: One
Panic Point: Under revision
RISKS: Enterprise software spending, AI adoption, competitive dynamics, foreign exchange risk.
Marvell Technology MRVL; $60.19; 2,845 shares; 3.47%; Sector: Technology
UPDATE: Shares of Marvell MRVL were modestly higher in May even after the mid-single-digit drop they posted following the company’s earnings report this week. In our view, it was a perfectly good April quarter, with top and bottom-line results that edged out Wall Street consensus forecasts. The company also delivered current quarter guidance for EPS of $0.62-$0.72 on revenue of $1.9 billion-$2.1 billion, bookending the market’s expectation for $0.66 and $1.98 billion, respectively. Typical Marvell. However, providing context for those guidance figures tells the more powerful story that is unfolding at Marvell. At the midpoint of its revenue guidance, Marvell’s top line would be up some 57% year over year as it continues to benefit from AI and data center demand as well as the ramp of its custom AI silicon business. The continued rebound in its Carrier Infrastructure and Enterprise Networking businesses and the maturing of Marvell’s custom AI silicon business, much like the maturing we are seeing with Nvidia’s Blackwell business, should lead margins higher. That combination should drive another dramatic year-over-year jump in Marvell’s EPS compared to the $0.30 posted for the July 2024 quarter. That perspective, those figures, and their implied growth rates keep us bullish on Marvell. It should also push back on questions surrounding Marvell’s custom AI silicon business, and reaffirm the reasons behind Cantor Fitzgerald’s recent mea culpa on the shares. Coming up, we have Marvell’s upcoming custom AI silicon event on June 17, which should shed far more light on that business and its growth prospects. For now, we’ll keep our $115 price target, and revisit it, as needed, after that event. As MRVL shares settle in the coming days, in keeping with our One rating we will look to pick up some additional shares given what we see ahead in the coming quarters vs. the share price exiting May.
May Monthly Price Change: 3.1%; Yield: 0.4%
INVESTMENT THESIS: Marvell is a fabless supplier of high-performance standard and semi-custom infrastructure semiconductor solutions. These solutions power the data economy, enabling the data center, carrier infrastructure, enterprise networking, consumer, and automotive/industrial end markets. With roughly 75%-80% of Marvell's revenue stream tied to digital infrastructure, we see it continuing to benefit from rising content consumption and creation. Pointing to that rising demand that necessitates network densification and the build of digital infrastructure, Ericsson sees global monthly average usage per smartphone reach 46 gigabytes (GB) by the end of 2028 vs. 19 GB in 2023 and 15 GB in 2022.
Target Price: Reiterate $115; Rating: One
Panic Point: $50
RISKS: Technology risk, customer risk, competition risk, reliance on manufacturing partners, and supply chain constraints.
Morgan Stanley MS; $128.03; 1,462 shares; 3.80%; Sector: Financial Services
UPDATE: In the Monthly Roundup for March, we discussed the cooling outlook for IPO activity following the lower-than-expected pricing of CoreWeave’s initial share offering. After that pricing and given market turmoil and uncertainty erupting from Trump tariffs, both Klarna and StubHub announced they would both hold back their IPOs. During Morgan Stanley's MS March earnings call, the management team noted robust M&A pipelines, with activity driven by financial sponsors and mid-size deal growth. While we can surmise that near-term deal activity is stalled given market volatility and uncertainty, the firm's message was that underlying demand for strategic advice and capital raising remains strong. After moving sideways in April, renewed investment banking activity and market volatility that bodes well for trading revenue lifted MS shares more than 10% in May. As we witnessed the improvement in M&A activity and return of the IPO market, we lifted our MS price target to $140 from $120. Based on what we see in the coming weeks on both the IPO and M&A front, we’ll revisit that new target as needed. We have some room to round out the Pro Portfolio’s position size, and while our rating is a One, given the existing position size it means we need to be more selective with our next and potentially last bit of shares. We see strong support near $117, which is the intersection of the 50-day and 200-day moving averages.
May Monthly Price Change: 10.9%; Yield: 2.9%
INVESTMENT THESIS: Morgan Stanley reports in three business segments: Institutional Securities (42% of trailing 12-month revenue, 38% of trailing 12-month Income Before Tax), Wealth Management (48%, 55%) and Investment Management (10%, 6%). While the IPO window has yet to reopen, the potential IPO class for 2025 continues to build with recent additions including Klarna and StubHub. That would be a boon to private equity firms and others that have been nursing IPO candidates during the dark period and a positive for Morgan Stanley's investment banking business. Expected deregulation under the Trump administration is a potential catalyst for Morgan's M&A business. Meanwhile, folks continuing to be behind in retirement savings bodes well for Morgan Stanley's wealth management business in the coming quarters while continued market volatility bodes well for its equity trading business.
Target Price: $140; Rating One
Panic Point: $100
RISKS: Market and interest rate risk, credit risk, country risk, and operational risk, including cybersecurity.
Nvidia Corp. NVDA; $135.13; 1,535 shares; 4.21%; Sector: Technology
UPDATE: Following their cumulative move lower during the March quarter, shares of Nvidia NVDA remained volatile throughout April but ultimately finished the month modestly higher. However, Nvidia shares moved sharply higher in May as Big Tech continued to reaffirm 2025 capital spending plans, newly public CoreWeave upped its spending budget, and both Taiwan Semiconductor and Foxconn delivered favorable AI and data center figures. Those developments and others, including the major data center developments in Saudi Arabia and the UAE, laid the groundwork for Nvidia’s consensus-topping April quarter results. In response, we boosted our NVDA price target to $175 from $160, and we weren’t the only ones to do so. We continue to see NVDA well positioned as AI adoption accelerates and the subsequent demand for AI factories keeps us bullish on the shares. CEO Nelson Huang estimated that by the end of the decade, and potentially sooner, data center build-out should top $1 trillion. We’ll continue to follow the data and signals, including upcoming monthly revenue reports from Taiwan Semi and Foxconn as well as AI and data center capex comments in the upcoming Q2 2025 earnings season. Part of that will be the continued adoption of AI across the enterprise as well as in consumer electronic devices. Turning to Nvidia’s guidance, it sees July quarter revenue between $44.10 billion and $45.90 billion, up 50% year over year at the midpoint, which reflects continued sequential growth across all of its platforms. In the all-important Data Center business, the continued ramp of Blackwell will be partially offset by a decline in the businesses’ China revenue as the H20 ban delivers a loss of about $8 billion for the quarter. Management said it is still evaluating options to supply data center compute products compliant with the U.S. government's revised export control rules. From a market opportunity perspective, losing access to the China AI accelerator market, which Nvidia believes will grow to nearly $50 billion, would be a lost opportunity. We expect to get more color on Nvidia’s business when management presents at the BofA Global Technology Conference on June 4, the Rosenblatt Virtual AI Summit and NASDAQ Investor Conference on June 10, and GTC Paris at VivaTech on June 11.
May Monthly Price Change: 24.1%; Yield: 0.0%
INVESTMENT THESIS: Nvidia is well positioned to benefit from ramping AI and data center spending. The company pioneered accelerated computing to help solve the most challenging computational problems. Nvidia is now a full-stack computing infrastructure company with data-center-scale offerings that are reshaping the industry. The company's full stack includes the foundational CUDA programming model that runs on all Nvidia GPUs, as well as hundreds of domain-specific software libraries, software development kits, or SDKs, and Application Programming Interfaces, or APIs. This deep and broad software stack accelerates the performance and eases the deployment of Nvidia accelerated computing for computationally intensive workloads such as artificial intelligence, model training and inference, data analytics, scientific computing, and 3D graphics, with vertical-specific optimizations to address industries ranging from healthcare and telecom to automotive and manufacturing. Nvidia reports in two business segments: Compute & Networking and Graphics. The Compute & Networking segment (78% of revenue, 85% of operating income) is comprised of Data Center accelerated computing platforms and end-to-end networking platforms, including Quantum for InfiniBand and Spectrum for Ethernet; NVIDIA DRIVE automated-driving platform and automotive development agreements; Jetson robotics and other embedded platforms; Nvidia AI Enterprise and other software; and DGX Cloud software and services. The Graphics segment (22% of revenue, 15% of operating income) includes GeForce GPUs for gaming and PCs, the GeForce NOW game streaming service and related infrastructure; Quadro/NVIDIA RTX GPUs for enterprise workstation graphics; virtual GPU, or vGPU, software for cloud-based visual and virtual computing; automotive platforms for infotainment systems; and Omniverse Enterprise software for building and operating metaverse and 3D internet applications.
Target Price: $175; Rating One
Panic Point: $100
RISKS: Market and interest rate risk, credit risk, country risk, and operational risk, including cybersecurity.
Qualcomm Inc. QCOM; $145.20; 1,220 shares; 3.60%; Sector: Technology
UPDATE: Closing out April, Qualcomm QCOM shares were down just over 3% on a year-to-date basis, outperforming the 9.65% drop posted by the Nasdaq Composite over the same period. The shares were little changed during May, which means they lagged the market, which tends to happen during the seasonably weakest quarter for the company’s smartphone business. We’ll remind members that our play with Qualcomm is the valuation re-think as the company reduces its exposure to the smartphone market and Apple by leaning into the Android market and ramping automotive, AI PC, and IoT revenue. Developments at Google’s 2025 I/O developer event on the IoT front and reaffirming comments on the PC industry shift to AI PCs from HP, Best Buy, and Dell this week tell us Qualcomm’s strategy is on the right track. While we wait for June revenue reports from Taiwan Semiconductor and Foxconn, we’ll be listening for updated expectations for the smartphone market as well as PC and other key Qualcomm end markets when companies present at investor conferences in the first half of June. As Qualcomm’s strategy shows progress in the coming quarters, we should see that reflected in stock price. We’ll also mark our calendars for Apple’s WWDC 2025 keynote on June 9. We last picked up shares at $141.89 in mid-April and if QCOM returned to that level, all things equal, we’d be inclined to pick up additional shares.
May Monthly Price Change: -2.2%; Yield: 2.5%
INVESTMENT THESIS: Qualcomm focuses on foundational technologies for the wireless industry, including 3G (third generation), 4G (fourth generation), and 5G (fifth generation) wireless technologies and processor technologies including high-performance, low-power computing, and on-device artificial intelligence technologies. As a connected processor company, its technology roadmap aims to enable the connected intelligent edge (the next generation of smart devices) across industries and applications beyond handsets, including automotive and the Internet of Things (IoT). Qualcomm has three reportable segments: QCT (Qualcomm CDMA Technologies) semiconductor business, which develops and supplies integrated circuits and system software based on 3G/4G/5G and other technologies for use in mobile devices; automotive systems for connectivity, digital cockpit, and ADAS/AD; and IoT including consumer electronic devices; industrial devices; and edge networking products. QCT accounts for 80%-85% of revenue. QTL (Qualcomm Technology Licensing) licensing business grants licenses or otherwise provides rights to use portions of the company's intellectual property portfolio, which includes certain patent rights essential to and/or useful in the manufacture and sale of certain wireless products. QTL accounts for ~15% of Qualcomm's revenue but contributes a greater portion of the company's operating income. Our focus on QCOM shares is revenue diversification as part of management's intended strategy to lessen its reliance on the smartphone market, by tapping into the AI PC, IoT, and automotive chip markets. We see this unfolding over the next few years, which should lead Wall Street to revisit how it values the shares. It is that opportunity we aim to capture by owning the shares over the longer term.
Target Price: $180; Rating: One
Panic Point: $129
RISKS: Customer risk, technology advancement, competition risk, third-party supplier, and manufacturing partner risk.
ServiceNow NOW; $1,011.09; 193 shares; 3.96%; Sector: Technology
UPDATE: After peaking in January, shares of ServiceNow NOW, like many other tech companies, were hard hit during the March quarter. During February and March, we used the pullback to build the Po Portfolio’s position size, and in April that effort was rewarded following the company’s impressive March-quarter earnings report. Leading up to that report, we shared multiple data points about continued, if not accelerating AI adoption as companies and other institutions sought to drive a combination of productivity and savings. The company’s March quarter showcased the continued adoption of AI and cloud, which benefited pricing, and margins and grew its subscription revenue. NOW shares continued to chug higher in May, leaving them up more than 25% for the first two months of Q2 2025. Reasons for that continued move include ServiceNow announcing an expanded partnership with Nvidia for intelligent AI agents, Zoom integrating with ServiceNow CRM and IT Service Management platforms, and Amazon Web Services joining ServiceNow’s Workflow Data Network ecosystem. Those announcements reaffirm ServiceNow’s position in the enterprise while AI adoption and what it means for pricing and margins keep us bullish on the shares. However, because we are prudent investors, we did book some of that sharp move higher in mid-May. For the June quarter, ServiceNow sees subscription revenue coming in at $3.03 billion-$3.04 billion, which implies overall revenue near $3.1 billion. The lift in that outlook is backed by the company’s current remaining performance obligations (cPRO) of $10.3 billion and remaining performance obligations (RPO) of $22.3 billion exiting the March quarter. Those same figures, which were up 19% and 23%, respectively, on a year-over-year basis, also back the higher subscription revenue outlook of $12.64 billion‑$12.68 billion for this year. Following ServiceNow’s presentation at the BofA Global Technology Conference on June 4, we’ll look to revisit our NOW price target as needed.
May Monthly Price Change: 5.9%; Yield: 0.0%
INVESTMENT THESIS: The addition of ServiceNow adds exposure to the enterprise as it deploys AI-enabled solutions across its enterprise workflow platform. The company’s “Now Platform” is a cloud-based solution with embedded AI and machine learning (ML) capabilities that help unify and digitize workflows, driving productivity. At the heart of it, the company’s platform automates workflows across an entire enterprise by connecting disparate departments, systems, and silos in a seamless way to unlock productivity. ServiceNow counts more than 8,100 global customers, including 85% of the Fortune 500, with 97% of its revenue from subscriptions that have notched a 98% renewal rate. During the March 2025 quarter, ServiceNow also announced plans to acquire Moveworks, which offers front-end AI assistant and enterprise search technology, and Logik.ai, which provides AI-powered, and composable configure, price, and quote solutions for sales teams. We see these moves augmenting its offering and helping pave the way for further adoption of AI and subscription-based revenue.
Target Price: Reiterate $1,100; Rating: One
Panic Point: $800
RISKS: Industry and economic risk, competition and competitive pressures, and acquisition risk.
United Rentals URI; $708.38; 270 shares; 3.89%; Sector: Industrials
UPDATE: Throughout the March quarter, whether it was favorable data points on infrastructure construction projects from Tudor Perini, similar comments made at Eaton’s 2025 Investor Day, or year-over-year gains in nonresidential construction spending, shares of United Rentals URI moved lower. We took advantage of that in early March when the Pro Portfolio scooped up additional shares at $612.69. We continued to heed favorable signals for the non-residential construction market in April, and our patience paid off with URI's consensus-topping March-quarter results. Management reiterated its 2025 guidance for total revenue between $15.6 billion and $16.1 billion and adjusted EBITDA of $7.2 billion to $7.45 billion. Recent comments from Dycom and others that are benefitting from the construction of new data centers as well as infrastructure programs and other drivers of non-residential construction keep us bullish on URI shares headed into the company’s seasonally strongest time of the year. Quarter to date, URI shares are up double-digits, following their more than 10% rise in May, but with nine months of domestic construction spending data yet to be reported, as the figures for April, May, and June are released, we’ll revisit management’s guidance as well as our $800 target. We’ll also factor in what other companies serving the construction industry have to say over the coming weeks. On the March earnings call, management discussed the re-armed $1.5 billion share repurchase authorization, sharing expectations to fully utilize it by the end of the March 2026 quarter. For this year, including the $250 million repurchased in the March 2025 quarter, management targets repurchasing $1.5 billion in stock. Simple math tells us that means a big step up in activity over the coming quarters to hit that target. As the company delivers on that program, we’ll factor that impact on its bottom line into our thinking as well.
May Monthly Price Change: 12.2%; Yield: 1.0%
INVESTMENT THESIS: United Rentals, the largest equipment rental company in the world, operates throughout the United States and Canada, and has a limited presence in Europe, Australia, and New Zealand. It serves industrial and other non-construction; commercial (or private non-residential) construction; and residential construction. Industrial and other non-construction rentals represented approximately 50% of rental revenue, primarily reflecting rentals to manufacturers, energy companies, chemical companies, paper mills, railroads, shipbuilders, utilities, retailers, and infrastructure entities; commercial construction rentals represented approximately 46% of rental revenue, primarily reflecting rentals related to the construction and remodeling of facilities for office space, lodging, healthcare, entertainment, and other commercial purposes; and residential rentals around 4% of revenue. We see the company benefiting on three fronts — the seasonal uptick in construction spending; the release of funds and projects associated with the five-year Biden Infrastructure bill; and the company's nip-and-tuck acquisition strategy that should further enhance its geographic footprint.
Target Price: Reiterate $800; Rating: One
Panic Point: $580
RISKS: Industry and economic risk, competition and competitive pressures, and acquisition risk.
Universal Display OLED; $145.35; 1,388 shares; 4.03%; Sector: Technology
UPDATE: Despite the continued move lower in April for Universal Display OLED shares, we continued to see signs of the shift toward organic light-emitting diode displays across smartphones, monitors, TVs, and other applications. Research firm Omdia sees organic light-emitting diode adoption in smartphones growing mid-single digits this year to 848 million units; tablets, laptops, and monitors up 16% year-over-year to 27 million units; and TVs using the display technology rising 4.5% year-over-year to 7.1 million units. Those figures as well as adoption in the auto market and others keep us long-term bullish on OLED shares even after their double-digit move higher in May. In early May, Universal reported consensus-topping quarterly results but once again issued arguably conservative guidance when measured against organic light emitting diode market expectations, including those from Omdia above, but also comments from LG Display and Samsung. Alongside Universal’s earnings report, management shared it reached a critical milestone with its blue solution. This is key because much like with light-emitting diodes (LED), commercialized blue rounds out all three primary colors but also blue is the gateway to white organic light-emitting diodes. While we are not ones to jump the gun, we would point out that was one of the final hurdles for the LED market to attack the general lighting market. This bodes well not only for materials demand for Universal, but it will likely trigger negotiations for its royalty and licensing fee segment that carries significantly higher margins. It also reaffirms our long-term stance on OLED shares. Mid-May, noted Bloomberg Apple follower Mar Gurman discussed the upcoming “renaissance” in the company’s product offering, one that could “deliver a number of promising new devices... in time for the iPhone’s 20-year anniversary.” That includes Apple’s first foldable iPhone. Other reports from Business Korea indicate Samsung Display has developed a foldable display that has a nearly invisible display crease. Down the middle of a folding phone’s inner screen – along the hinge where it folds – is a crease that you can see and feel on all existing consumer models. The same Business Korea report indicates the Apple foldable could begin in the second half of 2026. We’ve talked about other end markets adopting that display technology, but even we were surprised to learn United Airline is using it as part of its newly announced United Elevated interior that will feature 4K organic light-emitting diode seatback screens. In doing so, United joins the ranks of other airlines, including Qantas, Qatar, Icelandair, Saudi Arabian Airlines, and EgyptAir, using the Astrova in-flight system from Panasonic. As clarity on the trade front comes, we will revisit what that means for market segments that are driving the adoption of organic light-emitting diodes. At the same time, we will also monitor demand signals from companies involved in the supply chain for those products. Meanwhile, given the share price levels in early May, we would not be surprised to learn Universal tapped its new $100 million share repurchase program during the current quarter. As we prepare to enter the seasonally stronger time of year for Universal’s end markets, be sure to market your calendar for June 30, the date on which the company will pay its next quarterly dividend of $0.45 will be paid on June 30 to shareholders of record on June 16.
May Monthly Price Change: 14.1%; Yield: 1.3%
INVESTMENT THESIS: Universal Display focuses on the development and commercialization of organic light-emitting diode (OLED) technologies and materials for use in display and solid-state lighting applications. OLED displays are capturing a growing share of the display market, especially in the mobile phone, television, monitor, wearable, tablet, notebook, personal computer, augmented reality (AR), virtual reality (VR), and automotive markets. This adoption reflects advantages over competing display technologies concerning power efficiency, contrast ratio, viewing angle, video response time, form factor, and manufacturing cost. Universal Display's business strategy is to develop new OLED materials and sell existing and new materials to product manufacturers for display applications, such as mobile phones, televisions, monitors, wearables, tablets, portable media devices, notebook computers, personal computers, and automotive applications, and specialty and general lighting products. The company also looks to license its OLED material, device design, and manufacturing technologies to those manufacturers. As such, Universal Display has a significant portfolio of proprietary OLED technologies and materials with more than 5,500 patents issued and pending worldwide.
Target Price: Reiterate $200; Rating: One
Panic Point: $125
RISKS: Patent and Intellectual property protection; maintaining OLED manufacturing and customer relationships; technology risk; market risk.
Vulcan Materials Company VMC; $265.07; 613 shares; 3.29%; Sector: Building Materials
UPDATE: The double-digit gain in April notched by shares of Vulcan Materials VMC more than offset their Q1 2025 decline, landing them back in the black through the first four months of 2025. The shares were up and down during May, something we attribute to housing-related headlines but closed the month higher as we head into more favorable construction weather. Quarter to date, VMC shares are up low double digits, placing them well ahead of the S&P 500. We continue to see the housing market as a headwind for Vulcan given affordability factors and economic uncertainty. However, infrastructure spending and private non-residential construction, such as data centers and other buildings, remain a very nice tailwind for construction activity. Paired with opportunistic but disciplined pricing, we see Vulcan’s adjusted EBITDA expanding meaningfully during its seasonally strongest quarters. For now, we’re going to keep our VMC target at $310. We will review that target as monthly construction spending data is reported and we collect more data points from others in and around the sector. Recent comments from specialty contractor Dycom were very supportive of our VMC thesis. When VMC shares pass $270 on a sustained basis, barring any new data, we may need to revisit our One rating subject to what we see in the April Construction Spending report out early next week. Vulcan will pay its quarterly cash dividend of $0.49 per share on June 6 to shareholders of record as of May 23.
May Monthly Price Change: 1.0%; Yield: 0.7%
INVESTMENT THESIS: Vulcan Materials operates primarily in the U.S. and is the nation's largest supplier of construction aggregates (primarily crushed stone, sand, and gravel), a major producer of asphalt mix and ready-mixed concrete, and a supplier of construction paving services. Its products are the indispensable materials used in building homes, offices, places of worship, schools, hospitals, and factories, as well as vital infrastructure including highways, bridges, roads, ports and harbors, water systems, campuses, dams, airports, and rail networks. Ramping spending associated with the Biden Infrastructure Law should drive demand for Vulcan's products over the coming years. Vulcan has historically complemented its organic growth prospects by acquiring businesses to expand its geographic reach and product scope. Since 2014, the company has acquired more than two dozen companies, including the 2021 acquisition of U.S. Concrete. That combination has allowed the company to deliver steady top and bottom-line growth over the last decade, with only a modest decline when the pandemic hit in 2020.
Target Price: Reiterate $310; Rating: One
Panic Point: $225
RISKS: General economic and business conditions; dependence on the construction industry; timing of federal, state, and local funding for infrastructure; changes in the level of spending for private residential and private nonresidential construction.
TWOS
Apple AAPL ; $200.85; 825 shares; 3.35%; Sector: Technology
UPDATE: Apple AAPL shares moved lower during April amid tariff speculation, and we saw that uncertainty weigh on Apple’s June-quarter guidance despite reporting consensus-topping March-quarter results. That report confirmed the positive mix shift associated with Apple’s higher margin Services business, and we expect that trend to continue in the current quarter as it tends to be the seasonally weakest for smartphone demand. We attribute that in part to falling several months after Apple introduced its latest iPhone models and more than a few months before introducing its next ones. While Apple will look to minimize the impact of tariffs by flexing its world-class supply chain, management conceded there will be some margin impact on its Product business. Toward the end of May, President Trump demanded Apple and other smartphone companies like Samsung make their phones in the United States or face a 25% tariff. Over the last few years, Apple has been working to diversify its production capabilities and expectations where it would use India and part of South America given their lower tariff base compared to China to furnish products to the U.S., while its China facilities continued to serve other markets. While we can understand Trump’s motivations, the reality is a 25% tariff would likely be cheaper than manufacturing iPhones and other products in the U.S. The sum of those developments in May led Apple shares to move lower during the month. As we said in our April Monthly Roundup, tariff uncertainty will likely keep AAPL shares restrained near-term and that was a reason for us to maintain our Two rating. With a month to go in the company’s weakest quarter, we’ll maintain that rating as we prepare for what Apple will unveil on June 9 as it kicks off WWDC2025. Candidly, we are not expecting anything oh-so revolutionary to be shared at that event, but we will keep an open mind. The longer-term play for us with Apple is the upgrade cycle for its existing install base, one that should be aided by Apple continuing to update and upgrade Apple Intelligence.
May Monthly Price Change: -5.5%; Yield: 0.5%
INVESTMENT THESIS: While we acknowledge that near-to-midterm performance remains heavily influenced by iPhone sales, the dynamic is shifting as investors finally place greater emphasis on Services growth. We are bullish on the 5G upgrade cycle and believe longer-term upside will continue to come as Services revenue grows its share of overall sales. Services provide for a recurring revenue stream at higher margins, a factor that serves to reduce earnings volatility while allowing for a higher percentage of sales to fall to the bottom line; as a result, we believe that Services growth and the installed base, are much more important than how many devices the company can sell in each 90-day period. In addition to improved profitability, we also believe the transparent nature of this revenue stream will demand an expanded price-to-earnings multiple as segment sales grow. Furthermore, we believe that Apple's desire to push deeper into the healthcare arena will help make its devices invaluable as more life-changing features are added and the company works to democratize health records.
Target Price: Reiterate $235; Rating: Two
Panic Point: $177
RISKS: Slowdown in consumer spending, competition, lack of new product innovation, elongated replacement cycles, failure to execute on Services growth initiative.
Axon Enterprise AXON; $750.36; 168 shares; 2.55%; Sector: Aerospace & Defense
UPDATE: In late February we called Axon Enterprise AXON up to the Pro Portfolio from the Bullpen, starting the new position at $496.31 and we built that out further during March. Following the company’s beat-and-raise March-quarter earnings report we lifted our price target to $700 from $625. Annual recurring revenue during the March quarter grew 34% year over year to $1.1 billion, and exiting the quarter, the company’s deferred revenue topped $1 billion, while its future contracted bookings rose to $9.9 billion compared to $7.0 billion exiting the year-ago quarter. That combination led Axon to lift its 2025 guidance to $2.60 billion to $2.70 billion in revenue, up from $2.55 billion to $2.65 billion, and boost its adjusted EBITDA forecast to $650 million to $675 million from $640 million to $670 million. In mid-May, coming off Axon’s presentation at the JPMorgan Global Technology, Media, and Communications Conference, we lifted our price target again, putting it at $750. Shortly thereafter we took advantage of the continued move higher in AXON to lock in a slice of big gains for this position. As we move through Axon’s other upcoming investor conference presentations in early June, we’ll revisit our new price target. Announced AI program wins will be another catalyst for us to revisit that target as well. We see that AI offering as a natural building block to Axon’s body camera and cloud/software businesses, and one that should drive favorable margin and pricing dynamics in the coming quarters. Near-term, however, while AXON shares have been a champ for the Pro Portfolio, with an almost 40% rise quarter to date, and the shares near our current $750 target, we reiterate our Two rating.
May Monthly Price Change: 22.3%; Yield: 0.0%
INVESTMENT THESIS: Axon Enterprise develops, manufactures, and sells conducted energy devices and cloud-based digital evidence management software designed for use by law enforcement, corrections, military forces, private security personnel, and private individuals for personal defense. The company operates in two segments: Taser (recently renamed Connected Devices) and Software & Sensors (recently renamed Software & Services). Taser develops and sells CEDs used for protecting users and virtual reality training. Software & Sensors manufactures fully integrated hardware and cloud-based software solutions such as body cameras, automated license plate reading, and digital evidence management systems. Axon delivers its products worldwide and gets most of its revenue from the United States. According to Mordor Intelligence, the wearable, and body-worn cameras market on its own was valued at $1.62 billion in 2020 and is expected to reach $424.63 billion by 2026. Public safety organizations are increasingly adopting cloud solutions, leading to significant spending in this area. The digital spending in public safety is projected to reach $201 billion by 2027.
Target Price: Reiterate $750; Rating: Two
Panic Point: $560
RISKS: Manufacturing and supply chain, competitive factors, government regulation, technology change.
Costco Wholesale COST; $1,040.18; 187 shares; 3.97%; Sector: Consumer Staples
UPDATE: Costco COST shares have been a steady performer for the Pro Portfolio so far this year given their climb through the first five months of the year. Closing out the month of May, COST shares are up more than 10% year-to-date, nearly double the corresponding move for the S&P 500. In response to the membership warehouse company’s better-than-expected May-quarter results, that led its shares to finish May on a strong note, we reiterated our $1,150 price target and our Two rating. Our thesis behind our position in Costco remains unchanged – we continue to see the company winning consumer wallet share while its higher-margin membership fee revenue stream benefits from last year’s price increase and the company’s expanding footprint. As Costco continues to reap the benefits of last year’s membership price increase it should help minimize the impact of tariffs on Costco’s business even as the company, like others, looks to source more domestic product and that from lower tariff geographies. The company targets 914 worldwide warehouse locations by the end of the current quarter, making it a relatively safe bet it will continue to deliver year-over-year sales gains and grow that high-margin membership fee revenue stream. In other words, business as usual. As Costco delivers forthcoming monthly revenue reports, as we’ve done in the past, we’ll revisit our price target and rating as needed.
May Monthly Price Change: 4.6%; Yield: 0.5%
INVESTMENT THESIS: We like Costco's long-term prospects, driven by a club-based operating model that focuses on volumes, not margins, and therefore offers its customers a value proposition of everyday low prices. The strength of this model has created an incredibly loyal customer base with low churn and continued share gains in both bricks-and-mortar and e-commerce. This is a global concept, evidenced by the strength of sales both in the U.S. and abroad, which includes an emerging China opportunity. We see the company's membership model as a key differentiator vs. other retailers and its plans to open additional warehouse locations in the coming quarters should drive retail volumes and the higher-margin membership fee income as well. We also appreciate management's approach to capital returns and their willingness to return cash when it is in excess on the balance sheet.
Target Price: Reiterate $1,150. Rating: Two
Panic Point: $900
RISKS: Inability to pass through higher costs, fuel prices, weaker consumer, and membership churn.
Dutch Bros BROS; $72.20; 2,370 shares; 3.47%; Sector: Consumer Cyclical
UPDATE: Following their 18% move higher during the March quarter, shares of Dutch Bros BROS finished April down modestly before roaring back in May following quarterly results that included better-than-consensus top-line and bottom-line results as well as reaffirmed guidance for 2025. That led us to reiterate our $85 target for BROS shares and shortly thereafter take some profitable BROS chips off the table. Year to date, BROS shares are up more than 30%, making them a significant outperformer relative to the overall market. Exiting the quarter, Dutch Bros had 1,012 locations, plans to add 130 more shops this year, and reiterated its target of 2,029 by 2029. For context, Starbucks had more than 17,000 locations across the United States, exiting the March quarter. That reaffirms our view that Dutch Bros has ample room to expand its footprint in the coming years without risking oversaturation, and the targeted food rollout for 2026 should be an added top-line driver. Looking at the technicals, the stock trades with a modest uptrend but has recently encountered resistance at the $74 level. Once that is breached to the upside there is a clear shot at all-time highs around the $86 level. But given the huge bounce off the 200-day moving average in April near $48 the stock is still modestly overbought on a long-term (weekly) chart. The next updates from Dutch will be when management presents at William Blair’s 45th Annual Growth Stock Conference on June 3 and at Baird’s 2025 Global Consumer, Technology & Services Conference on June 5. Based on what we learn, we’ll revisit our price target and rating as needed.
May MonthlyPrice Change: 20.9%; Yield: 0.0%
INVESTMENT THESIS: Dutch Bros is an operator and franchisor of drive-thru shops that focus on serving high-quality, hand-crafted beverages with unparalleled speed and superior service. Coffee-based beverages make up ~50% of the menu mix, and ~25% of the menu mix is based upon the company’s proprietary Blue Rebel energy drink, which is highly customizable with flavors and modifiers and can be served blended or over ice. The energy platform helps unlock the afternoon daypart and broadens the company’s appeal. The remaining 25% of the menu mix is a wide variety of teas, lemonades, sodas, and smoothies. The company’s west-to-east expansion is a time-tested strategy that should drive revenue and EPS growth over the next several years. Leveraging that footprint expansion and low-single-digit comp sales growth, management reiterated its long-term guidance of around 20% annual revenue growth. Helping support that guidance, the company confirmed it will introduce an expanded food menu in 2026. Dutch Bros is slated to enter the consumer-packaged goods (CPG) space in a deal with Trilliant Food & Nutrition.
Target Price: Reiterate $85; Rating: Two
Panic Point: $53
RISKS: Commodity risks, labor costs, interest rate risk, inflation.
First Trust Nasdaq Cybersecurity ETF CIBR; $71.82; 2,028 shares; 2.94%; Sector: Cybersecurity
UPDATE: Each time we note ripped-from-the-headlines confirmation points for the Pro Portfolio and its underlying strategy, one constant is the signals for cybersecurity demand. Artificial intelligence will super-charge familiar threats in 2025, putting new wrinkles on old security challenges such as phishing, insider threats, and ransomware. Research firm Gartner expects that cybersecurity spending will increase 15% in 2025, from $183.9 billion to $212 billion. We continue to favor the diversified exposure CIBR brings to the Pro Portfolio, which complements the cybersecurity efforts at Elastic, Microsoft, and Alphabet. During May, CIBR shares gained more ground, making them a positive contributor to the Pro Portfolio’s performance during the month. Quarter to date, the shares are up over 12%, well ahead of the S&P 500 and nicely ahead of the Nasdaq Composite. Viewed from a different angle, CIBR shares recently hit all-time highs marking a more than 30% move from their April lows. That led us to recently ring the register and lock in a slice of those gains. The technical picture looks strong but with an overbought condition, a pullback could be just around the corner. Such a move down, perhaps 3-5% might open the door to adding more shares if you’re light on this name. As we digest upcoming earnings from constituents of this ETF, we plan on revisiting our current price target.
May Monthly Price Change: 7.9%; Yield: 0.0%
INVESTMENT THESIS: The First Trust Nasdaq Cybersecurity ETF seeks investment results that correspond generally to the price and yield (before the fund's fees and expenses) of an equity index called the Nasdaq CTA Cybersecurity Index. The Nasdaq CTA Cybersecurity Index is designed to track the performance of companies engaged in the cybersecurity segment of the technology and industrial sectors. It includes companies primarily involved in the building, implementation, and management of security protocols applied to private and public networks, computers, and mobile devices to protect the integrity of data and network operations. To be included in the index, a security must be listed on an index-eligible global stock exchange and classified as a cybersecurity company as determined by the Consumer Technology Association. Each security must have a worldwide market capitalization of $250 million, have a minimum three-month average daily dollar trading volume of $1 million, and have a minimum free float of 20%.
Target Price: Reiterate $72; Rating: Two
Panic Point: $60
RISKS: Cybersecurity spending, technology, and product development, the timing of product sales cycle, new products, and services in response to rapid technological changes and market developments as well as evolving security threats.
Labcorp Holdings Inc. LH; $248.97; 710 shares; 3.58%; Sector: Healthcare
UPDATE: Following their 1.5% gain during the March quarter, shares of Labcorp LH jumped higher following the company’s March-quarter earnings report leading them to close April up more than 3.5%. While the shares inched ahead in May, a $117.03 million contract modification award for clinical reference laboratory testing services for the U.S. Army led LH to end the month on a high note. Quarter to date, LH shares are up more than 6%, making them a nice outperformer relative to the S&P 500. As we see it, the Labcorp story remains one of an expanding array of diagnostic tests, testing relationships with medical offices and hospitals, and footprint expansion. While results can be lumpy quarter to quarter, we see Labcorp benefiting from those factors as well as the aging domestic population and the subsequent tailwind for medical testing. One of the key aspects of Labcorp is its multi-faceted growth strategies, which include nip-and-tuck acquisitions and expanding its testing capabilities. In March, Labcorp announced an agreement to acquire select assets of BioReference Health Oncology and related clinical testing services. This transaction will extend its oncology position. The company also completed the acquisition of select assets of North Mississippi Health Services, an ambulatory outreach laboratory business, and became a referral lab for its seven hospitals and clinical laboratories. After the March quarter, Labcorp introduced HPV and SDI Self-collection Options in Labcorp patient service centers and physician offices. More recently it launched its pTau Beta Amyloid Ratio Test, a new blood-based biomarker test to aid in the diagnosis of Alzheimer's disease, expanding its portfolio for Alzheimer's disease and dementia. Based on the duration of tariffs and potential trade deals, there could be some incremental EPS upside in H2 2025. Based on what develops, we’ll revisit our LH price target as needed. We will also keep an eye on key support levels between $233-$235, which may be levels we consider adding a few more LH shares to the Portfolio.
May Monthly Price Change: 3.3%; Yield: 1.2%
INVESTMENT THESIS: Labcorp is a global leader in innovative and comprehensive laboratory services that provides vital information to help doctors, hospitals, pharmaceutical companies, researchers, and patients make clear and confident decisions. By leveraging its diagnostics and drug development capabilities, the company provides insights and accelerates innovations to improve health and improve lives. The company is organized under two segments, consisting of Diagnostics Laboratories (Dx), which includes routine testing and specialty/esoteric testing, and Biopharma Laboratory Services (BLS), consisting of Early Development Research Laboratories and Central Laboratory Services. Our attraction to LH shares stems from the combination of the aging population driving diagnostic testing growth and the increasing array of diagnostic testing as well. That combination is expected to drive the healthcare testing services market to $12.6 billion by 2029, from $7.4 billion in 2024, according to Markets and Markets. To augment its position in oncology, women's health, autoimmune diseases, and neurology, the company has been expanding through acquisitions and partnerships with health systems and regional local labs.
Target Price: Reiterate $265; Rating: Two
Panic Point: $215
RISKS: Macroeconomic factors, changes in healthcare reimbursement models and products, government regulations, product discontinuations or recalls.
Meta Platforms META; $647.49; 283 shares; 3.71%; Sector: Communication Services
UPDATE: After declining modestly during the March quarter followed by another leg down in April, Meta META shares staged a strong comeback in May, rising more than 15%. That outperformance relative to the S&P 500 put META shares in an enviable position relative to that market barometer on a quarter-to-date and year-to-date basis. Needless to say, the move we made in April to scoop up more META at $555.17 paid off. The initial catalyst for that strong May rebound was the company’s consensus topping March-quarter results. One of our points about Meta has been the improving margin profile as the company reaps the benefit of using AI to drive productivity and pricing. We saw that in spades in March-quarter results as the operating margin clocked in at 41% compared to 38% in the year-ago quarter. Meta continued to grow its daily active user base, hitting 3.43 billion in March, up 6% year over year, but it also shared that one billion monthly active users are using Meta AI. That should bring the company an ample amount of data to train and refine its models, keeping its offering competitive. What we like about this is the learning that Meta gathers that it can apply to its advertising business, something we also see at Google. It stands to reason that as Meta improves its AI and more of the user base uses it, the sharper it will become in matching advertisers with targeted users. As that happens, we are likely to see further improvement in the average price per ad, which rose 10% year over year in the March quarter. Late in May, Meta announced it with Palmer Luckey’s Anduril Industries to develop and build a range of extended reality (XR) gear for the U.S. Army to enhance soldiers’ sight and hearing, along with capabilities that allow for advanced interaction with artificial intelligence weapons systems. This follows other efforts by Meta to move into the defense sector, signaling a more strategic goal to capture multi-million-dollar Pentagon contracts under a new administration. It’s also a potential way to mitigate development costs for future XR and smart glasses products as the competitive landscape heats up further in the coming quarters. And be sure to mark your calendars for June 26, that’s when Meta will pay its next quarterly dividend of $0.525 per share to shareholders of record as of June 16. We have some room to pick up more META shares, but the odds are we will need to be opportunistic. If we saw META shares pullback near $600, that would give us reason to make such a move as well as revisit our Two rating.
May Monthly Price Change: 17.9%; Yield: 0.3%
INVESTMENT THESIS: Meta segments its business between Family of App Products, which includes Facebook, Instagram, Messenger, Threads, and WhatsApp, and Reality Labs Products, which includes its metaverse and investments and future product R&D. Family of Apps accounts for ~99% of company revenue and 100% of company operating profit. Substantially all of Meta’s revenue is currently generated from advertising on Facebook and Instagram. Family daily active people (DAP) was 3.43 billion on average for March 2024. Meta expects to spend $64 billion to $72 billion on capex in 2025, a significant increase year over year, with the majority of this spending focused on AI infrastructure and initiatives. Meta is positioned to benefit from the ongoing shift toward digital advertising and the adoption of AI across its product offerings. We recognize Meta is ramping up capital spending as part of the current AI arms race, but we see that as an investment that should drive productivity in its core advertising business. As the company harvests that investment, we could see a step up in margins much like we saw in 2023.
Target Price: Reiterate $725; Rating: Two
Panic Point: $538
RISKS: Ability to add and retain users and user engagement; marketing spend; new products or changes to existing ones; competitive risk, geopolitical risk.
Microsoft Corp. MSFT; $460.36; 393 shares; 3.65%; Sector: Technology
UPDATE: Following the almost 11% decline in Microsoft MSFT shares during the March quarter, the shares rebounded some in April. However, the bigger move came in May following the company’s consensus-topping March-quarter results. We tied the upside surprise in the March quarter as well as the sequential improvement for the current one back to Microsoft’s Azure and other cloud services business. While Microsoft has exposure across multiple markets including PC, gaming, and others, results are increasingly driven more by its service segment (78% of sales, 65% gross margins) than its product segment (23% of sales, 78% gross margins). In recent quarters that business has been capacity-constrained, but as that is being addressed, especially at Azure, we are seeing the expected re-acceleration emerge, one that Microsoft management telegraphed. That pushes back strongly on the concerns over the company’s AI competitive position, while the reiteration of its 2025 capital spending plans also put to rest other chatter that plagued the shares during April. When we stand back and look at Microsoft’s March quarter and its guidance, the message to walk away with is the strength in AI and cloud that permeates across multiple business lines and is still somewhat capacity-constrained, is strong enough to more than offset the near-term uncertainty in the company’s hardware business. The ensuing and pronounced rebound in MSFT shares from a low near $350 in early April led us to ring in the register by selling some shares at $455.59 on May 20. In the coming quarters, we should see Microsoft’s margins rebound as it moves from ramping up AI infrastructure to monetizing it. This week, reports indicate Judson Althoff, Microsoft's chief commercial officer, told employees during a company-wide town hall meeting that Barclays intends to purchase 100,000 licenses for Copilot AI assistants. Althoff also named Accenture, Toyota, and Volkswagen as large-scale adopters of AI assistants. We’ll look for a follow-up on those reports when Microsoft management presents at the Bank of American Global Technology Conference on June 3. Althoff’s comments seem to confirm those from Nvidia CEO Jensen Huang that “enterprise AI is ready to take off.” As we digest insights to be had we’ll revisit our current $480 target as needed, however given the current RSI level for the shares, members should wait for a better entry point.
May Monthly Price Change: 16.5%; Yield: 0.7%
INVESTMENT THESIS: We believe the cloud to be a secular growth trend and that the upside to the shares will result from Microsoft's hybrid cloud leadership as the company grabs market share in this expanding industry. While companies may look to build out multi-cloud environments, Microsoft's Azure offering will be a prime choice thanks to its decision to provide the same "stack" used in the public cloud, to companies for their on-premises data centers. Additionally, we would note that hybrid environments are currently the preference for most companies because they allow them to maintain critical data in-house while taking advantage of the agility and scalability provided by public clouds. Outside of the cloud opportunity, we maintain a positive view on the company's growing gaming business, which we believe is becoming an increasingly prominent factor in the Microsoft growth story as gaming becomes more mainstream, management works to convert its gaming revenue from one-time license purchase to a recurring subscription model and as technologies like augmented/virtual reality evolve. Finally, as it relates to LinkedIn and other subscription-based services such as O365 and various Dynamics products, we continue to value them highly for their recurring revenue streams, which, we remind members, provide for greater transparency of future earnings.
Target Price: $480; Rating: Two
Panic Point: $377
RISKS: Slowdown in IT spending, competition, cannibalization of on-premises business by the cloud.
Palantir Technologies PLTR; $131.78; 822 shares; 2.16%; Sector: Financial Services
UPDATE: The 40% climb posted by shares of Palantir Technologies PLTR in April made them a strong performer for the Pro Portfolio, but that move continued in May leaving them up more than 45% quarter to date. In mid-April, we boosted our PLTR target to $105 from $95 following the company’s NATO program win. We boosted our target again to $125, ahead of Palantir’s quarterly earnings report on May 5, in part due to the company’s new collaboration with Google Cloud to bring FedStart platform to public sector customers. In early May we upped our target to $130 following that earnings report. Coming out of that report where some focused on the softer-than-expected margin, we argued the smarter move was to understand that revised guidance calls for revenue to climb 14% in the second half of 2025 compared to the first half of the year. Also, adjusted operating income is expected to grow at a quicker 16% or higher rate. That means we should see stronger free cash flow in the second half of 2025 as well as margins bounce back. That combination is the reason we are nudging our price target higher. Let’s remember the fundamental reason for owning PLTR is to capture the benefits of the company’s expanding and diversifying customer base as well as AI adoption to drive productivity. We remain in the relatively early innings of that adoption, and we plan to revisit our PLTR target after Palantir holds its next AIPCon event, most likely later this quarter. Adding comfort to our H2 2025 expectations and the company’s multi-year contract backlog, Palantir was recently awarded a $795 million Army contract modification with a May 2029 end date. We will continue to evaluate opportunities to add more PLTR shares to the Pro Portfolio, but for now, given the distance to our price target, we would either need to see a fresh catalyst to drive that target high enough to warrant picking up shares or see the shares pullback sufficiently to make the same move.
May Monthly Price Change: 11.3%; Yield: 0.0%
INVESTMENT THESIS: Palantir Technologies specializes in big data analytics and builds software platforms that help organizations integrate, analyze, and make sense of vast amounts of data for both commercial and government clients. While much has been made about the company’s exposure to the federal government, its software is used across 90 industries and the larger global government sector accounted for 55% of revenue last year. The balance was from the commercial sector. While those percentages matched the ones for 2023, Palantir’s customer count jumped to 711 exiting 2024 from 497 at the end of 2023, nearly double compared to the end of 2023. For 2024, the average revenue across its top 20 customers was $64.6 million, up from $54.6 million in 2023 and $49.4 million in 2022. Commercial remaining deal value (RDV) stood at $1.79 billion exiting 2024, up 49% sequentially and 99% on a year-over-year basis. That equates to about 47% of the expected 2025 revenue. We will continue to monitor Palantir’s RDV and deferred revenue metrics, but in our view, key items to watch will be the continued diversification of its customer base across industries and increasing revenue per customer. Because we are still in the relatively early innings of AI adoption, we are inclined to be long-term owners of PLTR shares. Exiting 2024, Palantir had just over $935 million remaining under its current share repurchase program.
Target Price: $130; Rating Two
Panic Point: $80
RISKS: Economic and IT budget spending risk, technology risk, competition and competitive pressures, and customer acquisition risk.
Waste Management WM; $240.97; 620 shares; 3.03%; Sector: Industrials
UPDATE: In early March, we took advantage of the overbought status for Waste Management WM shares to lock in a slice of double-digit year-to-date gains, a move that helped lift the Pro Portfolio’s cash position. We maintained the balance of that position in April, which saw the shares drift modestly lower, but in May the stock rebounded nicely. Following the company’s March-quarter earnings report, which reaffirmed our investment thesis on the stock, we reiterated our $245 price target ahead of the company’s June 24 Investor Day. The core waste business accounts for 90% of the company’s revenue stream with the balance coming from the renamed WM Healthcare Solutions business, which houses the acquired Stericycle business. We view the sharp margin difference between the two segments as one of the opportunities for the Waste Management team, and at the upcoming Investor Day, we look forward to more detailed integration plans and cost savings initiatives. That includes a granular look at achieving $250 million in annual run rate synergies by 2027. While WM has paused its buyback program, management shared on the March earnings call that it continues to focus on identifying tuck-in acquisitions for the core waste business. The team expects to close on more than $500 million of solid waste acquisitions in 2025. Near-term, if WM shares found their way back to the $217 level we would be interested buyers at those levels. The company’s next cash dividend of $0.825 per share will be paid on June 20 to shareholders of record as of June 6.
May Monthly Price Change: 3.3%; Yield: 1.4%
INVESTMENT THESIS: 2025 will see more nonresidential construction activity because of the Biden Infrastructure Law, but now we can finally factor in activity for the CHIPs Act, which saw its first award this week. Other potential drivers include spending associated with the Inflation Reduction Act, including the much-awaited start of building out a nationwide network of EV charging stations. Alongside that bright outlook for WM's commercial business, automation efforts and pricing power in its sticky residential business should drive margins and EPS generation higher in the coming quarters. We are in the early days of WM Healthcare Solutions, but we see the business growing as management integrates and cross-sells against its core business and flexes the ability to integrate nip-and-tuck acquisitions as it has at the core waste business.
Target Price: $245; Rating: Two
Panic Point: $211
RISKS: Industry and economic risk, competition and competitive pressures, and acquisition risk.
