March Monthly Roundup: Portfolio Makes Up Lost Ground in Tough Month
As we outperformed in a down month, we exited two positions, added a new one, expanded several and reconstituted our EPS Diplomats basket.
You've reached your free article limit
You've read 0 of 1 free Pro articles.
 NYSE traders
Out of the gate, the market had multiple headwinds to contend with in March, ranging from the start of the U.S.-Iran conflict and the follow-through that led energy and related prices higher. As uncertainties around the conflict and trajectory of those prices mounted, the market confronted the realization that inflation pressures were already rising, at first pushing out rate-cut expectations and then taking them off the board for 2026.
That combination led the S&P 500 to shed 5.1% in March, a 4.8% drop in the Nasdaq Composite, and mid-single-digit declines in other key market indexes. While that impact reverberated through the Pro Portfolio, the Portfolio's March decline was far less than the market, allowing it to make up quite a bit of ground in Q1 2026.
As we begin Q2 2026, rather than get the soft off-ramp the market was looking for, President Trump’s April 1 address indicated the conflict was poised to escalate further over the coming few weeks. “Extremely hard hits” over the next two to three weeks was the message, but there was no mention of Trump’s April 6 deadline, nor was there a clear timeline for ending hostilities or re-opening the Strait of Hormuz.
Uncertainty is back in the market while the duration of the conflict and its impact is being reset to “even longer.” U.S. strikes over the next few weeks will come at the start of Q1 2026 earnings season, and that has us thinking even more that companies are, in some cases, more likely to issue cautious guidance, while others adjust their guidance for rising input prices.
On April 2, we noted that despite all that unfolded in March, quarterly consensus EPS expectations for the S&P 500 exiting the month were higher compared to expectations at the end of February. This tells us the market is not pricing in the longer duration of the conflict and the follow-through impact it will have. That led us to once again to add some market-hedging positions to the Portfolio to help insulate us from what’s ahead in the coming weeks.
As we discussed in that trade Alert, these are tactical positions and should not be viewed as long-term holdings. At a minimum, we will want to hold these positions as the conflict escalates further in the near-term, and as the Q1 2026 earnings season heats up. Remember, the first wave of companies that report are banks and other financials, which are not directly impacted by higher energy costs and their fallout.
We will continue to evaluate the role of those inverse ETF positions in the Portfolio from a fundamental and technical basis and revisit their roles and percentages as needed. We will also continue our work with the Bullpen so that as expected storm clouds come and go, we can take advantage of well-positioned opportunities when they present themselves.
Have a wonderful holiday weekend, and we’ll see you back here, bright and early on Monday.
Catching Up on the Portfolio This Week
Exiting February, the Pro Portfolio was lagging the S&P 500 by just over 300 basis points, and as challenging as March was for the market, by the end of the month, we narrowed that gap to just over 100 basis points. That speaks to the number of our positions that outperformed on an absolute basis, such as Marvell (MRVL) , SuRo Capital (SSSS) , Palantir (PLTR) , and the 14 that did so on a relative basis compared to the S&P 500’s 5.1% fall in March.
The Portfolio had a busy March that began with us exiting our position in Dutch Bros (BROS) and adding a market-hedging position with the ProShares S&P500 ETF (SH) , and ending with our latest reconstitution and upsizing of our EPS Diplomats strategy.
In between, we locked in gains on Waste Management (WM) shares and added a new position in Applied Materials (AMAT) . We also used the oversold condition in the S&P 500 to close out our position in SH shares with a modest gain and added further to our holdings in Morgan Stanley (MS) , Bank of America (BAC) , American Express (AXP) , Netflix (NFLX) , and Arista Networks (ANET) .
We also closed out the Portfolio’s position in ServiceNow (NOW) on March 31 to help fund the previously announced decision to increase exposure to the EPS Diplomats basket to 4% of the Portfolio’s assets at the start of trading on April 1. Subsequent to the close of the Q1 2026 quarter, on April 2, we locked in sizable gains in shares of Marvell (MRVL) and SuRo Capital (SSSS) following their recent runups. We used those proceeds to fund our decision to add back SH shares as well as additional hedging positions in the ProShares Short QQQ (PSQ) and ProShares Short Russell2000 (RWM) ETFs.
Following those aggregate moves, as we move deeper into April, the Portfolio’s cash position stands at roughly 7.8% of its assets.
This Week's Portfolio Videos
We cover a lot of ground during the week in our daily videos. If you happened to miss one or more of them, here are some helpful links:
Monday, March 30: Can the Stock Rebound Last?
Tuesday, March 31: Explaining the EPS Diplomats Investment Strategy
This Month’s Podcasts and Signals
Big discussions and insights are had during TheStreet Stocks & Markets Podcast, and in Signals we share the latest news for the Pro Portfolio’s strategies. Here are some quick links to those conversations conducted over the last several weeks:
March 7: 25 Signals Across 9 Investing Themes
March 11: Key S&P 500 Levels to Watch as Oil Prices Surge
March 14: We're Tracking 24 Portfolio Signals Across 9 of Our Investing Themes
March 21: We're Tracking 21 Portfolio Signals Across 9 of Our Investing Themes
March 28: What the Disney Collapse Means for OpenAI's Sora
Some helpful links if you prefer to catch the podcast on the go, in the car, or wherever. Be sure to give it a like or thumbs up and leave a review if you’re so inclined. We’d appreciate it.
YouTube, Apple Podcasts, Spotify
Key Global Economic Readings
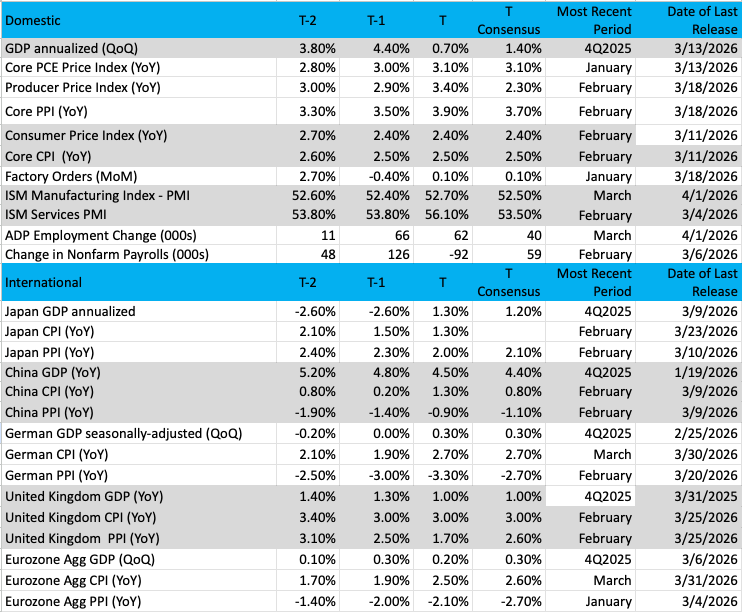
(Note: T is the most recent period, T-1 is the prior period's reading, and T-2 is two periods back, the intent being to illustrate any trends.)
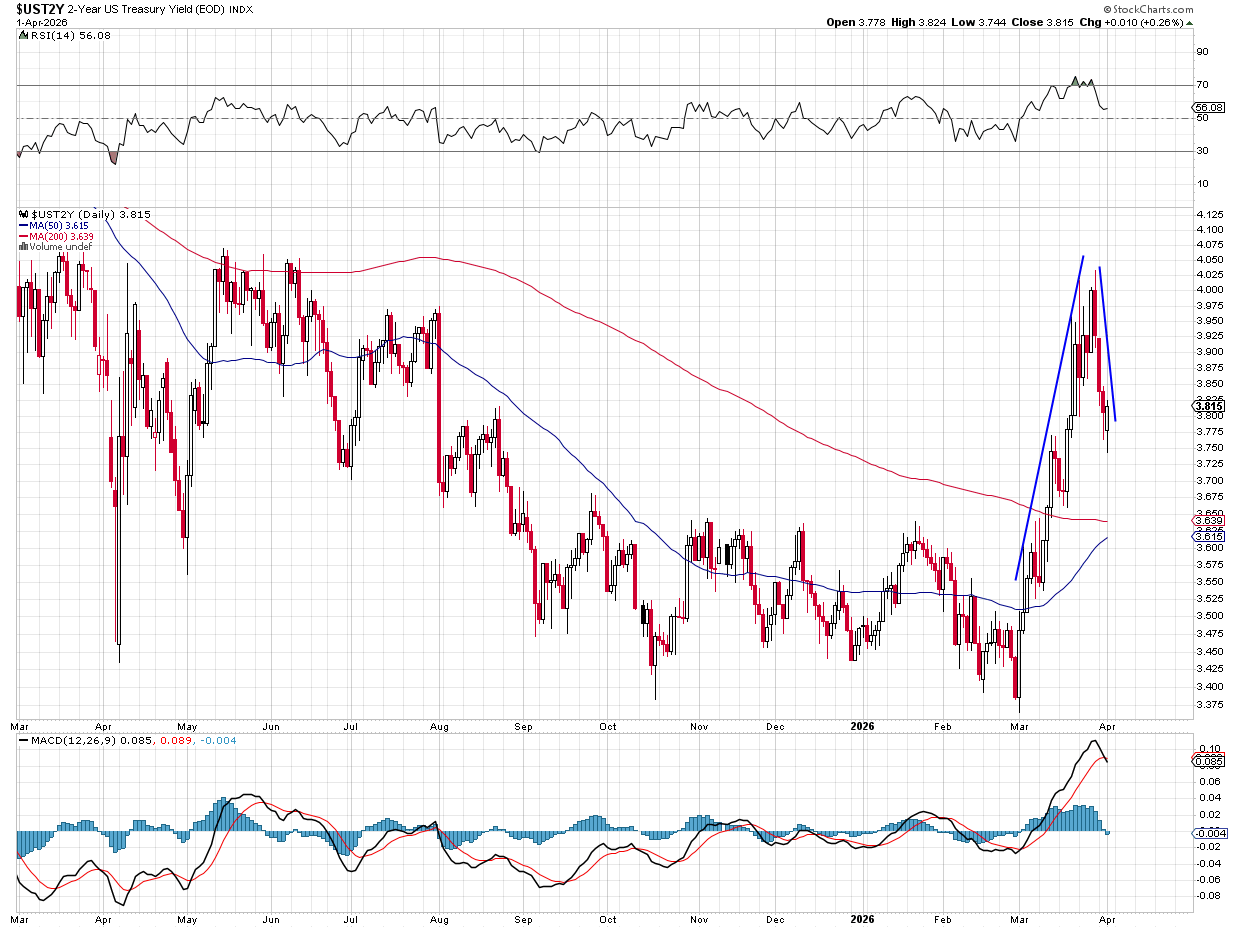
Chart of the Week: The 2-Year US Treasury Yield
We are again going to look at bond yields, specifically the 2-Year U.S. Treasury as this one closely matches the short-term forecast for the Federal Funds rate. Recall, the Fed Funds is a target rate set by the Federal Reserve for what banks charge other banks for overnight lending. The market for short-term loans is massive and could be chaotic without a set policy from the Fed.
The 2-year yield simply matches medium-range forecasts for rates. This is not the overnight rate of course, but the 2-year often aligns with Fed forecasts for rates out into the future. It becomes concerning when the differential between current funds, forecasts and the 2-year is larger than normal.
The current situation is interesting. We can see on the chart the 2-year's yield is right near 3.85%, which is above the current Fed Funds rate of 3.5%. A recent forecast by Fed officials seems to imply rates are going to be lower in two years’ time, so clearly someone is incorrect. Is it the fed or the market? Further, a recent rise in the 2-year yield to 4% last week had many in the bond market getting nervous.
Fed Funds futures were starting to price in rate hikes, something not off the table, according to Chair Jerome Powell last month. A sharp decline in the 2-year this past week was relief for the markets and Fed futures, but it seems rates are still trending higher. With a large differential between current Fed Funds and the 2-year we must assume that the futures market is more correct, meaning the Fed Funds rate is likely to move higher. We don’t make the rules, we are just reading the tea leaves.
As for the chart, higher highs and higher lows in this yield mean this market is in a firm uptrend (yield, not price). Notice how the 2-year was rejected at 4%, if that level is exceeded then we could be looking to 4.18% or so, which would be problematic for markets.
Other charts we shared with you this past week were:
Monday, March 30: S&P 500 – The Index Is in a World of Hurt
Monday, March 30: ServiceNow (NOW) - ServiceNow Is Stuck Under a Dark Cloud
Tuesday, March 31: Alphabet (GOOGL) - The Last Stand for Google Is Approaching
Wednesday, April 1: Micron (MU) - Micron Has 'Earned' Our Attention
Thursday, April 2: Bloom Energy (BE) - Bloom Energy Hasn't Quite Bloomed Yet
The Week Ahead
With the market closed on Friday, April 3, for Good Friday, we will share our analysis of the March Employment Report and S&P Global’s Final March Service PMI with you on Monday, April 6. No doubt, those will also include thoughts on weekend developments on the U.S.-Iran conflict as we close in on President Trump’s April 6 deadline.
To that picture, we’ll include ISM’s March Service PMI report and what it tells us about 85%+ of the economy responsible for GDP. We’ll also be paying close attention to what the reports Price component has to say about renewed inflation pressures following the spike we saw in ISM’s March Manufacturing PMI. The combined learnings will help us reset our expectations for the upcoming March PPI and CPI reports, which should show the initial impact of higher oil, gas, diesel, and related prices.
The March CPI report comes at the end of next week, but before that, we’ll get another look at February spending courtesy of the Personal Income & Spending report. We’ll contrast those learnings against what we saw in this week’s February Retail Sales report, but we’re pretty sure the findings will validate our views on TJX (TJX) , Costco (COST) , and Amazon (AMZN) .
Alongside that February data, we’ll also get the February data for the Personal Consumption Expenditure (PCE) price index. I don’t think it needs to be said that report will be overshadowed by March developments, but it is likely going to reinforce the fact that inflation pressures were already on the rise before the U.S.-Iran conflict.
As we collect these and other data points, we’ll continue to revert back to rate-cut expectations as well as those for the domestic economy and the S&P 500. We’ll also be keeping a close eye on U.S.-Iran developments and how that flows through to energy, petrochemical and related prices.
Here's a closer look at the economic data coming at us next week:
U.S.
Monday, April 6
ISM Services PMI – March (10:00 AM ET)
Tuesday, April 7
ADP Employment Change Report – Weekly (8:15 AM ET)
Durable Orders – February (10:00 AM ET)
Consumer Credit – February (3 PM ET)
Wednesday, April 8
MBA Mortgage Applications Index – Weekly (7:00 AM ET)
EIA Crude Oil Inventories – Weekly (10:30 AM ET)
FOMC Meeting Minutes (2 PM ET)
Thursday, April 9
Initial & Continuing Jobless Claims – Weekly (8:30 AM ET)
Personal Income & Spending – February (8:30 AM ET)
PCE Price Index – February (8:30 AM ET)
GDP (Third Estimate) – Q4 2025 (8:30 AM ET)
Wholesale Inventories – February (10:00 AM ET)
EIA Natural Gas Inventories – Weekly (10:30 AM ET)
Friday, April 10
Consumer Price Index – March (8:30 AM ET)Factory Orders – February
University of Michigan Consumer Sentiment Survey (Prelim) – April (10:00 AM ET)
International
Tuesday, April 7
Japan: Household Spending. Leading Economic Index – February
Eurozone: S&P Global Services PMI (Final) – March
UK: S&P Global Services PMI, New Car Sales – March
Wednesday, April 8
Japan: Eco Watchers Survey – March
Germany: Factory Orders – February
Eurozone: Retail Sales, Producer Price Index – February
Thursday, April 9
Japan: Consumer Confidence, Machine Tool Orders – March
Germany: Imports/Exports, Industrial Production – February
Friday, April 10
Japan: Bank Lending, Producer Price Index – March
China: Inflation Rate – March
The Q1 2026 earnings season moves up a gear next week, and we have three Portfolio holdings – Bank of America (BAC) , Morgan Stanley (MS) , and Netflix (NFLX) – reporting. Ahead of those updates, we’ll get quarterly results from Goldman Sachs (GS) , JPMorgan Chase (JPM) , Citigroup (C) , and Wells Fargo (WFC) . What those four show and tell about investment banking activity, stock market volatility and trading revenue, the private credit market, and loan activity will set the table for BofA and Morgan Stanley. Our expectation is a favorable picture for investment banking will be delivered, especially with SpaceX’s April analyst day meeting ahead of us.
In late March, Netflix announced its latest forthcoming price increase, and that led us to increase our price target to $115 for the shares. As interested as we’ll be in paid subscriber count figures, we’ll be as focused on the update on advertising revenue, content spending, and the upcoming programming slate, and what management plans to do with that $2.8 billion breakup fee from the aborted effort to acquire Warner Bros Discovery (WBD) .
While Applied Materials (AMAT) is not set to report for more than a few weeks out, we will be sifting through market comments and guidance from ASML Holding (ASML) on Wednesday.
When we review other companies’ results and guidance next week, we will keep our ears wide open for comments about the impact of tariffs, energy prices, and other key inputs. We’ll also be listening for any indications that customers are delaying purchases or extending cycle times for corporate deals.
Here's a closer look at the earnings reports coming at us next week:
Monday, April 6
· Open: Fastenal (FAST), Goldman Sachs (GS)
Tuesday, April 7
· Open: CarMax (KMX), Citigroup (C), Johnson & Johnson (JNJ), JPMorgan Chase (JPM), Wells Fargo (WFC)
Wednesday, April 8
· Open: ASML (ASML), Bank of America (BAC), M&T Bank (MTB), Morgan Stanley (MS), PNC (PNC)
Thursday, April 9
· Open: Abbott Labs (ABT), BNY Mellon (BK), Travelers (TRV)
· Close: Alcoa (AA), Netflix (NFLX)
Friday, April 10
· Open: Ally Financial (ALLY), Ericsson (ERIC), State Street (STT), Truist (TFC)
Portfolio Investor Resource Guide
· Economic Data: Here's a List of Links to the Key Economic Data We Closely Watch
· Investing Terminology: 16 Key Terms Club Members Should Know
· 10-Ks: Want to Know About a Stock? Read the Company's Reports
· 10-Qs: Unlock the Numbers and Key Information Behind Your Stock With the 10-Q
· Income Statement: Our Cheat Sheet to Understanding This Financial Document
· Balance Sheet, Cash Flow Statements, and Dividends: How to Know If a Company Is Off-Kilter? Read Its Balance Sheet
· Valuation Metrics: Everyone Wants a Value. Here's How Investors Can Find
· Thematic Investing 101 Webinar
· Like the Benefits of ETFs? Let’s Talk About Models
The Portfolio Ratings System
1 - Buy Now (BN): Stocks that look compelling to buy right now.
2 - Stockpile (SP): Positions we would add to on pullbacks or a successful test of technical support levels.
3 - Holding Pattern (HP): Stocks we are holding as we wait for a fresh catalyst to make our next move.
4 - Sell (S): Positions we intend to exit.
ONES
Amazon AMZN; $208.27; 881 shares; 3.54%; Sector: Consumer Discretionary
UPDATE: While Amazon (AMZN) shares experienced some wide swings in March, they ended the month little changed, leaving them down just under 10% in Q1 2026. In February we reset our AMZN price target at $275, noting that what will be key for Amazon is for it to convert the AWS capacity it is adding into not only revenue but also better margins over time. In recent quarters, we’ve seen that Amazon is adept at doing that with digital shopping and AWS, but it didn’t go unnoticed by us that AWS’s 2025 operating margin dipped to 35.4% from about 37% in 2024 at a time when, per CEO Andy Jassy, AWS added more data center capacity than any other company in the world. Similar to Microsoft and Azure, and other “show me” stories these days, the market will want to see margins at AWS rebound as the bulk of the oncoming spending is digested. Based on what we’re seeing in AI adoption and usage, we can be patient. Meanwhile, recent signals have pointed to consumers not only pivoting more to digital shopping, but also increasingly to grocery, an area of focus for Amazon. With February Retail Sales showing year-over-year declines in grocery spending, we suspect digital shopping continues to take share. As consumers feel the direct and indirect pinches of higher gas prices, we could see that shift accelerate just as Amazon steps up its same-day and next-day delivery. Lending a helping hand is the growing advertising business, which rose 22% year over year in the December quarter to $21 billion. In 2025, that high-margin advertising business generated more than $68 billion in revenue, and we see more ahead as Amazon continues to focus on that effort. During March, Amazon also continued to make headway on its burgeoning health business, launching its Amazon Connect Health, a healthcare tool powered by artificial intelligence that reduces administrative workload for healthcare providers and accelerates care access for patients.
March Price Change: -0.8%; Yield: 0.00%
INVESTMENT THESIS: We believe that upside will result from Amazon's continued e-commerce dominance, AWS's continued leadership in the public cloud space, and the ongoing growth of the company's advertising revenue stream, which feeds off Amazon's e-commerce business. Additionally, we think profitability will continue to improve as AWS and advertising account for a larger portion of total sales, as both these segments sport higher margins than the eCommerce operation. While we believe the increasing share of the revenue from these higher-margin businesses will be key to driving profitability longer-term, we think margins on eCommerce stand to improve as the company's infrastructure is further built out and economies of scale further kick in. The embedded call option is that management is always looking to enter a new space and generate new revenue streams. Outside of the company’s core businesses, per recent 13F-HR filings, Amazon holds a stake of 158.36 million shares in Rivian, 225,428 shares in Marvell, as well as positions in other companies. It has also committed to a $50 billion investment in OpenAI.
Target Price: Reiterate $275; Rating: One
Panic Point: $210
RISKS: High valuation exposes the stock to volatile swings, e-commerce has exposure to slower consumer spending and competition, potential headwinds resulting from new e-commerce regulation in India, and management is not scared to invest aggressively for growth, which can at times cause volatile reactions as near-term concerns arise relating to the impact on margins.
Arista Networks ANET; $122.78; 1,395 shares; 3.31%; Sector: Technology
UPDATE: Through the first two months of 2025, shares of Arista Networks (ANET) moved nicely higher, however, the market’s March selloff, especially for the tech-heavy Nasdaq, pulled the stock lower despite favorable medium to long-term demand prospects from AI, data center and other markets. Spending also remains strong across Arista’s other customer sectors, which include Enterprise and Financials (32% of revenue) and AI and Specialty providers (20% of revenue, including Apple, Oracle, and other neoclouds). That led the Arista management team to suggest we could see one or two more 10% customers in 2026. In late March, we added to the Portfolio’s position in ANET shares near $133, and with the shares below that level, we continue to rate them a One. As we move into the Q1 2026 earning season we will be mindful of AI and data center-related capital spending figures as well as construction-related activity, a harbinger of demand for Arista’s networking equipment. We will also continue to track comments about AI adoption and usage, as well as the demand profile for servers and other data center equipment.
March Price Change: -8.0%; Yield: 0.00%
INVESTMENT THESIS: Arista Networks engages in the development, marketing, and sale of data-driven, client-to-cloud networking solutions for AI, data center, campus, and routing environments in the Americas, Europe, the Middle East, Africa, and the Asia-Pacific. Its cloud networking solutions consist of Extensible Operating System (EOS), a publish-subscribe state-sharing networking operating system offered in combination with a set of network applications. The company offers data center, cloud, and AI networking, cognitive adjacencies, and cognitive network software and services. It also provides post-contract customer support services, such as technical support, hardware repair, and replacement parts beyond standard warranty, bug fixes, patches, and upgrade services. The company serves a range of industries comprising internet companies, cloud service providers, financial services organizations, government agencies, media and entertainment, healthcare, oil and gas, education, manufacturing, industrial, and others. Two of Arista’s largest customers in the last few years are two Portfolio holdings you’ll quickly recognize — Microsoft and Meta. Per Arista’s 10-K filings, both Meta and Microsoft each account for more than 10% of revenue. Other named customers include Amazon’s AWS, Google Cloud, Anthropic, Canva, SAP, Shopify, Apple, Oracle, Bank of America, and Accenture.
Target Price: $180; Rating: One
Panic Point: $110
RISKS: Economic, customer, supply chain, and competition risks.
Axon Enterprise AXON; $424.69; 395 shares; 3.24%; Sector: Aerospace & Defense
UPDATE: On February 25, we trimmed back exposure to Axon (AXON) shares following their explosive post-earnings move, locking in gains at $542.90. The catalyst for that move was the company's future contracted bookings, which stood at $14.4 billion exiting 2025, up from $11.4 billion at the end of the September quarter and $10.1 billion at the end of 2024. Those same bookings give ample coverage for Axon’s 2026 top-line guidance of $3.53 billion-$3.61 billion, up around 28% at the midpoint and nicely ahead of the $3.44 billion market consensus. Despite those positives, AXON shares plummeted more than 20% in March, putting them back near their February lows. We reduced our Axon target to $700 from $800 in February to account for slower margin gains as the company continues to invest in new products, and tariffs and higher component costs are a bit of a headwind. While Axon may once again be conservative with its guidance, as margins rebound, and the mix shift toward software and services accelerates, due in part of further AI adoption, we can revisit our price target as needed. During Axon’s presentation at the March Morgan Stanley Tech Conference, it recapped the drivers of its recent earnings report and guidance, but it also discussed several lesser followed end markets, including federal and state corrections markets and the demand for its body camera products as well as corresponding software and cloud services. Management also said it has a new smaller body camera coming to market in H2 2026 that should bolster its position in retail, healthcare and other markets. Following our very profitable February trim trade, we have room to add back some shares, and as the market finds its footing, given the number of signals we collect each month, we are inclined to make such a move.
March Price Change: -21.7%; Yield: 0.00%
INVESTMENT THESIS: Axon Enterprise develops, manufactures, and sells conducted energy devices and cloud-based digital evidence management software designed for use by law enforcement, corrections, military forces, private security personnel, and private individuals for personal defense. The company operates in two segments: Taser (recently renamed Connected Devices) and Software & Sensors (recently renamed Software & Services). Taser develops and sells CEDs used for protecting users and virtual reality training. Software & Sensors manufactures fully integrated hardware and cloud-based software solutions such as body cameras, automated license plate reading, and digital evidence management systems. Axon delivers its products worldwide and gets most of its revenue from the United States. According to Mordor Intelligence, the wearable and body-worn cameras market on its own was valued at $1.62 billion in 2020 and is expected to reach $424.63 billion by 2026. Public safety organizations are increasingly adopting cloud solutions, leading to significant spending in this area. The digital spending in public safety is projected to reach $201 billion by 2027.
Target Price: Reiterate $700; Rating: One
Panic Point: $400
RISKS: Manufacturing and supply chain, competitive factors, government regulation, and technology change.
Bank of America Corp. BAC; $48.75; 4,245 shares; 4.00%; Sector: Financial Services
UPDATE: Shares of Bank of America (BAC) slipped 2% in March, bringing their Q1 2026 performance to a low-double digit decline. After locking in some nice gains in January near $57, we used the ensuing pullback to rebuild the Portfolio’s BAC position by adding back shares on March 10 at just below $49. As we made that move and given the favorable outlook for investment banking fees and market volatility-led trading, paired with BofA’s focus on removing cost from its business, we upgraded BAC to a One rating. At the Bank of America Financial Services Conference on February 10, CEO Brian Moynihan reminded the company remains focused on expense control, leveraging technology, and further expanding the branch footprint as a springboard for other services, such as wealth management, above and beyond checking accounts and deposits to increasingly own more of the customer relationship. Those comments were largely reiterated at the RBC Capital Markets Global Financial Institutions Conference on March 10. On March 31, BofA was named as a potential co-lead for the upcoming SpaceX IPO, which is expected to generate one of the largest investment banking fee pools given the potential size of the offering.
March Price Change: -2.2%; Yield: 2.25%
INVESTMENT THESIS: Bank of America is one of the world's leading financial institutions, serving individual consumers, small- and middle-market businesses, and large corporations with a full range of banking, investing, asset management, and other financial and risk management products and services. The company provides unmatched convenience in the United States, serving approximately 69 million consumers and small business clients with approximately 3,700 retail financial centers, approximately 15,000 ATMs, and award-winning digital banking with approximately 59 million verified digital users. Bank of America is a global leader in wealth management, corporate and investment banking, and trading across a broad range of asset classes, serving corporations, governments, institutions, and individuals around the world. Bank of America offers industry-leading support to approximately 3 million small business households through a suite of innovative, easy-to-use online products and services. The company serves clients through operations across the United States, its territories, and approximately 35 countries. From a reporting perspective, the company's business breaks down as follows: Net Interest Income breakdown: Consumer Banking 57%, Global Banking 23%, Global Wealth & Investment Management 14%, and Global Markets 6%; Income Before Tax breakdown: Consumer Banking 42%, Global Banking 27%, Global Wealth & Investment Management 16%, and Global Markets 15%. Bank of America pays a quarterly dividend of $0.28 per share, up from $0.18 a few years ago.
Target Price: $65; Rating: One
Panic Point: $42
RISKS: Financial markets, fiscal, monetary, and regulatory policies, economic conditions, and credit ratings.
Broadcom Inc. AVGO; $309.51; 460 shares; 2.75%; Sector: Technology
UPDATE: Shares of Broadcom (AVGO) closed March down just over 3%, but that masks the pronounced move higher in early March after the company’s stellar quarterly earnings report and guidance. That move was more than offset by the market’s decline as U.S.-Iran tension and uncertainty increased. Amid signs of a potential soft off-ramp for the conflict, AVGO shares rebounded on March 31. What helped us keep a steady hand with AVGO during the month was the company’s revenue guidance for the current April quarter issued on March 5 — up 47% year over year to $22 billion. Parsing the figures, Broadcom sees its AI semiconductor revenue clocking in at $10.7 billion for the quarter. That’s a quarter-over-quarter jump of more than 27% and points to the continued ramp in chip demand from Broadcom’s now-six custom AI chip customers, which include Google, Meta, OpenAI and Anthropic. During the earnings call, Broadcom shared that it has “line of sight” for custom AI chip revenue in excess of $100 billion in 2027. That compares to the annualized revenue of around $42.8 billion for the current quarter. In response, we upgraded AVGO shares to a One rating from Two. Along with the quarterly report, Broadcom’s board authorized an additional $10 billion share repurchase program effective through the end of calendar year 2026. As the market finds its footing, we have room to round out the portfolio’s position in AVGO.
March Price Change: -3.1%; Yield: 0.81%
INVESTMENT THESIS: We became shareholders in Broadcom to participate as the company benefits from the buildout of digital infrastructure, including AI, data center, and custom AI chips, as well as demand for its software and services segment, which includes private cloud, mainframe software, cybersecurity, and enterprise software. Broadcom reports its business in two segments – Semiconductor Solutions (58% of sales and 51% of operating income) and Infrastructure Software (42%, 49%). The Broadcom management team has developed a track record of delivering organic growth and growth by acquisition, with the latter positioning the company to better position itself to meet developing demands. More recent acquisitions include Brocade Communications, CA, Inc., Symantec Enterprise Security, and VMware.
Target Price: $445; Rating: One
Panic Point: $290
RISKS: Economic, governmental regulations, geopolitical developments, cyclical, and investment risk.
Costco Wholesale COST; $996.43; 215 shares; 4.14%; Sector: Consumer Staples
UPDATE: While shares of Costco (COST) traded off modestly during March that performance made them a strong outperformer for the month compared to the larger declines in the S&P 500 and the Nasdaq Composite. We attribute the outperformance to the market recognizing Costco’s positioning amid renewed inflation pressures and prospects for further acceleration as a result of the U.S.-Iran conflict’s impact on energy prices and the Strait of Hormuz closure. We see Costco winning consumer wallet share as it continues to grow its warehouse footprint while expanding its membership base. That in turn should drive its high-margin membership fee revenue stream higher and do the same for its operating earnings and bottom line. Costco exited the February 2026 quarter with 40.4 million paid executive memberships (up 9.5% year over year) and 82.1 million total paid members (up 4.8%). Renewal rates remain strong with more than 92% in the U.S. and Canada, while worldwide renewal rates remain steady at 89.7%. During the quarter, Costco expanded its warehouse footprint to 924 warehouses. Management targets adding 28 additional net warehouse locations in the current fiscal year, but also 30-plus new openings per year in the coming ones. With ~10% upside to our current $1,100 price target, we will revisit it when Costco publishes its March comp sales report on April 8 and do the same for our current One rating. At the same time, should Costco shares move past a 4.5% position size for the Portfolio, some prudent portfolio management may be called for.
March Price Change: -1.4%; Yield: 0.51%
INVESTMENT THESIS: We like Costco's long-term prospects, driven by a club-based operating model that focuses on volumes, not margins, and therefore offers its customers a value proposition of everyday low prices. The strength of this model has created an incredibly loyal customer base with low churn and continued share gains in both brick-and-mortar and e-commerce. This is a global concept, evidenced by the strength of sales both in the U.S. and abroad, which includes an emerging China opportunity. We see the company's membership model as a key differentiator versus other retailers, and its plans to open additional warehouse locations in the coming quarters should drive retail volumes and the higher-margin membership fee income as well. We also appreciate management's approach to capital returns and their willingness to return cash.
Target Price: Reiterate $1,100; Rating: One
Panic Point: $825
RISKS: Inability to pass through higher costs, fuel prices, weaker consumer, and membership churn.
First Trust Nasdaq Cybersecurity ETF CIBR; $62.8; 2,730 shares; 3.30%; Sector: Cybersecurity
UPDATE: Pressures that weighed on cybersecurity stocks and our shares of the First Trust Nasdaq Cybersecurity ETF (CIBR) in February continued in March. While the ETF's decline in March was less than many of its underlying holdings, combined with the move lower in the first two months of 2026, CIBR shares finished Q1 2026 down more than 12%. Arguably, the drop in March, much like the larger decline in February for cybersecurity stocks, wasn’t about weakening demand — if anything, threat activity and spending remain strong — but rather investor concerns about the potential impact of AI. Our position on this has been that AI in the hands of bad actors would not only accelerate the velocity of such attacks but expand the scope as well. We see further attack vectors driving the need for greater cybersecurity spending in the coming quarters. In late March, reports indicated Anthropic was privately warning top government officials that it’s not-yet-released model — currently branded "Mythos" — makes large-scale cyberattacks much more likely in 2026. What this means is bad actors will be able to scale with more compute and no longer be limited by finite personnel as a single person would be able to run campaigns that once required entire teams. Needless to say, we remain bullish on the long-term prospects for cybersecurity spending as companies, governments and other institutions need to protect their crown jewels. In our view that makes the Q1 2026 move in CIBR shares an overreaction, and one we will look to capitalize on.
March Price Change: -0.4%; Yield: 0.48%
INVESTMENT THESIS: The First Trust Nasdaq Cybersecurity ETF seeks investment results that correspond generally to the price and yield (before the fund's fees and expenses) of an equity index called the Nasdaq CTA Cybersecurity Index. The Nasdaq CTA Cybersecurity Index is designed to track the performance of companies engaged in the cybersecurity segment of the technology and industrial sectors. It includes companies primarily involved in the building, implementation, and management of security protocols applied to private and public networks, computers, and mobile devices to protect the integrity of data and network operations. To be included in the index, a security must be listed on an index-eligible global stock exchange and classified as a cybersecurity company as determined by the Consumer Technology Association. Each security must have a worldwide market capitalization of $250 million, have a minimum three-month average daily dollar trading volume of $1 million, and have a minimum free float of 20%.
Target Price: Reiterate $85; Rating: One
Panic Point: $68
RISKS: Cybersecurity spending, technology and product development, the timing of the product sales cycle, new products, and services in response to rapid technological changes and market developments, as well as evolving security threats.
Marvell Technology MRVL; $99.05; 2,145 shares; 4.10%; Sector: Technology
UPDATE: February's move higher in Marvell (MRVL) was followed by a volatile March for the shares, but in the end between their early March earnings report and a $2 billion investment by Nvidia, MRVL closed March up more than 21%. That put the stock's Q1 2026 gain at more than 16%, making MRVL a big performer for the Portfolio. Marvell issued a barn burner of an outlook for its current fiscal 2027. The company is guiding for revenue growth of more than 30%, accelerating to 40% growth, year over year, in fiscal 2028. Putting dollar amounts around those figures, pegs Marvell’s fiscal 2027 revenue near $11 billion, ahead of the $10 billion it forecasted in December and the $9.5 billion in September. The strength behind that is the AI and data center business, from existing chips and networking ones to ramping custom silicon programs. Layering on that 40% figure for fiscal 2028 puts Marvell’s top line near $15 billion. Included in that fiscal 2028 figure is $250 million in revenue tied to its late 2025 acquisitions of Celestial AI and XConn. Marvell reiterated its longer-term outlook for Celestial AI and for its revenue to hit a $500 million annualized run rate in the fourth quarter of fiscal 2028, doubling to a $1 billion annualized run rate by the fourth quarter of fiscal 2029. On March 31, Nvidia announced a $2 billion investment in Marvell, and we view that capital commitment as a big validation of Marvell’s positioning and our multi-pronged rationale for owning the shares. We expect to learn more about the partnership and its benefits to both companies in the coming months. In the near-term, however, we expect this will serve as a fresh wake-up call to Wall Street and investors about Marvell and its shares. Whether the follow-through results in MRVL once again becoming an outsized position for the Portfolio is to be determined, but if it does and some prudent portfolio management is called for, that wouldn’t be a horrible thing. We will also be mindful of our current One rating relative to our $140 target. We’ll also be on the lookout for upcoming revenue reports from Taiwan Semiconductor and Foxconn.
March Price Change: 21.3%; Yield: 0.29%
INVESTMENT THESIS: Marvell is a fabless supplier of high-performance standard and semi-custom infrastructure semiconductor solutions. These solutions power the data economy, enabling the data center, carrier infrastructure, enterprise networking, consumer, and automotive/industrial end markets. With roughly 75% to 80% of Marvell's revenue stream tied to digital infrastructure, we see it continuing to benefit from rising content consumption and creation. Pointing to that rising demand that necessitates network densification and the build of digital infrastructure, Ericsson sees global monthly average usage per smartphone reach 46 gigabytes (GB) by the end of 2028, versus 19 GB in 2023 and 15 GB in 2022.
Target Price: Reiterate $140; Rating: One
Panic Point: $75
RISKS: Technology risk, customer risk, competition risk, reliance on manufacturing partners, and supply chain constraints.
Meta Platforms META; $572.13; 337 shares; 3.72%; Sector: Communication Services
UPDATE: Meta (META) shares have been on a roller coaster ride so far this year, with their climb in early February followed by a move lower, then a modest rebound in early March, then a sharp decline before a quick jump on the final day of March. All told, META shares declined just under 12% in March, but from their February high to the March low late in the month, the shares experienced a correction of ~30% before that March 31 snapback. A factor that weighed significantly on META was the overall market decline spurred on by the U.S.-Iran conflict and corresponding tensions and uncertainties. The sharp drop late in the month was due to back-to-back legal setbacks, including a California jury finding Meta liable for addictive social media features. Headlines of a “Big Tobacco moment" that could open a flood of potential litigation, questions over possible structural impacts, as well as financial ones in an already nervous market, dropped the shares. The verdicts against Meta focused on the platform’s design, not the content itself. Several lower courts have ruled that companies’ platform design choices are not protected by the law, but so far, no appellate court has weighed in. As we understand it, appellate courts, not trial judges, are the ones whose rulings bind other courts. We shared our view the corresponding move was likely a pronounced overreaction, and that means the late-March rebound was not surprising. However, Meta intends to appeal the rulings of these cases, which will first be heard by appeals courts at the state level. TD Cowen policy analyst Paul Gallant says the "linchpin case" is 30 state attorneys general versus Meta, which goes to trial in August. Cowen believes the company's best hope may be getting the San Francisco case dismissed or getting Congress to limit their lawsuit exposure in exchange for new regulations. For a sustained move higher like the one Mark Zuckerberg is targeting with his arguably aggressive executive pay incentives, we’ll want more clarity before making any next buys with META.
March Price Change: -11.7%; Yield: 0.32%
INVESTMENT THESIS: Meta segments its business between Family of App Products, which includes Facebook, Instagram, Messenger, Threads, and WhatsApp, and Reality Labs Products, which includes its metaverse and investments and future product R&D. Family of Apps accounts for about 99% of the company's revenue and 100% of the company's operating profits. Substantially all of Meta’s revenue is currently generated from advertising on Facebook and Instagram. Family daily active people (DAP) were ~3.6 billion on average for the December 2025 quarter. Meta expects to spend $162 billion-$169 billion on capex in 2026, a significant increase year over year, with most of this spending focused on AI infrastructure and initiatives. Meta is positioned to benefit from the ongoing shift toward digital advertising and the adoption of AI across its entire product offering. We recognize Meta is ramping up capital spending as part of the current AI arms race, but we see that as an investment that should drive productivity in its core advertising business. As the company harvests that investment, we could see a step up in margins, much like we saw in 2023.
Target Price: $850; Rating: One
Panic Point: $560
RISKS: Ability to add and retain users and user engagement; marketing spend; new products or changes to existing ones; competitive risk, geopolitical risk.
Morgan Stanley MS; $164.57; 1,300 shares; 4.13%; Sector: Financial Services
UPDATE: Morgan Stanley (MS) shares were down modestly in March, which made them a relative outperformer for the month compared to the major market averages. We used the decline in the first half of the month to pick up more shares for the Portfolio on March 10 at $161.35 amid signs of continued M&A activity and prospects for a re-opening for the IPO window. As we think about Morgan Stanley’s business model, investment banking activity is expected to remain brisk this year, with a slate of high-profile and large IPOs that includes SpaceX, OpenAI, Anthropic, Databricks, Stripe, Revolut, and Canva. Those offerings are expected to be sizable, and that means IPO-related investment banking fees could jump. Per Dealogic, Morgan Stanley ranked as the #2 book runner for global IPOs in 2025 and #1 in 2024. That positions the firm rather well, but we’ll still want to see its place on upcoming S-1 filings for those mega deals when they land at the SEC’s website. Meanwhile, stock market volatility like we’ve seen so far this year should benefit Morgan’s trading business. Near-term we will want to tread carefully as we determine the extent of private credit issues. As we do that, we will be monitoring aforementioned IPO activity as well as the same for M&A transactions.
March Price Change: -1.2%; Yield: 2.40%
INVESTMENT THESIS: Morgan Stanley reports in three business segments: Institutional Securities (42% of trailing 12-month revenue, 38% of trailing 12-month Income Before Tax), Wealth Management (48%, 55%), and Investment Management (10%, 6%). While the IPO window has yet to reopen, the potential IPO class for 2025 continues to build with recent additions including Klarna and StubHub. That would be a boon to private equity firms and others that have been nursing IPO candidates during the dark period and a positive for Morgan Stanley's investment banking business. Expected deregulation under the Trump administration is a potential catalyst for Morgan's M&A business. Meanwhile, folks continuing to be behind in retirement savings bodes well for Morgan Stanley's wealth management business in the coming quarters, while continued market volatility bodes well for its equity trading business.
Target Price: $205; Rating: One
Panic Point: $145
RISKS: Market and interest rate risk, credit risk, country risk, and operational risk, including cybersecurity.
Nvidia Corp. NVDA; $174.40; 970 shares; 3.27%; Sector: Technology
UPDATE: Shares of Nvidia (NVDA) traded off in March but outperformed all the major market averages. While the chip company lagged the S&P 500 for Q1 2026, it fared better than the Nasdaq Composite. We attribute Nvidia’s outperformance in the third month of 2026 to comments from CEO Jensen Huang at the GTC 2026 event mid-month. During his keynote, Jensen shared expectations to sell at least $1 trillion worth of Blackwell and Rubin chips for the period from 2025 through to the end of 2027. He had previously forecast a revenue opportunity of $500 billion by the end of 2026. Across the ecosystem, signals from Nvidia and its peers reinforced that demand is not the issue — capacity is — as hyperscalers move to lock in supply through multiyear agreements. During March there was back and forth about the potential for renewed chip sales for Nvidia into China, which was not baked into management’s current quarter top-line guidance of $76.44 billion-$79.56 billion. As a reminder, in the past China accounted ~13% for Nvidia’s revenue. Tracking the progress on that revenue guidance means we must continue to pay attention to monthly revenue figures and earnings from Taiwan Semiconductor, Foxconn, HP Enterprise, Dell, Super Micro Computer, and others. As we move into the Q1 2026 earnings season, we’ll also be looking for updated capex comments from the hyperscalers as well as neoclouds and others building out AI and data center capacity. With AI adoption and usage rising, and the need to add more compute over the long-term we’re inclined to remain holders of NVDA shares. We continue to rate NVDA a One.
March Price Change: -1.6%; Yield: 0.02%
INVESTMENT THESIS: Nvidia is well-positioned to benefit from ramping AI and data center spending. The company pioneered accelerated computing to help solve the most challenging computational problems. Nvidia is now a full-stack computing infrastructure company with data-center-scale offerings that are reshaping the industry. The company's full stack includes the foundational CUDA programming model that runs on all Nvidia GPUs, as well as hundreds of domain-specific software libraries, software development kits, or SDKs, and Application Programming Interfaces, or APIs. This deep and broad software stack accelerates the performance and eases the deployment of Nvidia accelerated computing for computationally intensive workloads such as artificial intelligence, model training and inference, data analytics, scientific computing, and 3D graphics, with vertical-specific optimizations to address industries ranging from healthcare and telecom to automotive and manufacturing. Nvidia reports in two business segments: Compute & Networking and Graphics. The Compute & Networking segment (78% of revenue, 85% of operating income) is comprised of Data Center accelerated computing platforms and end-to-end networking platforms, including Quantum for InfiniBand and Spectrum for Ethernet; NVIDIA DRIVE automated-driving platform and automotive development agreements; Jetson robotics and other embedded platforms; Nvidia AI Enterprise and other software; and DGX Cloud software and services. The Graphics segment (22% of revenue, 15% of operating income) includes GeForce GPUs for gaming and PCs, the GeForce NOW game streaming service and related infrastructure; Quadro/NVIDIA RTX GPUs for enterprise workstation graphics; virtual GPU, or vGPU, software for cloud-based visual and virtual computing; automotive platforms for infotainment systems; and Omniverse Enterprise software for building and operating metaverse and 3D internet applications.
Target Price: $250; Rating One
Panic Point: $160
RISKS: Market and interest rate risk, credit risk, country risk, and operational risk, including cybersecurity.
Palantir Technologies PLTR; $146.28; 1,265 shares; 3.57%; Sector: Financial Services
UPDATE: Compared to many other companies in the Nasdaq Composite, shares of Palantir (PLTR) , with their mid-single-digit gain for March, were a strong outperformer for us during the month. The move higher in early March followed a string of program wins with the likes of consulting firm Bain, the renewal and expansion of its long‑standing partnership with Stellantis, the U.K.'s Financial Conduct Authority (FCA), and its Maven AI platform being named an official program of record, a move that locks in long-term use of Palantir’s weapons-targeting technology across the U.S. military. Each of these wins speaks to the rising adoption and expanding usage of AI in the enterprise and governments as did mid-month announcements with GE Aerospace, Nvidia, and Centrus Energy ahead of the company’s AIPCon 9 event. And we can add them to ones made earlier this year, including Palantir’s expanded relationships with HD Hyundai, Airbus and the Defense Information Systems Agency, and Rackspace. In our view, these announcements bode extremely well for Palantir’s total contract values in the coming quarters, its visibility, and earnings prospects. We last added to the Portfolio’s position in PLTR shares at $140.54 on February 17, and the company’s prospects have only improved since then. We continue to rate PLTR shares a One. As the company continues to announce new and expanded relationships, and grow its TCV, we’ll patiently wait for the market to realize the current opportunity in PLTR shares.
March Price Change: 6.6%; Yield: 0.00%
INVESTMENT THESIS: Palantir Technologies specializes in big data analytics and builds software platforms that help organizations integrate, analyze, and make sense of vast amounts of data for both commercial and government clients. While much has been made about the company’s exposure to the federal government, its software is used across 90 industries, and the larger global government sector accounted for 55% of revenue last year. The balance was from the commercial sector. Exiting 2025, Palantir's U.S. Commercial remaining deal value (RDV) stood at $4.38 billion, up 145% year over year, and its Total Contract Value (TCV) stood at $10.8 billion, up 128% year over year. We will continue to monitor Palantir’s RDV and deferred revenue metrics. Key items to watch include continued diversification of its customer base across industries and increasing revenue per customer. Because we are still in the relatively early innings of AI adoption, we are inclined to be long-term owners of PLTR shares.
Target Price: $220; Rating: One
Panic Point: $125
RISKS: Economic and IT budget spending risk, technology risk, competition and competitive pressures, and customer acquisition risk.
SuRo Capital SSSS; $10.71; 23,825 shares; 4.93%; Sector: Financial Services
UPDATE: Shares of SuRo Capital (SSSS) remained one of the Portfolio’s stronger performers during March, rising more than 14%, benefiting from continued investor recognition of the value embedded in its private market holdings, particularly those tied to OpenAI and Vast Data. As we’ve discussed many times, because SuRo’s net asset value reflects quarter-end figures, we have to account for subsequent financings and the corresponding impact on valuation figures for some of the underlying holdings in its investment portfolio. With that in mind, the NAV per share of $8.09 at the end of 2025 did not include the more recent $830 billion post money valuation of OpenAI nor the Vast Data capital raising of $1 billion, putting its valuation near $30 billion. Some back-of-the-napkin math implies SuRo’s position in OpenAI is now valued closer to $70 million compared to $42.2 million exiting December 2025, and we estimate its position in Vast Data is now closer to $40 million compared to $12.2 million last year. That $110 million equates to around $4.35 per share in net asset value. That led us to lift our SSSS price target to $14 from $12 on March 11. On March 31, SuRo’s second largest portfolio holding at the end of 2025, Whoop, closed a capital raise that put its post money valuation at $10.1 billion. Factoring that into our NAV per share calculation, we lifted our SSSS target to $16 from $14. During March, we also highlighted the disconnect between SSSS shares trading at roughly 1.3x NAV versus similar vehicles like the Fundrise Innovation Fund at significantly higher multiples, reinforcing our view that SSSS is undervalued. We also pointed to the potential for further upside in net asset value driven by holdings such as OpenAI and other IPO candidates, as well as a potential dividend stream. Bottom line, we continue to see SuRo Capital as a disciplined way to gain exposure to high-quality private companies, including AI digital infrastructure, at an attractive valuation. We’ll also remind you that our play with SSSS in the Pro Portfolio is a total return one. For newer members, that means a combination of stock price appreciation and dividend payments. Yes, from time to time, the thrust of those two factors can be lopsided but we believe it’s hard to argue with where SuRo’s portfolio is headed.
March Price Change: 14.2%; Yield: 5.33%
INVESTMENT THESIS: SuRo Capital is a business development company (BDC) that invests in high-growth, venture-backed private companies. As SuRo monetizes those portfolio investments through either IPO or M&A transactions, it must pay out most of its earnings to shareholders in the form of dividends. What’s important to factor into our thinking is that SuRo’s strategy isn’t to hold public company investments but rather to monetize them following the lock-up expiration. Sometimes this can be immediate, and sometimes it can be in stages, but when that monetization occurs, it triggers dividend payments. And because a BDC must pay out at least 90% of its taxable income through dividends to shareholders, there is the possibility of a special dividend to hit that qualifying threshold late in the year. As we think about this, it means that we should focus on total return with SSSS, which is defined as capital gains in the shares plus dividends received while owning them. What this means is even if we see SSSS shares trade sideways or move lower, depending on the size of the dividend payments in the coming quarters, the position’s total return could still be sizable for the Pro Portfolio. SuRo's portfolio holdings at the end of June included CoreWeave, ServiceTitan, OpenAI, Liquid Death, Whoop, and fintech company Plaid, as well as roughly 30 other holdings.
Target Price: $16; Rating: One
Panic Point: $8.00
RISKS: Industry and economic risk, competition and competitive pressures, and acquisition risk.
TWOS
Alphabet GOOGL; $287.56; 677 shares; 3.76%; Sector: Communication Services
UPDATE: Following a strong finish to 2025 and further gains in January, Alphabet (GOOGL) shares posted back-to-back declines in February and March, leaving them down just over 8% for Q1 2026. Despite the setback, we continue to see Google extremely well positioned with its Gemini models and rising active user base, especially as it further weaves AI into search and related businesses. Exiting December, Google had surpassed 740 monthly active users for its Gemini models, a ringing endorsement for our call last year not to rule the company out of the AI race. We would also note the continued effort to monetize YouTube and have noticed an increase in the number of ads per video. When Google reports its Q1 2026 results, revenue, backlog levels and margins at Google Cloud will be an area of focus for us as will capital spending and capacity digestion. Based on the company’s position in key aspects of our increasingly digital lifestyle and its growing role in digital infrastructure we are inclined to remain longer-term shareholders as AI adoption and usage expand further. While the Portfolio has a sizable position in GOOGL shares, we will continue to look for attractive levels for members whose position size is less than the Portfolio’s.
March Price Change: -7.8%; Yield: 0.27%
INVESTMENT THESIS: We believe that while search and digital ad dominance are what will carry the shares in the near-to mid-term, longer-term, it is the company's artificial intelligence "moat" that will provide for new avenues of growth. Exiting October 2025, Alphabet surpassed 300 million paid subscriptions across Google One and YouTube. AI is what has made the company's search, video, and targeted ad capabilities best-in-class and is the driving force behind the company's success in voice (Google Home) and autonomous driving (Waymo). Furthermore, we believe it is this AI expertise that will also make the company more prevalent in other industries, including healthcare via its subsidiary Verily, as AI and machine learning continue to disrupt operations across industries. As of late 2025, Google's Gemini app had over 650 million monthly active users. Adding to our positive view of the company's future opportunities, we believe that Alphabet's free cash flow generation and solid balance sheet set it apart and are what will allow the company to continue taking chances on far-out, ground-breaking, and potentially world-changing projects, as well as fund capital returns to shareholders. We will continue to monitor advertising spend as well as the competitive landscape for the company’s core Search and Advertising business. Should we see GOOGL shares pull back near the 50-day moving average, near $295, that incremental upside to our price target would give us sufficient reason to revisit our Two rating.
Target Price: Reiterate $365; Rating: Two
Panic Point: $263
RISKS: Regulatory risk (data privacy), competition, and macroeconomic slowdown impacting consumers and therefore ad buyer activity.
American Express AXP; $302.48; 655 shares; 3.83%; Sector: Financial Services
UPDATE: The 2026 slide in shares of American Express (AXP) continued in March, leaving the stock down more than 20% from their early January high near $385. On March 23, we picked up some additional AXP shares near $303, at almost the same price we last added back in early August. Our view on AXP shares continues to hinge on the Platinum Card refresh cycle — how that membership-driven business model benefits and the corresponding benefits more than offset the cost of the Platinum card. Those views were underscored in the 2026 Chairman’s Letter to Shareholders, which also shed more than a little light on how American Express is leveraging AI in its member relationships and internally to drive productivity. Our central thesis on AXP shares surround the company’s card refresh efforts and the impact on net card fees. We saw some improvement in net card fee revenue during the December quarter as the initial phase of that refresh cycle lifted average fee per card and the number of cards in force. As the Platinum Card refresh and others continue, we should see a step function lift in net card fees and earnings. Given the different benefits associated with the refresh effort, including monthly digital streaming credits and dining credits, among others, we should see a steady climb in average fee per card and the number of cards in force. In late March, Amex was named the official payments partner of the National Football League starting with the 2026 season. The agreement will give American Express cardholders access to ticket presales, on-site experiences and other perks at select NFL events in the U.S. and abroad. Amex also shared it plans to launch the NFL Extra Points American Express credit card later this year in the U.S., issued by Community Capital Bank, which will offer fans rewards tied to NFL purchases and experiences. We see this win helping build the funnel for the company’s premium card offerings.
March Price Change: -2.1%; Yield: 1.23%
INVESTMENT THESIS: American Express is a globally integrated, membership-driven payments company, providing customers with access to products, insights, and experiences that enrich lives and build business success. The company has four reportable operating segments: U.S. Consumer Services (USCS), Commercial Services (CS), International Card Services (ICS), and Global Merchant and Network Services (GMNS). American Express targets the premium consumer space by continuing to deliver membership benefits that span our customers’ everyday spending, borrowing, travel, and lifestyle needs, expanding its roster of business partners around the globe, and developing a range of experiences that attract high-spending customers. In 2025, the company’s net card fee revenue accounted for 72% of its pre-tax income, which we see providing a differentiated business model that should continue to grow as Amex wins new card members and drives its average fee per card higher.
Target Price: Reiterate $400; Rating: Two
Panic Point: $315
RISKS: Slowdown in consumer spending, competition, membership growth, merchant acceptance, and lack of new product innovation.
Apple AAPL; $253.79; 825 shares; 4.04%; Sector: Technology
UPDATE: Shares of Apple (AAPL) tumbled out of the gate in March but found their footing and recovered some of that lost ground to finish the month down just under 4%. For the Q1 2026 quarter, AAPL was down 6.65%, placing it between the S&P 500 and the Nasdaq Composite. We are sitting on the sidelines at least for now with AAPL shares given the seasonal slump in smartphone volumes but also because chip industry capacity has shifted to favor more lucrative AI and data center chips. During March, Apple unveiled a number of new hardware products, refreshing its lineup, but we remain focused on the pending overhaul for an AI-enabled Siri. Apple has much riding on this, in our view, and a failure to delight customers would raise fresh questions about its AI strategy. However, if Apple delivers, such an offering has the potential to kickstart the long-awaited iPhone upgrade cycle. We will continue to evaluate upcoming beta software releases, but all signs point to Apple unveiling its new and improved Siri at its upcoming WWDC event this June. Between now and then we’ll continue to track smartphone and other connected device data points, as well as chatter on the expected iPhone Fold.
March Price Change: -3.9%; Yield: 0.39%
INVESTMENT THESIS: While we acknowledge that near-to-mid-term performance remains heavily influenced by iPhone sales, the dynamic is shifting as investors finally place greater emphasis on Services growth. We are bullish on the 5G upgrade cycle and believe longer-term upside will continue to come as Services revenue grows its share of overall sales. Services provide for a recurring revenue stream at higher margins, a factor that serves to reduce earnings volatility while allowing for a higher percentage of sales to fall to the bottom line; as a result, we believe that Services growth and the installed base are much more important than how many devices the company can sell in each 90-day period. In addition to improved profitability, we also believe the transparent nature of this revenue stream will demand an expanded price-to-earnings multiple as segment sales grow. Furthermore, we believe that Apple's desire to push deeper into the healthcare arena will help make its devices invaluable as more life-changing features are added and the company works to democratize health records.
Target Price: Reiterate $305; Rating: Two
Panic Point: $222
RISKS: Slowdown in consumer spending, competition, lack of new product innovation, elongated replacement cycles, and failure to execute on Services growth initiatives.
Applied Materials AMAT; $341.79; 282 shares; 1.86%; Sector: Semiconductors
UPDATE: On March 19, we added shares of Applied Materials (AMAT) to the Bullpen and subsequently called them up to the Pro Portfolio on March 23 to capitalize on the accelerating wave of AI and data center investment that is driving a multiyear expansion in semiconductor capital spending. AI-driven demand from hyperscalers and enterprises is accelerating far faster than prior expectations, fueling a multiyear surge in data center and advanced chip spending. At the same time, leading-edge capacity remains tight, with foundries running at high utilization and prioritizing high-value AI workloads, resulting in persistent supply constraints. Together, these dynamics are driving elevated equipment spending and reinforcing a durable upcycle in semiconductor capital investment. The recent market pullback gave us an opportunity to build the position at more favorable levels, aligning with our strategy of following where capital is being deployed. We have ample room to build out the Portfolio’s exposure to AMAT shares, especially with the late March move that put the shares below our cost basis. We intend to do that in a prudent fashion and revisit our current Two rating as we do so.
March Price Change: -5.9%; Yield: 0.58%
INVESTMENT THESIS: The outlook for semiconductor capital equipment, an industry that delivered ~$133 billion in 2025, remains very bright. SIA sees industry deliveries rising to $145 billion this year and $156 billion in 2027, and others see a continued step function higher through 2030. Underpinning that forecast is continued spending on AI and data centers, and corresponding equipment, as well as other connected devices, including appliances as well as cars and trucks. Applied Materials holds a leading position in the global semiconductor wafer fabrication equipment (WFE) market, with a market share estimated at approximately 19% in 2025. As a broad-portfolio supplier, it dominates in deposition (44% share) and maintains a strong presence in etch, CMP, and ion implantation tools. Major customers include TSMC, Samsung, Intel, SK Hynix, and Micron, along with key partnerships involving Apple and Texas Instruments
Target Price: Reiterate $425; Rating: Two
Panic Point: $290
RISKS: Customer capital spending levels, currency, and economic risk.
Eaton Corp. ETN; $357.67; 545 shares; 3.76%; Sector: Industrials
UPDATE: The decision for the Portfolio to lock in a 38% gain on a slice of Eaton (ETN) shares in February was reaffirmed by the stock’s March performance. While the shares pulled back in line with the Nasdaq Composite, unlike that index or the S&P 500, ETN closed Q1 2026 up more than 12%, making them a solid performer for the Portfolio during the quarter. The main drivers of Eaton’s business are the multi-year capital spending boom associated with electric utility capital plans, which reflects continued data center buildout as well as other forces impacting the grid. We flagged the $103 billion multi-year spending plan at Duke Energy, but to that we can add American Electric Power said that it sees an additional $5 billion-$8 billion in transmission and generation projects on top of its current $72 billion five-year capital plan. AEP noted it signed agreements for an additional 28 gigawatts (GW) of load since last October, bringing the incremental demand to 56 GW of new load by 2030. During the last week of February, Dominion Energy shared plans to increase its five-year total capital spending plan by 30% to $65 billion. Deloitte sees U.S. power sector investments reaching $1.4 trillion between 2025 and 2030. This six-year outlay is equivalent to the total capital expenditure of the U.S. power sector over the preceding 12 years, underscoring the challenge and the opportunity that lies ahead. The ICF projects significant increases in U.S. electricity demand over the next 25 years, with demand rising 25% by 2030 and 78% by 2050. In the near term, the U.S. Energy Information Administration (EIA) has raised its projections for electricity consumption in the country, citing a spike in power demand from commercial sectors — especially data centers — as a key driver. The outlook for Eaton’s Aerospace business also looks bright, given the record backlog at Boeing. In late January, Eaton announced it would spin off its lower-margin and more cyclical Vehicle and eMobility businesses in 2027. The remaining Eaton will derive 83% of its revenue from electrification and the balance from Aerospace. We will continue to monitor progress on that transaction, but we like that it means the Eaton story will become a more focused one. Following ETN’s pullback in March, we are revisiting our current Two rating.
March Price Change: -4.9%; Yield: 1.11%
INVESTMENT THESIS: Eaton is an intelligent power management company that makes products for data center, utilities, industrial, commercial, machine building, residential, aerospace, and mobility markets. That business is positioned to capitalize on the mega trends of electrification, energy transition, and digitalization. We see Eaton helping address the power pain point created by data center, EV charging infrastructure, and other drivers of electricity demand. Research estimates that data center power demand will grow 160% by 2030, accounting for 3% to 4% of global power, up from 1% to 2% today. Data centers will use 8% of U.S. power by 2030, compared with 3% in 2022.
Target Price: Reiterate $430; Rating: Two
Panic Point: $325
RISKS: Raw material costs, labor costs, end market volatility, and government legislation.
Labcorp Holdings Inc. LH; $266.81; 790 shares; 4.07%; Sector: Healthcare
UPDATE: Exiting February, shares of Labcorp (LH) were up ~15% YTD, but the market turmoil in March weighed on LH, leaving it up more than 6% at the end of Q1 2026. The shares remained a steady, defensive holding in the Portfolio during March, with its low-beta profile helping to buffer volatility tied to the broader market selloff. We continued to point to the company’s solid backlog, improving margins, and consistent free cash flow generation as indicators of durable underlying demand. While the shares experienced some near-term pressure, we viewed that as more of a knee-jerk reaction rather than a deterioration in fundamentals. As we have often said, the company’s business may not be sexy or one that generates much in the way of headlines, and the company remains a well-positioned play for our Aging of the Population investing theme. In 2025, Labcorp added more than 100 new tests, with an emphasis on women's health, oncology, neurology and autoimmune disease, market segments that are poised to grow 2-3x faster than the overall diagnostics market. When Labcorp reported its Q4 2025 results, trailing 12-month orders exiting 2025 stood at $3.37 billion, and its book-to-bill closed the quarter at 1.09, in line with its Q3 2025 metrics, but well ahead of those for the year-ago quarter. Exiting 2025, Labcorp’s backlog stood at $8.58 billion, up more than 5% year over year. That provides ample runway for the company, while it continues to make strides in integrating acquired businesses, driving its margins higher. During the Q4 2025 earnings conference call, management shared it has a very strong M&A pipeline and further inroads into hospital testing. Should we see a quicker pace of acquisition integration and margin expansion unfold, it may lead us to revisit our LH price target. The shares have strong support at the $264-$265 level, and while the Portfolio has a full position, we will continue to look for favorable risk to reward entry points for newer members given our $300 price target.
March Price Change: -7.7%; Yield: 1.00%
INVESTMENT THESIS: Labcorp is a global leader in innovative and comprehensive laboratory services that provide vital information to help doctors, hospitals, pharmaceutical companies, researchers, and patients make clear and confident decisions. By leveraging its diagnostics and drug development capabilities, the company provides insights and accelerates innovations to improve health and improve lives. The company is organized under two segments, consisting of Diagnostics Laboratories (Dx), which includes routine testing and specialty/esoteric testing, and Biopharma Laboratory Services (BLS), consisting of Early Development Research Laboratories and Central Laboratory Services. Our attraction to LH shares stems from the combination of the aging population driving diagnostic testing growth and the increasing array of diagnostic testing as well. That combination is expected to drive the healthcare testing services market to $12.6 billion by 2029, from $7.4 billion in 2024, according to Markets and Markets. To augment its position in oncology, women's health, autoimmune diseases, and neurology, the company has been expanding through acquisitions and partnerships with health systems and regional and local labs.
Target Price: Reiterate $300; Rating: Two
Panic Point: $228
RISKS: Macroeconomic factors, changes in healthcare reimbursement models and products, government regulations, product discontinuations, or recalls.
Microsoft Corp. MSFT; $370.17; 430 shares; 3.07%; Sector: Technology
UPDATE: March was another challenging month for Microsoft (MSFT) shares as the company continues to be painted with the software brush. The almost 6% decline in March brought MSFT shares to a more than 20% fall during Q1 2026. During the month, we lowered our MSFT price target to $500 but also said that a rebound in the shares is likely to take time. Driving our thinking on that, the market is looking to see how quickly Microsoft monetizes that $625 billion Azure backlog amid supply bottlenecks. At the same time, ramping cloud capacity is expected to restrain margins in the near term, keeping a lid on free cash flow. As we explained in our March 25 alert, many of these issues are known entities and the cumulative pullback in MSFT shares is certainly tempting. However, for us to commit more capital to the position, we would want to see the shares become a bit more oversold, a condition that would suggest a compelling risk-to-reward setup. That’s what we’ll be watching for as we move into the Q1 2026 earnings season.
March Price Change: -5.7%; Yield: 0.93%
INVESTMENT THESIS: We believe the cloud to be a secular growth trend and that the upside to the shares will result from Microsoft's hybrid cloud leadership as the company grabs market share in this expanding industry. While companies may look to build out multi-cloud environments, Microsoft's Azure offering will be a prime choice thanks to its decision to provide the same "stack" used in the public cloud to companies for their on-premises data centers. Additionally, we would note that hybrid environments are currently the preference for most companies because they allow them to maintain critical data in-house while taking advantage of the agility and scalability provided by public clouds. Outside of the cloud opportunity, we maintain a positive view on the company's growing gaming business, which we believe is becoming an increasingly prominent factor in the Microsoft growth story as gaming becomes more mainstream, management works to convert its gaming revenue from a one-time license purchase to a recurring subscription model, and as technologies like augmented/virtual reality evolve. Finally, as it relates to LinkedIn and other subscription-based services such as O365 and various Dynamics products, we continue to value them highly for their recurring revenue streams, which, we remind members, provide for greater transparency of future earnings.
Target Price: $500; Rating: Two
Panic Point: $385
RISKS: Slowdown in IT spending, competition, and cannibalization of on-premises business by the cloud.
Netflix Inc. NFLX $96.15; 1,120 shares; 2.08%; Sector: Communication Services
UPDATE: On February 26, we started a small position in Netflix (NFLX) given the growing probability the company would walk away from its announced transaction to acquire Warner Bros. Discovery. In the corresponding trade Alert, we outlined our reasons for that thinking and why we would expect a rebound in NFLX shares should the company withdraw its bid, leaving Paramount Skydance to win the bid for Warner. After the market close on February 26, Netflix announced that it declined to match Paramount's increased offer, stating that the deal was "no longer financially attractive." The removal of that overhang led to jump more than 10% in NFLX shares on Friday, February 27, making them a nice contributor to the Portfolio. Meanwhile, Netflix should pocket a $2.8 billion breakup fee associated with the terminated transaction. During March, we leaned further into our Netflix position, taking advantage of market weakness to add shares and improve our cost basis. We also raised our price target to $115 from $100, reflecting growing confidence in the company’s pricing power and expanding advertising business. Recent price increases and the expected ramp in higher-margin ad-supported tiers reinforce our view of improving revenue and margin dynamics. As a result, we continue to see Netflix as a name we are willing to build on during periods of volatility. Should we see NFLX pull back further but deliver a positive test of the 50-day moving average near $87, we would be interested in adding further to the Portfolio’s position.
March Price Change: -0.1%; Yield: 0.00%
INVESTMENT THESIS: Netflix is one of the world’s leading entertainment services offering TV series, films, games and live programming across a wide variety of genres and languages. With over 325 million paid memberships, Netflix serves a global audience approaching one billion people. In the second half of 2025, Netflix members watched 96 billion hours on Netflix, up 2% (+1.5 billion hours) year over year vs. a 1% increase in the first half of the year. We attribute that to the company’s growing slate of proprietary content, live events, including sports, and a growing market for games. The company’s revenue is ~45% from the U.S., 31% EMEA, 12% Latin America, and 11% Asia-Pacific. We see Netflix and its growing content slate well positioned to benefit from the ongoing shift to streaming from broadcast and box office content, with margins poised to benefit from a combination of pricing actions and growing exposure to the higher margin advertising revenue.
Target Price: $115, Rating: Two
Panic Point: $78
RISKS: Consumer spending and economic risk, content development and content licensing risks and competitive risks.
TJX Companies TJX; $159.70; 947 shares; 2.92%; Sector: Financial Services
UPDATE: The market pullback weighed on shares of TJX Companies (TJX) in March, but the company’s defensive positioning and its appeal to increasingly cash-strapped consumer led TJX to finish Q1 2026 up modestly compared to the market’s larger decline. We continue to view TJX as a resilient retail holding, benefiting from its off-price model in an increasingly pressured consumer environment. As inflation and higher energy costs began to weigh on discretionary spending, we pointed to TJX’s value-oriented offering as well positioned to capture trade-down behavior. We also noted supportive Wall Street commentary, including price target increases, reinforcing confidence in the company’s execution and demand outlook. While near-term market volatility weighed on shares at times, our longer-term view on TJX remained intact. During the recent earnings call, management said it sees the long-term potential to grow to 7,000 stores across its existing retail banners current countries and Spain. That suggests roughly a longer-term opportunity to open up to 1,700 locations or, said another way, grow its total store count by more than 30% compared to the 5,214 locations at the end of January. For the coming year, management anticipates opening another 146 locations, roughly 3% growth, and points to a disciplined plan to grow its number of storefronts. Understanding that the current quarter is TJX’s seasonally weakest, we’ll look to use that seasonality to our advantage should any meaningful pullbacks in the shares come about. The same goes for revisiting our current Two rating. With the company expecting to repurchase $2.5 billion to $2.75 billion of stock over the next 10 months, we may need to react quickly if and when such opportunities present themselves. On March 30, TJX announced a 12.9% dividend increase, which puts its new quarterly dividend at $0.48 per share. The first payment of the new quarterly dividend will be on June 4 to shareholders of record on May 14.
March Price Change: -1.2%; Yield: 1.05%
INVESTMENT THESIS: The TJX Companies is the leading off-price apparel and home fashions retailer in the United States and worldwide. It has over 5,200 stores and six branded e-commerce sites that offer a rapidly changing assortment of quality, fashionable, brand-name, and designer merchandise at prices generally 20% to 60% below full-price retailers’ regular prices on comparable merchandise. The company operates in four segments: Marmaxx and HomeGoods, both in the U.S.; TJX Canada, and TJX International. TJX looks to capitalize on opportunities to acquire merchandise at substantial discounts that regularly arise from the production and flow of inventory in the apparel and home fashions marketplace. These opportunities include, among others, closeouts from brands, manufacturers, and other retailers; special production direct from brands and factories; order cancellations; and manufacturer overruns. We see that positioning TJX extremely well, as consumers feel the pinch of ongoing inflation pressures and their efforts to stretch the disposable spending dollars they do have, including tapping discounted shopping locations.
Target Price: $180; Rating: Two
Panic Point: $132
RISKS: Operational, strategic buying, and competitive risks, as well as consumer spending patterns.
United Rentals URI; $728.56; 235 shares; 3.31%; Sector: Industrials
UPDATE: United Rentals (URI) shares were not immune to the market’s March volatility, and fell in the low double-digits as macro concerns around rates and construction activity picked up. That said, we continue to see the company as a key beneficiary of infrastructure spending and reshoring-driven project demand, supported by solid backlog visibility. While near-term conditions could remain choppy, URI’s execution and pricing power keep us constructive on the shares. For now, we’re inclined to use pullbacks opportunistically rather than step aside. We flagged winter weather in January and February as a near-term headwind for United Rentals, as project delays can weigh on utilization rates and rental activity. That said, this is more about timing than demand destruction, with work typically pushed into subsequent quarters. As conditions improve, we’d expect a rebound in activity supported by existing backlog and infrastructure spending. Sweetening the bottom-line performance ahead, URI shared that it would use the $350 million remaining under its existing share repurchase program, and that it will be followed by a fresh $5 billion repurchase program. Management signaled it expects to repurchase that $350 million in the current quarter and targets an additional $1.15 billion in 2026. Given the post-earnings selloff in late January and again in March, we suspect URI may have tapped that new program sooner rather than later. Let’s also remember that URI recently upped its quarterly dividend by 10% to $1.97 per share, a signal of the demand outlook it should enjoy in the coming years. With the shares below our panic point, we are evaluating buying points, but we may not make any moves until URI reports its Q1 2026 results so as to let any weather-related impact be fully baked into the stock price.
March Price Change: -13.3%; Yield: 0.94%
INVESTMENT THESIS: United Rentals, the largest equipment rental company in the world, operates throughout the United States and Canada, and has a limited presence in Europe, Australia, and New Zealand. It serves industrial and other non-construction, commercial (or private non-residential) construction, and residential construction. Industrial and other non-construction rentals represented approximately 50% of rental revenue, primarily reflecting rentals to manufacturers, energy companies, chemical companies, paper mills, railroads, shipbuilders, utilities, retailers and infrastructure entities; commercial construction rentals represented approximately 46% of rental revenue, primarily reflecting rentals related to the construction and remodeling of facilities for office space, lodging, healthcare, entertainment and other commercial purposes; and residential rentals around 4% of revenue. We see the company benefiting on three fronts — the seasonal uptick in construction spending, the release of funds and projects associated with the five-year Biden administration infrastructure bill, data center construction and other re-shoring projects, and the company's nip-and-tuck acquisition strategy that should further enhance its geographic footprint.
Target Price: Reiterate $950; Rating: Two
Panic Point: $775
RISKS: Industry and economic risk, competition and competitive pressures, and acquisition risk.
Welltower Inc. WELL; $197.71; 640 shares; 2.44%; Sector: Real Estate
UPDATE: While March was a quiet month for Welltower (WELL) from a news perspective, the market’s volatility still weighed on the company’s shares, leaving them up more than 6% in Q1 2026. We see Welltower well-positioned for the intersection of the demographic shift billed as the “silver tsunami” and the shortage of senior living capacity that is expected to persist for the next several years. To that end, we shared multiple signals with you about those two powerful and intersecting tailwinds. What we like even more is the move by Welltower to focus its business on senior housing by exiting its outpatient medical assets. Welltower has made considerable strides on that front and is tracking to have that disposition wrapped up by mid-2026. In looking at the company’s same-store net operating income (SSNOI) growth in Q4 2025 of 15.0%, it was primarily driven by the SSNOI growth of 20% for its senior housing portfolio. By comparison, with SSNOI in the low single digits for its outpatient medical and long-term/post-acute care assets, we can see why Welltower is interested in becoming a more focused senior housing play. This suggests we should see a quicker pace of overall SSNOI growth as senior housing becomes an ever-larger part of the pie in the coming quarters. That is why we remain owners of WELL shares. If WELL shares pulled back near $190, we would consider adding back some shares as well as revisiting our Two rating.
March Price Change: -4.5%; Yield: 1.46%
INVESTMENT THESIS: Welltower, a real estate investment trust (REIT), owns interests in properties concentrated in major, high-growth markets in the United States, Canada, and the United Kingdom, consisting of seniors housing, post-acute communities, and outpatient medical properties. We see the company benefiting from the intersection of the demographic shift that is the aging population and the looming pain point that is the shortage of inventory for senior housing, which fell below 1% in Q2 2025, according to the National Investment Center for Seniors Housing & Care. Over the next five years, more than 4 million boomers will hit age 80, and that’s in addition to the roughly 4% of the U.S. population that is 80-plus years old in 2024. As this demographic shift unfolds, we should see a relatively steady growth rate in Welltower’s revenue, NOI, and FFO, which, in turn, given its REIT status, should drive its payable dividend stream higher. Because of the favorable demographic tailwind and lower interest rate path telegraphed by the Federal Reserve, which should reduce construction costs over time, as well as bring REIT stocks back into favor, we intend to be long-term holders of WELL shares. Our plan is to build the position size methodically, increasing the Portfolio’s dividend stream along the way.
Target Price: $230; Rating: Two
Panic Point: $175
RISKS: Operational risk, operator and tenant risk, competitive risks, and acquisition risk.
Waste Management WM; $229.79; 795 shares; 3.53%; Sector: Industrials
UPDATE: Shares of Waste Management (WM) retreated more than 4% in March despite a very quiet month for the company. For us, the core story of inelastic pricing power and leveraging the combination of automation and cost containment at the core WM business remains in place. WM management is also delivering on growing the "Healthcare Solutions" business, which posted a more than 50% increase in net operating revenue in the most recent quarter compared to year-ago levels. We continue to like the long-term prospects for that business as management continues to pull costs out of it. We could see further improvement in margins and opex leverage at the legacy WM business as management targets a price increase between 5.4%-5.8% for that business. And an average price increase of 3% is also targeted for the Healthcare Solutions business. That suggests we should continue to see robust operating cash flow and free cash flow and let’s not forget WM previously announced it would restart its share-repurchase program to the tune of $2 billion in 2026. Given the uptick in gas and diesel prices, we’ll be looking to see if Waste utilize fuel surcharge pricing to offset margin pressure, and if not, we could see slower margin gains in the near-term and potentially some downward EPS revisions. We’ll look to let that risk get baked into the shares, but we’ll note strong support near $222, a level we’ll keep our eyes on.
March Price Change: -4.6%; Yield: 1.57%
INVESTMENT THESIS: Waste Management’s core business is the inelastic waste removal business for residential, enterprise, and other customers. The company has built its footprint through a series of acquisitions and excelled at wringing costs out of them, driving free cash flow, dividends, and funding incremental acquisition activity. While the residential business is sticky, the commercial business should continue to benefit from non-residential construction activity. Margins should continue to inch higher due to disciplined pricing and increasing use of automation. We are in the early days of WM Healthcare Solutions, but we see the business growing as management integrates and cross-sells against its core business and flexes the ability to integrate nip-and-tuck acquisitions as it has at the core waste business. Here, too, we see room to consolidate a fragmented industry, which makes this a natural fit for Waste Management.
Target Price: $255; Rating: Two
Panic Point: $190
RISKS: Industry and economic risk, competition and competitive pressures, and acquisition risk.
Not Rated
EPS Diplomats Model; 2.17%; Sector: N/M
UPDATE: On March 31, we closed out the EPS Diplomats basket for Q1 2026 that included the shares of Credo Technology (CRDO) , Equinox Gold (EQX) , SiTime Corp. (SITM) , Pan American Silver (PAAS) , Lumentum (LITE) , Kinross Gold (KGC) , Carvana (CVNA) , and IAMGold Corp. (IAG) . That basket returned more than 5% in Q1 2026, compared to a 5.1% drop in the S&P 500. On April 1, we reconstituted the basket and increased the Portfolio’s starting exposure to 4% of its assets. As such, the new EPS Diplomats basket at the start of Q2 2026 included initial 0.5% position sizes in shares of Bloom Energy (BE) , Ciena (CIEN) , Credo, Eldorado Gold (EGO) , Hudbay Minerals (HBM) , Lumentum, Micron Technology (MU) , and Rocket Companies (RKT) . Given the nature of the model, the only time we may adjust its composition during the quarter is if a company is acquired. Otherwise, the model is set until the next reconstitution. As such, there are no price targets or ratings for each of the positions that make up the basket. That same selection process will be repeated quarterly, which means housekeeping for the model should be minimal. It also means you can expect minimal activity to occur at quarter-end and the start of the new quarter. The next reconstitution cycle for the EPS Diplomats model will be June 30 and July 1.
March Price Change: 2.2%
INVESTMENT THESIS: EPS Diplomats is a model of large-cap companies that offer the fastest rate of EPS growth over a multi-year period. That basket is screened regardless of industry sector or sub-sector, which means the down-selected list of companies can span a wide array of sectors. The focus is on earnings growth because earnings growth is often seen as a signal of a company's competitive strength, operational efficiencies, and future growth potential. Shares of companies that provide historically consistent earnings growth faster than the stock market receive premium valuations compared to those awarded to the S&P 500. And as we’ve often discussed with you, multiple expansion paired with earnings growth tends to drive outperformance relative to the market, better known as alpha. The basket of eight stocks is reconstituted on a quarterly basis to reflect updated EPS expectations for the current year and the following one.
Target Price: N/M
Panic Point: N/M
RISKS: Macro and end market risk, individual company risk, and consensus EPS expectations.
